From a Right to Schooling to a Right to Learning: Rethinking education finance

India’s elementary education system is at a crossroads. In 2009, the Indian Parliament passed the Right to Education (RTE) Act guaranteeing the provision of free and compulsory education to all children between the ages of 6 to 14 years. At the heart of the law is a guarantee to ensure ‘age-appropriate mainstreaming’ for all children.  In other words, the Act is a guarantee that every child in India acquires skills and knowledge appropriate to her age. Now, as efforts to deliver on this guarantee gain ground, the country faces an important choice: should elementary education be delivered through the current model that focuses on the expansion of schooling through a top-down, centralized delivery system? Or should we use the RTE as an opportunity to fundamentally alter the current system and create a bottom-up delivery model that builds on an understanding of children’s learning needs and privileges accountability for learning rather than schooling?

For decades, the primary goal of the Indian government’s elementary education policy has been to create a universal elementary education system by expanding schooling through inputs. Substantial finances have been provided to meet this goal. Between 2007-08 and 2009-10, India’s elementary education budget increased from Rs. 68,710 to Rs. 97,255 crore in 2009-10.[2]

Most of this money has been used to build school-level inputs through a large education bureaucracy controlled and managed by state and central governments. To illustrate, PAISA analyzed the elementary education budgets of 7 states in the country for 2009-10 and 2010-11 (see Table 1 below for a state by state analysis).  According to PAISA, on average, 77% of the education budget is invested in teachers and management costs. All critical teacher-related decision-making, for instance hiring or salary payment, lies with the state administration.[3] Following teachers, the next largest investment is on the creation of school infrastructure – 15% of the budget. Funds for infrastructure development are often channeled to schools; however, key decisions related to sanctions and procurement are taken by the district. Importantly, while a school can demand infrastructure funds, it has no decision-making power over the timing of receipt of these funds and de-facto funds have to be spent based on priorities set by the state and district administration.  Interventions aimed directly at children, such as the provision of free textbooks and uniforms and addressing the problem of out of school children, account for just 7% of the total investment.

Table 1.  Breakdown of elementary education budgets in 7 states

Andhra Pradesh Bihar Himachal Pradesh Madhya Pradesh Mahara-shtra Rajasthan West Bengal
Teachers 72% 59% 79% 64% 86% 83% 67%
School 13% 25% 9% 21% 5% 9% 19%
Children 4% 10% 1% 8% 5% 1% 10%
Quality 2% 1% 1% 1% 1% 2% 1%
Management 9% 4% 9% 5% 4% 4% 4%
Misc 0% 0% 1% 0% 0% 1% 0%

Interwoven in this top-down system is an intent to involve parents in decision-making. In 2001, the Government of India (GOI) launched the Sarva Shiksha Abhiyan ((SSA), now the programmatic vehicle for the delivery of the RTE) with a mandate that expenditure decisions be taken based on plans made at the school level through Village Education Committees (VEC). These plans are then aggregated at the district and state levels. Drawing on this model, the RTE mandates the creation of School Management Committees (SMCs) tasked with similar responsibilities. Despite this bottom-up planning structure, the centralized delivery system has disempowered these committees and in fact created disincentives for parental participation in a number of ways:

First, teachers, as pointed out already, are not accountable to SMCs.

Second, committees have spending powers over very little money. In 2010-11, committees had spending powers over just about 5% of SSA funds. Even these funds are expected to be spent based on norms set by GOI. So, if a school wants to spend more than the norm on, say, purchasing teacher material or if a school wants to invest more in improving children’s reading capabilities by dipping in to its maintenance fund – it can’t. Table 2 below offers an illustrative example from Hyderabad of the different activities over which an SMC can actually take decisions.

Third, governance inefficiencies further curtail SMC powers. As PAISA has repeatedly pointed out, school grants rarely reach schools before October (the PAISA district studies found that on average school grants reach school bank accounts toward the end of September/early October). These delays in fund flows mean that needs at the school often remain unmet owing to lack of money. More worryingly, PAISA found that in many districts, expenditures even for school grants are based on formal or informal orders received from district and block officials. Consequently, often monies are spent without adequate consideration to school needs.

In essence, SSA has promoted a bottom-up delivery system with no bottom-up control or decision-making power. The result is thus a de-facto centralized, top-down system.

Table 2.  Activities for which SMCs in Hyderabad city can take decisions

 Activity Is SMC resolution sufficient? Is any additional approval needed? From whom? How long will it take? Who can do the procurement or appointment? What documents and other things will be needed?
Desks and Chairs No Yes SSA Planning 2 months SSA office Approval of design; Three quotations from local suppliers
Sintex Water Tank Yes No 2 weeks SMC Local purchase at PWD rates
Roof Repair No Yes SSA Civil / JE 1 month SMC+SSA Approval of work and measurements; Materials bought locally as per PWD rates; vouchers of payments received
Ayah Yes No 1 week SMC Interview Notice with Date and Time

The shift towards enhancing learning requires that the system focus on the needs of individual schools and children. GOI has argued that implementing the RTE requires a system that recognizes ‘the need for the creation of capacity within the education system and the school for addressing the diversified learning needs of different groups of children who are now in the school system.’[4]

School Management Committees hold the key to implementing such a decentralized structure. The first and most critical step therefore in the shift from schooling to learning will be to empower school management committees. There are three immediate reform measures that could be implemented to achieve this goal:

  1. Moving away from the current norm-based funding system for SMCs to an untied block grant structure that would enable the school to take spending decisions based on its own felt needs. The quantum of the grant could be determined on the basis of per-child enrollment in schools, thus linking grant amounts with school-specific characteristics.
  2. Strengthening planning capacity through focused community level trainings. With the launch of RTE, budgets for community training have been significantly enhanced. However, for the moment, much of this money remains unspent as training is not priority. Prioritizing training and developing innovative methods to build planning capacity at the SMC level is essential.
  3. Strengthening transparency and monitoring. A transparent tracking system holds the key to a strong, accountable decentralized system of delivery. Building structure to ensure real time tracking of finances is thus critical.

Will this lead to more learning for schoolchildren? At the very least, such a system will serve to strengthen parent engagement and ownership with the school and encourage accountability to parents. This is a critical first step.


[1] Director, Accountability Initiative, Centre for Policy Research. This is a summary version of a longer introduction to the PAISA District Studies, 2011. For those interested, the study is available on the following link: www.accountabilityindia.in

[2] Ministry of Human Resource Development (2011) ‘Analysis of Budgeted Expenditure on Education 2007-08 to 2009-10’, Statement No. 7, Plan and Non-Plan Budgeted Expenditure on Elementary Education (Revenue Account), www.education.nic.in/planbudget/ABE-2007-10.pdf

[3] Some states like Bihar and Madhya Pradesh experimented with decentralizing the hiring process to local governments, who were empowered only to hire contract teachers. However, even here all critical decisions related to salaries and regularization remained with the administration.

[4] Ministry of Human Resource Development (2011), ‘ Sarva ShIksha Abhiyan: Framework of Implementation’

 

Field notes: Education priorities in Nalanda [Dec 2011]

In December, Bihar is cold and Nalanda even colder. The fog doesn’t lift till 10.30am and the sun’s warming rays disappear at 5.30pm, heralding the start of a bitter, 3-6 degree chill that lasts for the next fifteen hours or so. Along the roads, cows are blanketed with roughly sewn together vegetable sacks while horses stand shivering uncontrollably. Indoors, there is respite from the wind but not from the cold and with frequent power cuts, even those wealthy enough to be able to access hot water have to go without. If the weather wasn’t bad enough, the 2011 PAISA survey revealed that while the district has been focusing on infrastructure and inputs (building more school toilets and maintaining high levels of training for its teachers), it has some of the highest teacher and classroom to pupil ratios (1:50) in our 9 district study, only 50% of enrolled children attend school on a given day, 50% of funds actually arrive in schools and of these funds, only 50% are spent. Perhaps it is not surprising then that between 09/10 and 10/11, ASER reported that learning levels had fallen on average by 10 percentage points in the district.

The purpose of my trip was to acquaint myself with schools in the district and to meet officials, in order to understand their perspectives on the gains that had been made over the last few years, the challenges they faced and how they thought existing issues could be resolved.  My selection criteria for 6 schools was simple – two good schools and two bad (as determined by Pratham agents on the ground), one far from a main road and one that was caste based. The good ones felt lively – there was an energy in the children, the staff seemed proactive and registers and financial records were well kept and organized. The bad were awful – crumbling buildings, a dearth of children even at midday (approx 30% attendance), absent teachers (4 out of 5 in one case) and angry SMC members who sought us out in the school and vented their frustration with both the headmaster and the block level officials.

The remote school was around 8km from a main road but accessible only along a poorly maintained dirt track across open fields. Making our way in our 4×4, we ended up picking up teachers on their way to school. Even with the benefit of our ad hoc shuttle service the school only opened its gates at 10.30, half an hour after it was supposed to have started. Finally, the caste specific school we visited was for Mahadalits; two classrooms in one of the most ‘kaccha’ buildings I have ever seen – exposed bricks and cement, corrugated steel sheets crudely placed over the top, knocked through holes in the walls for windows and the flimsiest of rugs on a dirt floor for the children. And this was considered to be progress as six months back there hadn’t even been a school here with children being taught under the open sky.

Everyone I met with was unanimous in their identification of the key problems. The first for all of them was about the number of teachers available. At school level, one HM said that of the 100 schools in the block only 4-5 had adequate numbers of teachers while in another instance, we found 3 teachers teaching 8 classes. As for block officials, they lamented that while they needed 400 more teachers, their budgets only allowed them an additional 50. And even though the latest state wide teacher recruitment drive was underway to try and fill the gap of 300,000 required teachers, most of those we met believed not more than 100,000 could be afforded or would pass the examinations.

The second issue was student absenteeism. The majority of the schools I visited had 30-45% attendance on the day and even that was built up to between 11.30 and noon before dropping away drastically after the Mid-Day-Meal (MDM). The headmaster at the Mahadalit school believed parents did not appreciate the value of education and only sent their children for the MDM, the money parents receive for their child’s attendance and to steal teacher learning materials – an attitude mirrored by the District Education Officer who was keen to implement more awareness raising campaigns. Other SSA officials were not surprised, pointing to the non-existent enforcement mechanisms in the RTE that suggests the state – not parents – should be responsible for sending children to school. Lastly, a new reason I had not come across before – the issue of dual enrolment of children in both government and private schools. The high regard in which the government’s Jawahar Navodiya Schools are held by parents, alongside the fact that only children attending government schools can sit the competitive examinations to get in compel parents to enroll their children in both school types, send them just to the private schools and then have them sit the exams, giving them an advantage over the government educated kids.

The final issue is teacher absenteeism. What surprised me was the candor with which it was raised by teachers and headmasters themselves. However, they never suggested that teachers absconded but explained that the burden of official requirements was so great that of twenty teaching days in the month, they would be busy doing non-teaching duties for up to six of them. When pressed for examples, they cited roles such as being  ‘booth-level officers’, distributing admit cards, counting everything from people to animals, invigilating tests and generally being roped into doing various monitoring assignments that are generally the responsibility of block officials. As for the question of absconding (ie just not turning up), I found Mukhiyas sympathizing with the cause of the teachers, who felt this was inevitable if “the government really expected them to provide for their families on Rs7000 per month”. When I put this argument to the DEO, he responded that the salary was adequate though too many teachers were only in teaching for the money, not the kids and it was this that needed to be tackled.

Most commentators acknowledge Bihar has come a long way in the last few years: better roads, the re-establishment of the rule of law, more motivated bureaucratic machinery, massive investment in infrastructure programmes and the re-establishment of Bihari pride amongst its people. Arun Sinha’s recent book ‘Nitish Kumar and the rise of Bihar’ attributes much of the success to prioritization at the state level with the Chief Minister choosing to focus on 4 key areas: law and order, roads, healthcare and education. As pressure is maintained into the Chief Minister’s second term and as prioritization of the various tasks within these areas continues, let this blog be a small contribution to that exercise.


First PISA results for India

We’ve been reading an eye-opener of an article by Lant Pritchett posted on Ajay Shah’s blog. Here’s the link to it

http://ajayshahblog.blogspot.com/2012/01/first-pisa-results-for-india-end-of.html – First PISA results for India- The end of the beginning.

It talks about the results of the Programme for International Student Assessment (PISA) survey in which Tamil Nadu and Himachal Pradesh took place. The results are shocking. Now we need to think of the next steps.

Accountability Talk Series: Talk on “From Accountability to Agency”

Accountability Initiative, Centre for Policy Research is delighted to invite you to a talk by

Rakesh Rajani

On

From Accountability to Agency:  Fostering citizen driven change in East Africa 

Friday, November 4, 2011

11:30am – 1.00 pm

Conference Hall-II, Centre for Policy Research, Dharma Marg, Chanakyapuri, New Delhi 110021

About the Speaker:  Rakesh Rajani is the overall Head of Twaweza, meaning ‘we can make it happen’ in Swahili, a ten year initiative to foster citizen driven change and improved service delivery in East Africa. Until 2007 he was the founding Executive Director of HakiElimu, Tanzania’s leading education and democracy advocacy organization. Rakesh serves on several national and international boards, and has been a fellow of Harvard University since 1998, at present at the FXB Center for Health and Human Rights. He has written and edited over 300 papers and popular publications in English and Swahili. Rakesh graduated from Brandeis and Harvard universities in the USA.


Please RSVP at: [email protected]

Window on the Sarva Shiksha Abhiyan, ASER and PAISA: Notes from Bhopal and Beyond

Two weeks into a new job, there is nothing quite as refreshing as a field visit to gain a deeper sense of the nature of work one has embarked upon. So it was that, along with another colleague, I set off for Madhya Pradesh (MP) last week to meet state officials of the Sarva Shiksha Abhiyan (SSA) and observe the survey implementation for the Annual Status of Education Report (ASER). As regular readers of this blog may already know, while the PAISA District Survey tracks SSA fund flows and expenditure in great detail in ten districts across the country, the PAISA national survey (done in partnership with ASER) provides grant information at the state and national levels. [1]

On the agenda for the first day was a visit to the Rajya Shiksha Kendra (RSK − the state SSA office) to get an overview of the SSA, where we met with two state officials looking after finance and girls’ education. Both officials we met were particularly proud of the MP SSA portal, where information from the blocks and districts, including on school demands, budget and expenditure, and school report cards is regularly updated. When asked about delays in funds reaching the schools, the Financial Manager we met attributed it to the recruitment of new cluster coordinators during the current school year and to delays in the annual verification of bank accounts of individual schools – which are generally with different banks. Taking into account the long, drawn-out nature of the verification process, the state government is currently in the midst of overhauling the financial system and bank accounts are now being transferred to the same nationalised bank. The official expected delays to drop the following year (2012-13) and grants to be disbursed within the first two months of the new school year (that is, by August 2012). While it was great to see that the government was taking steps to minimise delays, upon our return to Delhi, we found that our colleagues had been given the same explanation of system overhaul not once, but twice: once in September 2010 previously in 2009!

The above visit with officials was complemented next by the school and village visits during the ASER survey. What struck me most during these visits was the lack of awareness and ownership on the part of most of the key stakeholders – the teachers, headmaster, and parents.

Surveyor taking attendance in a classroom shared by students of multiple classes, MP

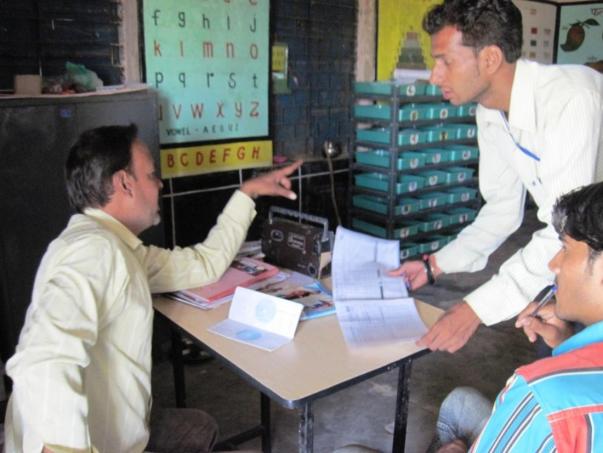
Surveyors interviewing a Headmaster during the school visit. The bright, colourful trays and charts that can be seen the background have been received to implement the new Activity-Based Learning (ABL) system under the SSA.

In one school, for instance, we met two teachers who had just joined: while one had previously been a cluster coordinator, the other had been teaching elsewhere since 2006. Yet, surprisingly, neither one was aware of their entitlements as teachers under the Right to Education (RTE) Act, 2009 (for example, entitlements to grants for teacher learning materials) nor were they able to elaborate on the contents of the training they had received in the past. This lack of ownership over their responsibility to improve learning may, in part, be attributed to a lack of the headmaster’s leadership and encouragement as well: we found that he did not seem concerned about the kinds of inputs the teachers had at their disposal to do their jobs better.

Moreover, delays in the receipt of funds were not a cause of worry for the headmaster; they arrived more than half-way into the school year and he used them as and when required. The headmaster did not seem to recognise any rules requiring him to use funds for particular purposes during the given year nor did he seem concerned about the lack of proper facilities in the school – the toilets remained unusable and water from the hand-pump was not potable. Nor was he able to distinguish between the specific purposes of each type of grant (“Haan, vo ismein se aaya hoga.” – “Yes, the expenditure may have come from this grant.”). The other teachers did not appear to have any financial responsibilities and had no knowledge of the financial accounts of the school, which were under the sole purview of the headmaster, implying they were not too involved in the decision-making process at the school.

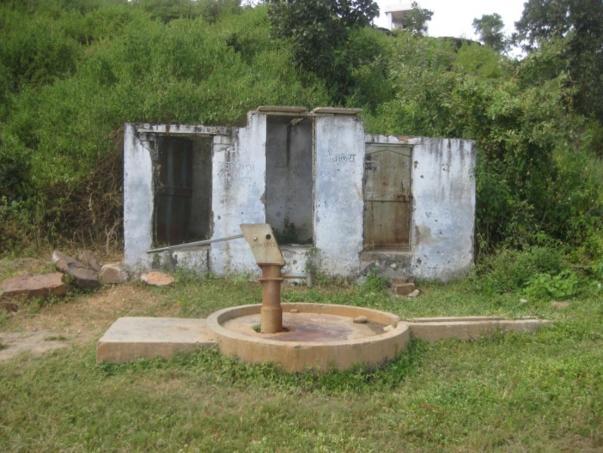
Non-functional school toilets in Kodi village, Raisen, MP

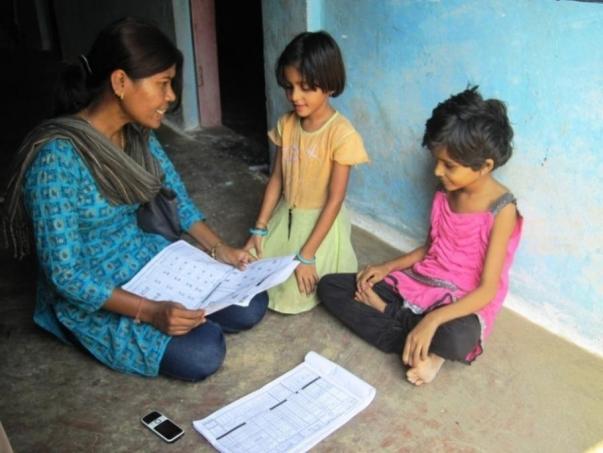
MP PAISA Associate, Swapna, interacting with students at their home and rechecking their survey responses from the day before

When we spoke with parents the following day in one of the villages about their own role in the running of the school, we found that community participation is next to nil – similar to the experiences of our colleague, Anirvan Chowdhury.[2] When asked about their contribution to the running of the school, parents stated they were aware of the existence of the school management committee; however, beyond the fact that it oversaw the mid-day meal scheme, they did not seem to know its functions.

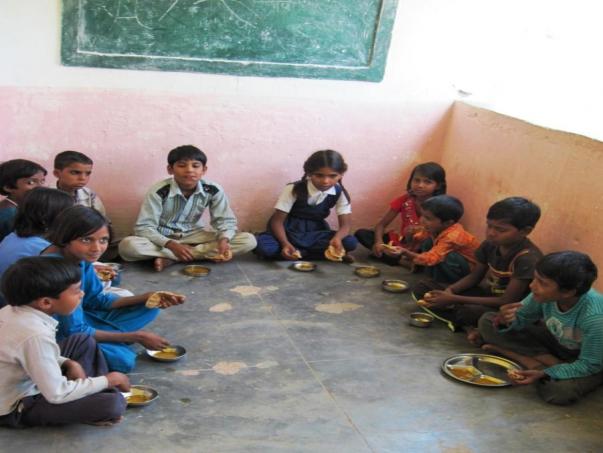
Children eating their mid-day meal at school – the food is prepared by a community member who comes to serve it each day


More importantly, they appeared to realise neither their right to be more involved, nor their own need to do so. Even though under state norms, civil works are supposed to be undertaken by the Gram Panchayat (GP), none of the families interviewed seemed to have any knowledge of this since the matter had never been discussed in a gram sabha, nor had anyone ever come to share this information with them. The headmaster himself shared that all civil works were contracted out to professionals from outside the village, implying that the school was managed and maintained without any community involvement whatsoever.


To hold teachers accountable, to establish a culture of ownership and systemic enforcement, information is key. Pandey et al. (2008) find that “providing information to communities that are unaware […] can play a useful role in changing behaviour and learning outcomes”.[3] They found that as parents began to interact more with teachers directly, teachers’ engagement in teaching improved, and some improvement was observed in learning outcomes. Only when communities are empowered with information, when they realise and enact their own role in the participatory monitoring systems that are provided for on paper, will we begin to see the heavy investments in the education sector translate into consistently improving learning outcomes.

Similarly, the argument about ownership, accountability, and enforcement can be extended to any other sphere of daily life. Throughout my time in Bhopal, I was examining what I was seeing through the prism of transparency and accountability: whether it was the auto-wallahs who asked for inflated figures because they thought they could get away with it, or the poor living conditions in which people lived around the now-abandoned Union Carbide plant. This trip was by no means my first foray away from the city into the Indian hinterlands. Yet, the enthusiasm with which the ASER survey is implemented in the districts and the issues that arose around ownership and accountability during these three days, have left me with a desire to explore the state further and venture deeper into the tracking of the education programme, especially in the MP PAISA district of Sagar. For now, however, it’s time to contend with the desk and the District Report Cards back in Delhi… ‘til next time, Madhya Pradesh!

The opinions expressed above are based on personal observations and are not meant to be representative.


[1] Facilitated by the non-governmental organization, Pratham, ASER gauges the learning levels of rural children aged 6-14 years across India. Implemented in over 560 districts, it is the largest non-governmental survey conducted in the country.

[2] Pot luck from the field

[3] Pandey, P., S. Goyal, and V. Sundararaman (2008), “Community Participation in Public Schools: The Impact of Information Campaigns in Three Indian States,” Policy Research Working Paper No. 4776, World Bank: South Asia Region.

Transparency and Participation in Public Financial Management: What Do Budget Laws Say?

Cross posted from http://blog-pfm.imf.org

An increasing number of governments, as well as international and civil society organizations, are promoting the public disclosure of budgetary information, and calling for greater citizen involvement in budget processes. Most agree that fiscal transparency generates significant benefits, as it is an important precondition for better governance, improved economic performance and prudent fiscal policy, resulting in lower deficits and debt accumulation. Moreover, transparency functions as a political expression of democratic governance, giving citizens and taxpayers information that they are entitled to, and that they can use to hold their governments accountable.

Given its increasing importance, how can transparency and participation in public financial management be promoted or improved? As a possible avenue, it is interesting to look at the role of legislation in promoting both disclosure of budgetary information and opportunities for citizen engagement in the budget process. Key questions then are: (a) to what extent does budget legislation in different countries cover issues related to budget transparency and participation, and in what level of detail? and (b) does the degree to which legislation covers issues related to public disclosure of budget information seem to affect the actual level of budget transparency in different countries?

In order to answer these questions, the International Budget Partnership gathered information on budget-related legislation across a sample of 125 countries,[1] covering different regions, levels of income and legal traditions.[2] The analysis is summarized in a Research Note, which highlights a number of interesting points:

  1. More countries than expected include transparency clauses in their budget legislation. Overall, about half of the 125 countries surveyed incorporated some mention of budget transparency in their laws. In some cases, budget transparency was covered in laws promoting fiscal responsibility or access to information, rather than in public financial management legislation. Only a handful of countries cover issues related to citizen engagement and participation in budget processes, though the few examples that exist point to some interesting ways in which citizen involvement can be promoted.
  2. Countries vary widely in the extent to which they provide detailed budget transparency provisions in their budget-related legislation. While some cite transparency merely as a principle, or stipulate the publication of a single budget document, others provide specific definitions of budget transparency, and detailed provisions on who should publish which budget documents, when, and through which means. In particular, 14 countries[3] have been identified as examples of very extensive coverage of budget transparency matters in their legislation.
  3. No clear patterns emerged from the analysis of transparency and participation in budget laws. Countries with detailed clauses do not all belong to a particular region or income group, for example. Moreover, the inclusion of detailed transparency clauses in budget laws does not necessarily result in better practice, just as the lack of laws does not inhibit good practice. When measured through the Open Budget Index, countries with more advanced transparency provisions span the whole range of possible budget transparency scores.
  4. Countries that perform well on budget transparency, and that do so without transparency laws, generally have a strong tradition of democracy and openness. In countries where such traditions do not exist or are incipient, however, new legislation can and does spur substantive reform efforts. Countries such as South Africa or Liberia have shown that legislation can be an effective driver for change and thus a useful tool to improve budget transparency. More generally, evidence shows that budget-related legislation in countries where budget transparency has improved the most over the past few years did include specific and detailed provisions on the public disclosure of budget information.

The analysis and the accompanying material available on the IBP website can be useful for civil society groups, governments and donor agencies engaged in efforts to improve budget transparency across the world. They provide ideas and suggestions on how other countries might capture not only the principle of budget transparency, but also the more detailed provisions that can turn it into a more tangible result, including the provision of opportunities for citizen participation and engagement in the budget process. This will be particularly relevant in countries that are considering reforms in their budget legislation, or where civil society organizations are struggling to gain adequate access to budget information.


[1] These included 55 countries for which budget laws currently in vigor are reported in theJoint World Bank-IMF Country Budget Law Database, as well as the countries included in the2010 Open Budget Survey, which were not covered in the WB-IMF database, and an additional 12 countries that were deemed of particular importance for comparative purposes.

[2] Generally speaking, budget-related legislation refers to laws, bills and acts that govern the management of public finances, and may go under different names in different countries. In some cases, the analysis was complemented by reviews of so-called Fiscal Responsibility legislation, and of laws regulating public access to information.

[3] Australia, Brazil, Ecuador, Liberia, New Zealand, Nigeria, Peru, Poland, Rwanda, Sierra Leone, South Africa, Turkey, Ukraine, United Kingdom.

Note: The posts on the IMF PFM Blog should not be reported as representing the views of the IMF. The views expressed are those of the authors and do not necessarily represent those of the IMF or IMF policy.

World’s First Rating of Right to Information: 89 Countries Ranked

Cross posted from http://www.access-info.org/

On International Right to Know Day, two leading human rights organisations, Access Info Europe (Spain) and the Centre for Law and Democracy (Canada), are launching the first detailed analysis of the legal framework for the right to information (RTI) in 89 countries around the world.

The RTI Rating is based on 61 Indicators drawn from a wide range of international standards on the right to information, feedback from an international Advisory Council of renowned experts on the right to information and comparative study of numerous right to information and related laws from around the world.

The findings of the RTI Rating show that there is a significant variety in the quality of the legal framework, with scores out of a maximum possible 150 ranging from 37 (Germany) to 135 (Serbia). Some of the key results:

» More recent laws protect the right to know more strongly; of the 20 countries with scores above 100, 11 adopted their RTI laws since 2005, and 7 since 2000 – these laws tend to have much stronger oversight, enforcement and promotion.

» Of the 20 countries with scores above 100, 7 are in East and Central Europe, 5 in Asia, 4 in the Americas, 3 in Africa and only one is in Western Europe;

» Europe overall accounts for 15 of the bottom 20, primarily the older European laws which are more limited in scope and have weaker appeals mechanisms;

“Effective protection of human rights like the right to information requires a sound legal basis,” said Toby Mendel, Executive Director of the Centre for Law and Democracy. “This rating tool enables us to pinpoint areas of weakness in the legal framework for RTI, and to direct future advocacy at resolving these.” 

The RTI Rating shows not only a country’s overall score, but also but also its strengths and weaknesses in relation to seven main categories: Right of Access, Scope; Requesting Procedures; Exceptions and Refusals; Appeals; Sanctions and Protections; and Promotional Measures.

The score for the legal framework did not always accord with overall levels of transparency in a country in practice. Some national experts who reviewed the AIE and CLD country assessments noted that is sometimes a gap between the quality of the law and the practice. In some northern European countries, the older legal frameworks do not fully reflect the culture of transparency in practice, whereas in countries like Azerbaijan, Nepal and Ethiopia, strong laws on paper do not necessarily reflect a fully open society; the strong laws in El Salvador and Liberia were adopted too recently to assess the practice.

“Testing of levels of transparency in practice is essential to have a full picture,” commented Helen Darbishire, Executive Director of Access Info Europe. “Adopting a law is only a first step to transparency; without accurate measures of access to information in practice, governments can participate in ‘transparency washing’ and claim greater respect for this fundamental human right than is in fact the case.”

Note for editors

  • More information about the tools used in preparing the RTI Rating, the Advisory Committee and the detailed ratings for each country can be found at: www.rti-rating.org.
  •  Access Info Europe and the Centre for Law and Democracy remain open to comments and corrections to the RTI Rating. We know that only through expert feedback will we perfect this analysis. The following countries have not yet had national reviewers and comments from experts knowing about those countries would be particularly welcome: Antigua and Barbuda, Austria, Bangladesh, Cook Islands, Denmark, Dominican Republic, Ecuador, Estonia, Greece, Guatemala, Guinea-Conakry, Iceland, Korea (South), Kosovo, Liechtenstein, Montenegro, Nicaragua, Panama, Poland, Portugal, Slovak Republic, St Vincent and the Grenadines, Switzerland, Tajikistan, Trinidad and Tobago, Tunisia and Turkey.

Mapping for local accountability

We at Transparent Chennai were looking to increase the availability of information available about the performance of individual elected representatives in office, particularly of ward councilors. But how can you best do that?

At the MP and MLA level, individual legislators are rarely associated with particular bills, and voting happens almost exclusively along party lines. As a result, when most organizations collect information about the performance of elected representatives, they look at other pieces of available information: their attendance in the legislative council or assembly, the number and kinds of questions they asked while they were there, and their spending from their local development funds. Ward councilors are slightly different: in Chennai, they propose resolutions usually related to issues affecting their constituency that are then approved by the Council and implemented.    

However, we realized that simply collecting information about resolutions, questions, and attendance, did not tell us the entire story about a ward councilor’s performance. We were also interested in outcomes – how did the ward actually fare under their leadership with respect to urban services?

This is a hard question to answer because of the paucity and inconsistency of data available to connect a legislator’s performance with outcomes at the constituency level- especially those of the city and the ward (High Powered Expert Committee 2011, 45). Official statistics on most aspects of city life, such as access to sanitation, extent and quality of sidewalks, slums, and public health are incomplete, and almost never disaggregated to the ward level. Even when data is present, it is often skewed as it fails to record (or even acknowledge) the deficiency in urban services to many of the city’s residents because they are seen to exist in the realm of the ‘informal’; like residents in a slum (see Roy 2009, High Powered Expert Committee 2011, 45).

This is why Transparent Chennai started the Ward Accountability Experiment, where we are using citizen efforts to create data about issues in urban services at the ward level, data that could potentially be used to hold elected representatives accountable for making improvements (Cavill & Sohail 2004, see also Blair 2000).

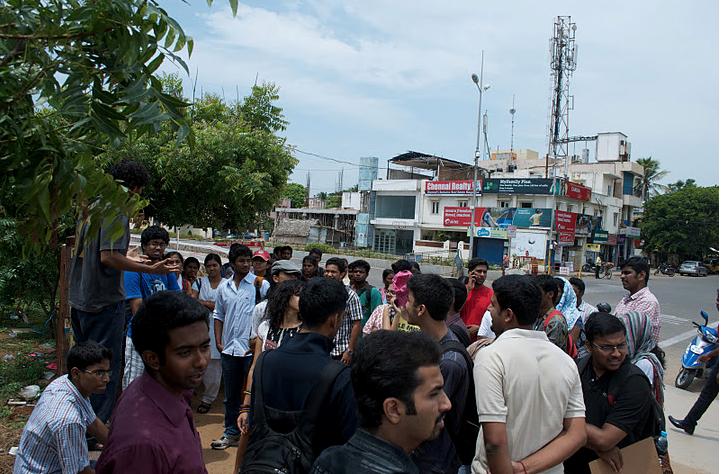
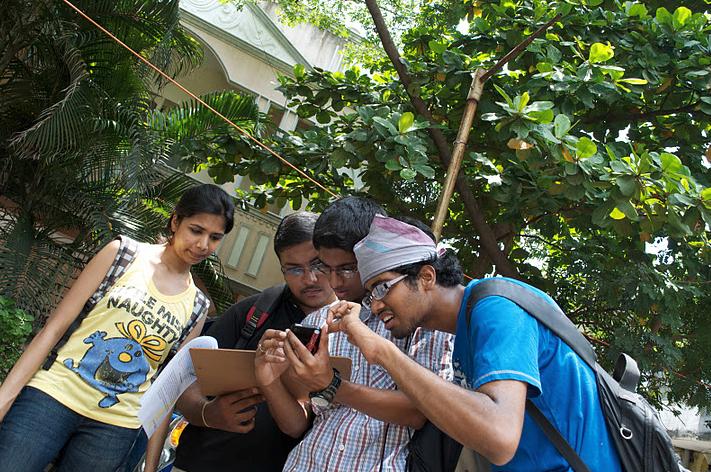
We began our efforts in a single ward. Each Saturday this September, nearly a hundred volunteers from civil society groups and colleges throughout the city walked around the streets of ward 176 (formerly ward 152 and parts of 151) in the southern part of the city, to capture data about three kinds of outcomes: public sanitation, garbage collection, walkability. We used paper maps and pencils to mark locations of piles of garbage and measured their size, and marked the locations of dustbins and whether they were usable. We found public bathrooms, and recorded their conditions. We also evaluated the road’s walkability, marking locations of broken sidewalks and problems with crossing the street. We also took photographs and videos, and filled out quick surveys to supplement the information in the map. During the survey, we also tested a mobile-app built for us by a local company to see whether GPS readings from it were accurate enough for wider use as a tool for documenting civic issues.

We also took photographs and videos, and filled out quick surveys to supplement the information in the map. During the survey, we also tested a mobile-app built for us by a local company to see whether GPS readings from it were accurate enough for wider use as a tool for documenting civic issues.

Picture1 : Students volunteers gathering before a mapping session


Picture 2: A group of volunteers testing a mobile phone application

The volunteer team worked with Transparent Chennai to digitize the data, converting it from paper to spreadsheets and digital maps that could be analyzed.

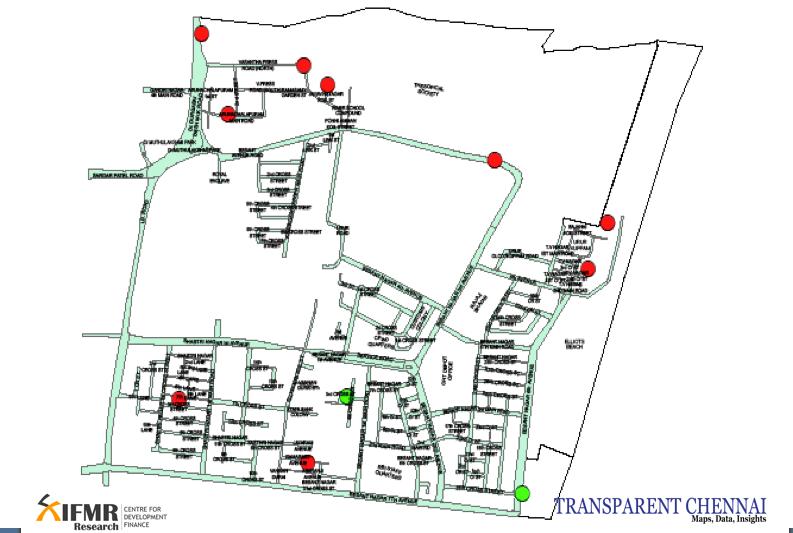
The experiment yielded strong data that underscored some of our suspicions about local conditions. 40 of 111 (36%) dustbins on 87 roads that we covered were unusable, and piles of garbage were most prevalent in the poorest parts of the ward. Only 2 of 11 public toilets met basic standards for usability (they had water, lights, and did not have any blockages). And only three out of the twenty roads that we surveyed scored well on walkability, while the rest required improvements.

Picture 3: A map showing public toilet facilities in the ward- those marked in green were deemed useable, while those in red were found to be unusable

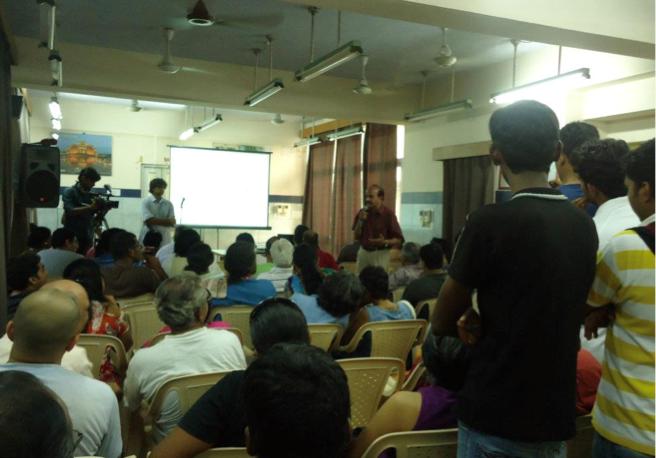
At the end of the process, we held a public meeting where we invited all the candidates for ward councilor, as well as residents from the ward. We shared the data and analysis with attendees, and invited councilor candidates to share with us their plans for the ward. Candidates came from four parties, the BJP, AIADMK, Congress and the DMK (although the last candidate came far too late to contribute to the meeting). All of them promised to take action based on the information, but both residents and press covering the event expressed skepticism about their ability and willingness to follow through on their promises.

Picture 4: A resident reflecting on the experiment during the public meeting

We plan to repeat the exercise again in 6 months to see whether the elected councilor held to their promises, and a number of the local residents who came to the meeting committed to participating in the survey next time.

For the mapping, we used low-tech paper maps, so anyone can use these tools, not just those who have access to smart phones and are familiar with the Internet. We believe that this is a crucial element to making these tools inclusive. Using our experiences from the Experiment, we will be refining the methodologies, and making them available in the form of Toolkits in both English and Tamil on our website. Our hope is that we will be able to assist volunteers from many other wards carry out similar exercises locally.

The Transparent Chennai team was overwhelmed by the enthusiasm of the volunteers, who came week after week to map local conditions and to digitize data.

But what we are most excited about is the promise behind the experiment – that citizens can actually come together and create the data they need for greater accountability of elected representatives.

Data is powerful, and what we like about the possibilities that participatory mapping has opened up for us is that anybody can easily use these tools, either with or without Transparent Chennai’s support, to create information about the city. The ability to create data levels the playing field between government and citizens, and enables citizens to take more control over their local conditions

References:

Blair, H 2000, ‘Participation and accountability at the periphery; democratic local governance in six countries, World Development, Vol. 28, No. 1, pp. 21–39

Cavill, S & Sohail, M 2004, ‘Strengthening Accountability for Urban Services’, Environment and Urbanization, vol. 16, No. 1, pp. 155-170

High Powered Expert committee 2011, Report on Indian Infrastructure and Services, High Powered expert Committee.

Roy, A 2009, ‘Why India cannot plan its cities: informality, insurgence and the idiom of urbanization’, Planning Theory, Vol. 8, No. 1, pp. 76-87.

The Specter of Manu: Fading yet visible

On April 21, 2010, a macabre incident of caste violence in Mirchpur, Haryana shocked the Indian public at large. A mob of 97 people, primarily members of the dominant Jat community, torched several Dalit houses, killing a physically challenged girl and her septuagenarian father. The violence itself escalated over an innocuous issue – that of a Dalit boy protesting to young Jats about hurling stones at his pet dog.

Not many would disagree that Manu’s four-fold occupational segregation (popularly known as the caste system) continues to define the way Indian society functions at large, matrimonial alliances being a case in point. Incidents like Mirchpur, though scattered, also continue to bring to public consciousness the fact that caste is not an issue that can be brushed aside. On the other hand, there is increasing talk of the system itself diluting: to pressures of urbanization, migration and more generally, economic liberalization. How often would you and I for instance enquire about the caste of a cook while being served food in a city restaurant? Or as Dalit scholar Chandrabhan Prasad would argue, think about the identity of women cleaning toilets in malls behind the modern veneer of gloves and a uniform?

Evidence – both in the nature of national surveys and small area studies– seems to suggest that there has been a transformation in the situation of the Dalits. In a recently concluded review of how groups traditionally excluded in India (Dalits, Adivasis and women) have fared over the 1980s and 1990s, we at the World Bank find progress on several fronts. Data from different rounds of the National Sample Survey (NSS) indicate impressive gains in post primary educational attainment among Dalit men, at a pace similar to gains registered by non-Dalit/non-Adivasi men. Village level studies reveal much greater group confidence and Dalit ability to assert oneself in public spaces (Jodhka 2008). Social movements asserting the power of Dalits seem to have swept through several states, with political ramifications. And Dalit aspirations seem to be finding a new voice in pop culture, not least in pop songs (sample for instance Punjabi music albums that sell by the name of The Fighter Chamar and Hummer Chamar) (Outlook, 2011).

Yet, and notwithstanding such gains, stories abound of upper caste parents not allowing Dalit students to sit with their children in schools or to eat together (Nambissan 2007). Dalit students continue to perform poorly in schools, perhaps on account of their own belief systems shaped by a history of prejudicial treatment (Hoff and Pandey 2004). And despite gains among men, only slightly over 10 percent of Dalit women in the 2004-05 NSS, report themselves as being educated beyond Class V.

The greatest divide between Dalits and others occurs in the labour market. National Sample Survey data suggest that for the most part, Dalit men continue to be in casual labour. Over the 20 years or so, beginning in 1983, while the proportion of Dalit men in casual labour declined slightly (from 44.6 to 41.7 percent) and in nonfarm self-employment increased slightly (from 11.0 to 15.6 percent), these changes were small to say the least. This is largely to do with the fact that historically Dalits have not owned land. Their landless status therefore excludes them from the large category of farm based employment, driving them to casual daily wage labour, more often than not in the fields of the landed upper castes.

While there has been a slight increase in the proportion of Dalit men engaged in nonfarm employment, they face huge handicaps in starting their own businesses –because they lack the social links to access credit, cheap raw material and markets to sell their produce (Jodhka and Gautam 2008). Not surprisingly, about two-fifths of Dalit men in self-employment are found in low end manual trade.

What about the salaried job market? Here we find that the real differences arise not in the proportion of Dalits and non-Dalits in regular salaried jobs (13 percent as opposed to be about 17 percent non-Dalits), but the kinds of jobs the former land even within salaried work.  In central government services, for example, despite the benefit of reservations, Dalits are vastly overrepresented in the least skilled occupational categories. To give one illustration, in 2006, almost 60 percent of the sweepers in central government ministries were Dalits, indicating that they remain as likely to undertake ritually unclean, manual work as perhaps they were centuries ago. This is what we call a glass wall i.e. a system of horizontal segregation with Dalits bound to certain occupations. Even within an occupational hierarchy, Dalits find it difficult to traverse a glass ceiling i.e. they are more likely to hold the low paying jobs.  This may be partly attributable to their low educational levels. But this is only part of the story. Upon conducting decompositions of earning differentials, we find that about 60 percent of the earnings gap between Dalits and upper caste salaried workers is on account of discrimination.

So what can help Dalits break this glass wall and/or ceiling?

One of the oft cited policy responses is higher education. However education is not necessarily a panacea. In fact, we find that in urban areas, where the bulk of salaried jobs are located; the effects of higher education on Dalit men are more muted in comparison with those on other men. While post primary education almost halves the probability of Dalit men doing casual labour as compared to if they are illiterate (from 35 to 16 percent), the drop is more marked among upper caste men (from 28 to 10 percent). In other words, the returns to higher education do not appear to be significant for Dalits. In contrast, what seemingly takes them forward is their own caste network, which serves the twin purpose of being a source of mutual insurance and of helping them respond to new opportunities (e.g. metal workers in Uttar Pradesh organizing production along caste lines). Together this history of poor returns to education combined with a self-inflicted choice to remain in one’s own social circle, mean that while caste weakens and mutates on one hand, it also solidifies and enhances on the other.

In sum, the picture on caste is mixed. We do find evidence of subtle changes looking through the lens of educational attainment, the labour market and Dalit voice and agency. These lead us to believe that caste is far from the immutable frame that Weber suggested it to be. But these changes appear as mere cracks in the glass wall. Considering their abysmally low starting points, Dalits in India still have a long way to go before they match step with the upper castes, both in education and labour market outcomes. As for Dalit voice, incidents like Mirchpur serve a grim reminder of how political assertion and empowerment through songs are yet to make a dent on the social superstructure of rural India.

Detailed findings can be found in the World Bank’s recent report on Poverty and Social Exclusion in India, prepared by a team led by Maitreyi Bordia Das.

The Power of Open

On Tuesday, September 20th 2011, President Obama formally launched the Open Government Partnership or OGP (see link1 and link2).  The Partnership, led by a steering committee of Governments and civil society organizations is a multilateral initiative to support governments to promote transparency, fight corruption and strengthen accountability.  At the launch 8 countries – Brazil, Mexico, the United States, the United Kingdom, Philippines, Indonesia, Norway, South Africa – drew up a road map for strengthening transparency, citizen engagement and accountability.  In fact, a leading civil society activist from Tanzania –Rakesh Rajani spoke at the high table during the launch. It was really very exciting to see a friend and fellow traveler speak at the event! Interestingly, India despite being a pioneer in this area is not a partner in this initiative. However,  Indian civil society was well represented at a day-long discussion called the ‘Power of Open’  organized by the steering committee to mark the formal launch of the OGP- I was there representing Accountability Initiative as was Swati Ramanathan of Janaagraha along with Nikhil Dey from the Mazdoor Kisan Shakti Sangathan who is a member of the steering committee. As I sat through the proceedings, I was struck by how the idea of open government is being closely linked to information and communication technology (ICT). Most governments have chosen to interpret the idea of ‘open government’ to mean the use of technology to collect data and monitor government processes. This interpretation is of course not surprising, considering that technology has unleashed new ways of collecting and disseminating data in ways that were unthinkable even a decade ago. As a practitioner and someone who actively uses data sets made available through the use of technology, I can hardly argue against its use. But I do wonder whether we run the risk of over emphasizing technology at the expense of much needed structural reform that might take the idea of open government further (Global Integrity has a really interesting blog on the subject).

I see this happening in India all the time. Governments in India have been quick to deploy technology solutions to deal with the accountability problem. A few months ago on a trip to Andhra Pradesh I learnt that Mandal level program officers (APO), the key officials implementing MGRNEGA at the lowest administrative unit level, have been given a subsidized mobile phone with GPS technology. Every week, a computerized program sends an SMS alert to the mobile phone with a list of worksites (randomly selected through a computer program) that the APO is expected to monitor. To ensure that the APO undertakes these monitoring visits his movements are tracked through GPS technology. The district level MGNREGA officials are expected to use this information to hold the APO to account. In another instance, the Government of Uttar Pradesh has used Interactive Voice Response System technology to introduce a monitoring system for Mid-Day Meals. This experiment is now going to be rolled out across the country (watch out for a very interesting field note on the subject which should be available on our website early next week). In another interesting experiment, the Government of Chhattisgarh is using GIS technologies to monitor the movement of food grains as they travel to various collection points in the state. The list is endless. It is, as my colleague Salimah Samji says, the era of ‘E-Raj’ in India. The benefits of E-Raj are obvious and from the point of view of a reformer, it is often the only available option. Technology solutions are difficult to oppose; after all they are markers of modernization and tie in neatly with the India Shining narrative. Thus they are relatively easy to push through the system.

But I worry that the emphasis on E-Raj  has obscured the real discussion. That we need to use GPRS technology to monitor movements of frontline staff is indicative of a deep structural problem in the organization of the bureaucracy today – it is a question of incentives and motivation, of the power dynamic within the bureaucratic hierarchy and of the relationship between the frontline worker and citizens. Resolving this problem requires much more than introducing technology. In fact I would argue that the use of technology here simply results in policing the system rather than reforming it. Dealing with this problem requires fundamental administrative reform – something no one wants to talk about.

None of this is news! That technology is no magic bullet was well recognized by most panelists at the meeting. A Tanzanian MP put the debate in perspective when he asked those of us who were speaking about the power of technology and open government “How is this relevant for my constituents who are still struggling with lack of power and have no access to the internet?”  A ready reminder that technology is a facilitator and not the only mechanism through which open government reforms can be implemented.

And to echo the Tanzanian MP’s sentiments, as the global campaign for open government gains ground, it is important that we keep reminding ourselves that open government is more than technology. It is about fundamentally transforming how government functions so that it is open, responsive and accountable.