The Big Plan Theory

A few weeks ago, the Business Standard reported that the Rangarajan Committee had recommended doing away with the distinction between plan and non-plan expenditure in the accounting sphere on grounds that it was outdated and that abolishing this would simplify the management and classification of government expenditure. While this doesn’t really fit the profile of a glamorous stranger offering a hard-boiled detective a case,[i] I was nonetheless intrigued by what I thought was a new development, and decided to investigate.

Let’s start with a brief background and a basic sketch of the suspect. The Indian budget classifies expenditures in three ways –

  1. Plan and non-plan expenditure,
  2. Revenue and capital expenditure, and
  3. Developmental and non-developmental expenditure.

These distinctions are not mutually exclusive, they are just different ways of classifying, each with its own distinct rationale and they are inter-related at least to an extent. So, let’s start with the last first.

Development expenditure, broadly speaking, includes expenditure on all activities that directly promote economic development and social welfare; some items are education, health & family welfare, water supply and sanitation, agriculture, labour and employment, irrigation, transport, rural development, science and technology amongst others. Non-development expenditure, on the other hand, includes money spent on defence, preservation of law and order, maintenance of the general organs of the government, such as the judiciary, legislature and elections. Development expenditure is thus the primary focus of five year plans.

Coming to the second classification now: capital expenditure is money spent on creation of new assets – so money spent on building a new road, a new hospital, a new school etc. would fall under this category. Money spent on activities not related to asset creation falls under the purview of revenue expenditure, for instance, interest payments, salaries of employees and all forms of maintenance expenditures.

And now, finally to the one that we are concerned with: plan vs. non-plan expenditure. Plan expenses comprises of money spent on projects that are a part of the government’s five year plan and comprise of both revenue and capital expenditure while non-plan expenditure is basically the remaining expenditure, consisting primarily of interest payments, subsidies and defence expenditure. So, a plan grant meant for establishing new hospitals can be used for both constructing buildings and salaries of project directors. Which brings us to the interesting point – there seems to be a lack of a clear economic rationale behind this classification. While it makes sense to distinguish between asset creation and maintenance as in the case of capital and revenue expenditure (though this too has had its share of detractors, but that is a story for another day), the distinction between plan and non-plan expenditure seems to have its roots in administrative convenience rather than anything else. And while this distinction may have simplified budgeting in some cases (it is very easy to tell the plan allocation/expenditure by merely glancing at the accounts; it also helps in keeping track of plan size across ministries and departments), it has created some administrative problems of its own!

To understand the first problem, let’s assume that governments (central/state/local) prefer more money to less. New projects are a bulk source of funds and thus one of the main problems with this dichotomy is that it has led to an artificial emphasis on new schemes and a corresponding neglect of existing schemes.  The 12th Finance Commission (12th FC) commented on this trend, saying that states often continue old plan schemes as part of the new plan so as to show a higher size of the plan. The plan – non-plan distinction has also led to the perception that non-plan expenditure is inherently wasteful and has to be minimized. According to the 11th Five Year Plan, this has seriously impaired the service delivery in the social sector where salary costs are high and there are frequent bans on recruitment. This stepmotherly treatment of the maintenance side led the 12th FC to attack this distinction saying that an inflated plan size is at best an “optical illusion” of development if maintenance and upgradation of service delivery of existing facilities is ignored.

For the second, we take a look at the operational aspect of a plan. Formally, the duration of the central plan is restricted to 5 years and unless there is a recognised spill-over, programmes started in a plan are transferred to the central or state governments which have a shorter planning horizon of 1 year, a single budget cycle. So, programme operation and management changes hands either within the same ministry or department or at different levels of government and what was plan expenditure till now becomes non-plan expenditure henceforth with a corresponding change in funding priorities, rules and procedures! In addition, all posts that had been created from the plan side are ferried across to the non-plan side as well and if the plan had been inflated, the non-plan side too expands.

The economist Arvind Virmani uses the example of a construction of a new specialty wing in an existing hospital to illustrate the above problems: initially funded by the plan, the wing becomes the responsibility of the hospital after construction is completed and equipment is bought. However, the budgetary rules may not have been changed and this may give rise to one or more of the following possibilities:

  1. The new wing may be underutilised or worse, remain unutilised because no new staff can be appointed
  2. The old wing may no longer be operational because the staff have been transferred to the new wing, but even so the latter is not fully functional since specialised staff may be needed to operate the new equipment
  3. Both wings are operational as new staff have been appointed, but inadequate budgetary provision towards inputs and raw materials inhibit peak operational efficiency
  4. Inadequate funds are budgeted for maintenance so the total stock of equipment declines rapidly despite the new addition, so that the quantity and quality of services supplied is barely maintained at old levels instead of increasing/improving significantly.

The final case is ubiquitous, and generally occurs in addition to one of the other three.

A curious thing that you’ve probably noticed is that I have used a lot of government reports in this blog; in fact even Dr. Virmani has served as the Chief Economic Advisor at the Department of Economic Affairs, MoF. Furthermore, the report of the 12th FC came out in November, 2004 and the 11th Five Year Plan started in 2007. Hence, the Rangarajan committee is actually reiterating (Dr. Rangarajan was the Chairman of the 12th FC) something that has been in the works for a number of years now. The Planning Commission itself stated “the case against the use of these categories, both on grounds of illogicality and dysfunctionality, is indisputable” and other mechanisms allowing rational and effective performance of requisite functions of expenditure management should be devised. The process of rationalisation was to be taken up during the 11th Plan period. We have time till December 2011 to close the case.

References

  1. The Business Standard article is available here
  2. Report of the 12th Finance Commission available here
  3. 11th Five Year Plan, Vol. 1, Chapter 3: Financing the Plan, available here
  4. Virmani, Arvind (2007) Planning For Results: The Public Accountability Information System, Planning Commission Working Paper No.1 /2007-PC available here


[i] Yes, I admit I like film noir. And so does Calvin (if you’re interested in his Tracer Bullet avatar, click here.)

Call for contributions – Socio-Legal Review

The Socio-Legal Review is calling for contributions for its eighth volume to be released in 2012.

The Socio-Legal Review (SLR) is a student-edited, peer-reviewed interdisciplinary journal published annually by the Law and Society Committee of the National Law School of India University, Bangalore. The Journal aims to be a forum that involves, promotes and engages students and scholars to express and share their ideas and opinions on themes and methodologies relating to the interface of law and society.

The Journal subscribes to an expansive view on the interpretation of “law and society” thereby keeping its basic criteria for contributions simply that of high academic merit, as long as there is a perceivable link. This would include not just writing about the role played by law in social change, or the role played by social dynamics in the formulation and implementation of law, but also writing that simply takes cognizance of legal institutions/ institutions of governance/administration, power structures in social commentary and so on. Through this effort, the journal also hopes to fill the lacunae relating to academic debate on socio-legal matters among law students.

For more information and for the guideliness for submission, interested readers can check the linked PDF file.

Deliberations on the effective implementation of Section 4 of the RTI Act

If I was asked to typify myself as belonging to the category of Friday v/s weekend people, I definitely would claim to be in the former. That said, I have some camaraderie with the latter and see some merit in their particular positionality. Consequently when I’m asked to participate in a two day long consultation exercise over the weekend, there are some mixed feelings which arise. As it turned out, the consultation turned out to be an interesting experience, so much so that I was reassured of my status- I’m now a designated Friday person.

Before I get ahead of myself let me first begin by giving a little bit of a background on the theme of the consultation exercise. The consultation was organized by DoPT and Institute of Public Administration to discuss the recommendations for the effective implementation of Section 4 of the RTI Act, 2005.  Section 4 of the RTI relates to proactive disclosure of information and covers all types of public authorities. In spite of explicit time-frame (120 days following the enactment of the Act) specified for the implementation of this important provision, the enactment thus far has largely been adhoc, varied, and parochially interpreted. Taking note of this inconsistency the Department of Personnel and Training (DoPT) under the Ministry of Personnel, Public Grievances and Pensions constituted a Task Force consisting of representatives from the government and five NGO’s working in the field of RTI, to recommend measures that need to be undertaken to strengthen its enforcement. In this respect the Terms of Reference (TOR) of the Task Force were four fold;

1)     To examine the provisions of section 4(1)(b) and to recommend the guidelines for disclosure to be made at various levels; (see http://rti.gov.in/rti-act.pdf for details)

2)     To recommend other items which may be included for suo motu disclosure as provided in section 4(1)(b)(xvii);

3)     To explore the possibility of providing simple templates for disclosing specific categories of information in order to facilitate disclosure;

4)     To recommend mediums through which such disclosure is to be made at various levels, which would include disclosure through electronic means.

The mandate of the Task Force was thus fairly extensive. The consultation was part of an exercise to deliberate on these issues through plenaries and workshops. During the consultation the mandate was discussed separately by dividing the participants into four groups such that the division of the groups largely corresponded with the TOR of the Task Force with the exception that there was one group which focussed upon the issue of pre-legislative scrutiny (relates to the creation of spaces for the public to engage with new legislation), which can be broadly interpreted as part of section 4(1) (c) of the RTI act, 2005.

Over a period of two days the groups met and discussed these issues first in their small groups and then the recommendation of each were presented and discussed with the larger group. The entire process was iterative and there were extended debates on the concerns which were raised. Principal amongst these were;

  • What is the critical amount of information that is required to be disclosed which would be informative without overburdening the citizens?
  • What type of information should be displayed at various levels of government? Should information pertaining to the entitlements be displayed at the block and the district office?
  • How should the information be displayed? Should it be displayed through information boards, or on Panchayat walls? Should it all be computerized or then should mobile technology be employed?
  • What should be the framework for pre-legislative scrutiny? What are the types of legislation which should be subject for scrutiny by citizens? How should the feedback system be structured so that the government can respond to comments raised by citizens?
  • Should there be a dedicated wing created for dealing with proactive disclosure of information? If yes should it be created as a part of the government department or should it be scheme related? How should it be funded?
  • How can information be communicated so as to be accessible to those who are illiterate and disabled?
  • How can the links be made between the measures of transparency and accountability? Can the information system be linked effectively to the grievance redressal system such that based on the information citizens can know of the avenues for filing complaints.

In the end there were some agreements which were reached and there were some issues on which it was decided that further insight and consideration was required. The one consensus however that emerged was that a variety of perspectives needed to be included to ensure that the measures suggested to the DoPT were comprehensive and relevant. Thus in the spirit of public disclosure I invite you all to share your suggestions and comments on the above mentioned concerns as well as on any other issues you believe need to be considered to strengthen the implementation of this extremely important Section of the RTI.

‘Air-ing’ some statistics

With the monsoons finally here, most of us have been stuck in airports waiting in vain for flights that have been cancelled. The lucky few have had to endure only delayed flights. With that all-consuming thought, we thought we’d do some digging around and we landed on the Directorate General of Civil Aviation (DGCA) website.

I think most people have heard our rants about bad quality government data, and if you haven’t, please see here, however sometimes it’s good to also show the other side.  The DGCA website (http://dgca.nic.in/) unlike a lot of other government websites is a virtual goldmine of information, ranging from flight cancellations, on-time performance, passenger data and passenger complaints, just to name a few.

We’d like to highlight some of this data.

1)     Market Share

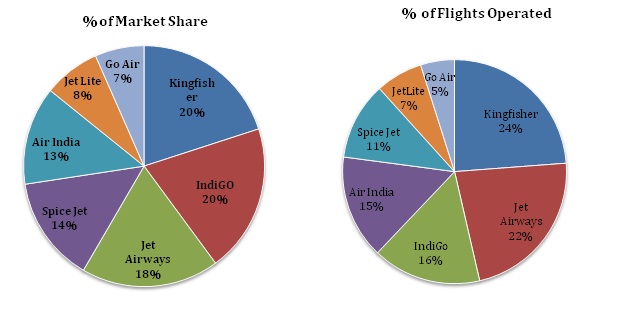
In the domestic flights section, Jet Airways and Jet Lite together account for 26.1% of the market share, followed by Kingfisher(20%) and Indigo(19.9%). Air India is much lower at 13.2% In terms of number of flights, Kingfisher and Jet Airways lead the way with 24 and 23 percent respectively with IndiGo and Air India have 16 and 15 percent respectively.


2)     Cancellation Rates

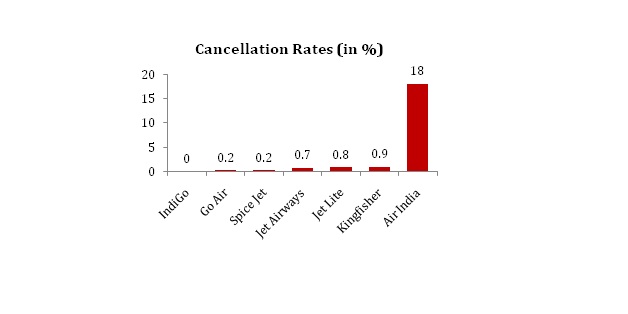
Which air-lines have the greatest number of “cancellations”? The data we have pertains to only May 2011, which is probably one of the major limitations of the website (sorry had to point this out as well) and as even a cursory glance suggests, Air India is the clear leader in terms of cancellation rates! A primary reason for this is the 10 day strike by some AI pilots, which left the airline paralysed and passengers high and dry.

3)     On-Time Performance

Over 92 percent of the flights of IndiGo and JetLite are on time whilst Spice Jet and Air India are the stragglers with 79 and 69 percent of flights on time respectively. The main reason for delays is “reactionary” (59%). This is primarily due to a vicious cycle of delayed departures and arrivals which, amongst other things, may be because of inadequate air traffic control capacity.

4)     Passenger Complaints

Figures on passenger complaints also tell an interesting story. In May 2011, despite the cancellations and delays, Air India had the least number of complaints at 1.4 complaints per 10,000 passengers. Kingfisher and JetLite also had few complaints, while surprisingly Jet Airways left a lot of travelers in a petulant mood with 3.3 complaints per 10,000 passengers.

While none of the data spouted above may help us in actually planning our travels, we thought it would be interesting to know the statistics! If this is not enough, then some good news for stranded passengers – a recent Supreme Court judgment has made it mandatory for airlines to serve passengers food and water if the airline has been delayed beyond 3 hours!!

Did You Know About the BPL Census (Part II)?

As discussed previously, the methodology of the BPL Census 2006 was criticised which led to constitution of an expert group in August 2008. According to the expert group, the focus of the Census methodology should be clearly on ‘developing methods and criteria which have best chance of being accurately executed by the government staff’, and hence ‘the criteria for identifying the BPL households should be extremely simple, clear, pertinent, least time consuming for completion, and easily understood, and not subject to multiple interpretations’.

The methodology adopted for BPL Census 2011 combines automatic inclusion of ‘poor’ households, automatic exclusion of ‘non-poor’ households and a scoring mechanism for the remaining households. The report of the expert group gives detailed guidelines about the survey process, the role of the Gram Sabha, block and district officials.

Automatic Exclusion

The households which fulfill any of the following conditions will not be surveyed for BPL status:

1)     Families which own double the land of the district average of agricultural land per agricultural household if partially or wholly irrigated (3 times if completely un-irrigated);

2)     Families owning 3 or 4 wheeled motorized vehicles;

3)     Families who own at least one mechanized farm equipment such as tractor, power tiller,  thresher, harvester etc;

4)     Families where at least one person draws a salary of Rs. 10,000 or more per month on a regular basis with pension or equivalent benefits;

5)     Families which pay income tax;

The State governments are given freedom to add more indicators if they wish.

Automatic Inclusion

The expert group took cognizance of the fact that most of the poor are often excluded from the BPL lists. As mentioned in the report of the expert group, ‘(excluding poor people) from BPL lists frequently reflect the powerlessness of the most vulnerable and are a direct function of their weak political bargaining power as a collective entity in a democracy. …To address this, the expert group felt it was imperative that the foremost task remained that of ensuring their automatic inclusion as clearly defined social and economic categories.’

Hence, destitute households, primitive tribal groups, ‘maha dalits’, single women and their dependents, households where disabled persons are bread earners, households headed by minors, homeless households and households where any member is a bonded labourer would automatically included in the list of the BPL households.

Scoring Mechanism

Once a set of households are automatically included or excluded, the remaining households would be ranked on the basis of following indicators:

Caste Points
SC/ST 3
Denotified Tribes and Designated ‘Most Backward Castes’ 2
Muslim & OBCs 1
Occupation
Landless Agricultural Worker 4
Agricultural Labourer (with some land) 3
Casual Workers 2
Self-employed artisans / fisherfolks 2
No Adult (above 30 years of age) has studies upto class 5 in the household 1
Any member of the household has TB, leprosy, disability, mental illness or HIV AIDS 1
Households headed by an old person of age 60 and above 1


Those achieving highest points would be included first, followed by the next high score and so on till one reaches the quota given to that Panchayat.

The expert group suggested that the survey should be valid for a period of 10 years. But a summary revision should be done after every 2 years to account for deaths, new households moving in and out of poverty, migration etc.

Thus, the BPL Census 2011 seems to have addressed number of concerns as far as the methodology and survey process is concerned.

As mentioned earlier, the survey has already begun on June 29, and would be completed by December 2011 in a phased manner. An interesting development is that the enumerator will ask the questions while the data entry operator will enter the responses into a hand held device which should reduce the time for collecting and processing the data. An acknowledgment slip will also be provided once the survey is done.

The methodological changes, inclusion of caste in the Census, implication of BPL numbers for the proposed food security bill and overall debate surrounding cash vs. kind transfers and targeted vs. universalised benefits of the public schemes- all this will be greatly influenced by what this Census throws up. No doubt, the results are eagerly awaited.

Did You Know About the BPL Census (Part I)?

Amidst the din about corruption, inflation and shooting by Chhota Rajan, an important piece of news received relatively less attention- launch of the fourth national socio-economic census, more popularly known as the BPL Census on June 29 in a non-descript block Hezamara in Tripura.

The objective of the exercise is to identify ‘poor’ households, who can be provided assistance under various programmes of the Central and the State governments. This round of Census is significant since

a)      the methodology of identifying ‘poor’ has been modified and improved compared to the previous BPL Census,

b)     for the first time, the Census will cover urban areas,

c)      for the first time, information about the caste of the household would also be obtained.

While it may seem easy to spot poor households in a village, the matter is not as simple when it comes to actually identifying them as ‘poor’. The methodology followed has evolved significantly since the days of the first BPL Census conducted in 1992.

BPL Census 1992

This was a relatively simple affair, which used annual income of the household as the criterion for classifying households. A household with a total income of less than Rs. 11,000 per year was considered poor. The Census estimated that 52.49% of the rural households were poor by this yardstick, almost twice of the ratio estimated by the Planning Commission.

Of course there were several issues-

a)      A family-based fixed poverty line created problems for large families with small income per head resulting in possible exclusion of poor families from the BPL category (and the opposite for the smaller families),

b)     the methodology ignored the multi-dimensional nature of poverty,

c)      given the benefits associated with the ‘BPL’ status, the respondents would have incentive to underreport his/her income, leading to over-estimation of poverty.

Realising these issues, an expert group was set up whose recommendations were incorporated in the BPL Census that was carried out in 1997.

BPL Census 1997

A number of improvements were made in this round – the criterion of determining the cut-off was changed from income to consumption; the poverty line basis was changed from household to per capita. Most importantly, before administering the questionnaire to a household to determine its consumption expenditure, a set of exclusion criteria was applied to eliminate ‘non-poor’ families straightaway. Thus, if a household was found to possess certain assets, it would be regarded as a ‘non-poor’ household and excluded from further investigations. Information about total consumption expenditure was then obtained from the remaining households. The per capita consumption expenditure so derived was compared with the (state) poverty line as derived by the Planning Commission). If the former was less than the latter, the household would be identified as a ‘BPL’ household.

This Census also estimated that 41.05% of households were poor as against 26.10% estimated by the NSSO.

Though improved, this Census had its share of criticism. The strongest criticism was against the exclusion criteria, which was regarded too stringent- possession of a ceiling fan would lead to exclusion of the household. There was no provision for adding to the BPL list by way of inclusion of households who might become poor subsequently. The exclusion criteria did not allow any geographical variations. For example, one of the exclusion criteria was whether the household operated more than 2 hectares of land. But it did not take into account the fact that income generating potential of an irrigated and non-irrigated land of the same size is vastly different.

To address these criticisms, another expert group was formed in 2002 before the next round of the Census implemented in 2006.

BPL Census 2006

The Census dropped the exclusion criteria. Instead, a score-based ranking was adopted where each household was to be ranked based on 13 indicators. They are –

  1. size of landholding,
  2. type of house,
  3. clothing,
  4. food availability,
  5. sanitation,
  6. ownership of consumer durables,
  7. literacy status,
  8. status of labour,
  9. Means of livelihood
  10. Status of Children
  11. loans from informal sources for daily consumption,
  12. migration and finally,
  13. preference for assistance.

The response to each question was scored on a scale of 0 to 4 and then aggregated. Thus, a household could score anywhere from zero to 52. The cut-off scores to identify poor were allowed to vary from state to state, subject to the constraint that ‘total number of poor persons identified in a state/ UT does not exceed the number of persons living below the poverty line in that state/ UT by more than 10% of the estimates prepared by the Planning Commission.

This methodology was severely criticised-

i)                   Even this Census did not allow for addition to the BPL list, while deletions were allowed.

ii)                 Dropping the exclusion criteria altogether increased costs and time required for enumeration. If the previous exclusion criteria were regarded as stringent, then as pointed out by some of the researchers, the solution was to modify it rather than drop it altogether.

iii)               The most serious problem was simple aggregation of scores which ignored the notion of hierarchy of basic needs. The aggregation established ‘cardinal equivalences across ordinal rankings of alternative states of households in respect of individual indicators’. Thus, having ‘less than one square meal a day for major part of the year’ gets equated with ‘open defacation’.

iv)               Questions were raised about the very utility of such an exercise. Information on a number of indicators was already available through the 2001 Census. This information could have been used for social programmes which didn’t necessarily require household level information. Even for the schemes where ranking of households would have mattered (for schemes such as ‘Antyodaya’), aggregate scores completely masked the relevant information (in this case, food availability for the household). Further, a number of anti-poverty programmes are self-targeting in nature and ranking of the households doesn’t matter.

Given this context, it would be interesting to see the methodology adopted for the latest BPL Census, the one which started on June 29.

The PAISA district surveys

For the last two months the Accountability Initiative team has been busy with the district level PAISA surveys. The district PAISA surveys are our first attempt to develop detailed district level report cards on the process of administering elementary education. Fund flows are the starting point and like the PAISA national report, the focus is on tracking the flow of funds at the school level to assess whether schools get their money, whether this money reaches on time, how this money is spent and whether these expenditures reflect school level needs and priorities. But Unlike the PAISA national report which only tracks fund flows for Sarva Shiksha Abhiyan (SSA), the district surveys track the entire gamut of monies that schools are entitled to. This includes state run incentive schemes such as scholarships and uniforms and would for the first time allow a comparison between implementation effectiveness of Centrally Sponsored Schemes and state schemes.

But our surveys are not restricted to fund flows and school level expenditures alone. The objective of this exercise is to unpack the process through which elementary education is administered on the ground. Thus our work includes analysis of the district level planning process (which determines expenditure priorities at the school level), the nature of the administrative set up at the district, block and school level including the hierarchies of decision making and the relationship that schools have with the local administration. It is our contention in PAISA that one of the key missing links to understanding accountability failures (and consequently the reasons why increased outlays have failed to improve outcomes), is an analysis of the process and mechanisms through which allocations translate in to actions on the ground. Such an analysis, we feel, is critical to understanding the specific points at which bottlenecks occur and accountability is compromised. Through this work, we hope to create an empirical base through accountability failures can be addressed.

Why does this matter? As I have argued before, it is a well acknowledged fact that India’s delivery systems are plagued with administrative inefficiencies that make accountability for outcomes near impossible. While this fact is well known, there is remarkably little empirical data on the specific nature of these inefficiencies. Even basic questions – like how much money reaches the ground have been answered through guesstimates- the most famous of these guesstimates is Rajiv Gandhi’s oft quoted comment that a mere 15 paisa of every rupee meant for the poor actually reaches them. But money apart, we know every little about how expenditure priorities are made, how the local administration makes decisions, the relationship they have with service delivery units and constraints and challenges faced at the local level. Curiously, this information is hard to access not just for citizens but also for policy makers and decision makers within the system. And so, plans are made without adequate data and consideration of local realities, needs and priorities. Consequently, we have a delivery system where annual plans are poorly designed, expenditure priorities are not grounded in local needs and inefficiencies of one year simply translate on to the next. We hope that our district surveys (and the reports that we bring out through these surveys) will be the first step toward filling this empirical gap.

In keeping with our objective of enabling change through wider citizen engagement, the survey is undertaken entirely by citizen volunteers from NGOs in the districts. The survey results will be out in October 2011. For the next few week the AI team will periodically update you on our experiences in conducting the survey. Watch this space!


Notes from the first Global Transparency Conference

Yamini Aiyar, Accountability Initiative

From May 17 -May 20, I attended the first Global Transparency Conference held at Rutgers University, Newark. The conference brought together an impressive set of over 130 papers exploring different aspects of the nature and impact of transparency policies from around the world.  All papers are available on the conference website. For all interested, this is by far the most comprehensive set of papers on different aspects of the transparency debate. 


To give you a sense of the range of papers – I presented a paper on my pet theme – the experience of conducting social audits in Andhra Pradesh. Others on my panel included a paper on fiscal transparency in local governments in China, accessible here and a paper on the implications of transparency standards on retirement polices in local government in the USA accessible here. We also had a local journalist cover our session. The link for this can be accessed here.I also chaired an interesting session featuring a series of case studies from around the world on budget transparency prepared by a group of scholars in partnership with the International Budget Partnership. Using the Open Budget Index, the panelists explored the range of factors that contribute to making budget data more transparent. We also had an interesting discussion on the role of IT in promoting the idea of open government and whether these initiatives understand the political implications (changing power dynamics and its implications) of greater access to information. Another interesting theme that emerged from the conference was the impact of transparency policies on ‘trust’ in the government. I’d never quite thought about it like this but can more transparency (knowing the in’s and out’s the good and bad – perhaps more often the bad of how government functions) impact the implicit trust relationship between citizens and the state?

The conference ended with some discussion on an agenda for further research in transparency. IT and the implications of IT policy was a recurring theme as was the need for greater empirical understanding of the impact of transparency policy on accountability.  All in all, it was 3 very well-spent days.

Field notes from Lucknow

Since May 20th, we have been in Lucknow participating in the ‘PAHELI’ workshop organized by PRATHAM. ‘PAHELI’- People’s Audit for Health, Education and Livelihood, is a rapid assessment of the prevailing status of human development in a district. The highlights of PAHELI are its participatory approach, focus on basic indicators, simple tools and easily replicable processes for collecting primary data. It combines activities, observations and questions, and uses pictorial tools wherever possible. In 2006, PAHELI focused on obtaining information about life and livelihood (availability of food, assets, loans, migration), water and sanitation (sources of water, time spent in collecting water etc.), maternal and child health (antenatal and post-natal care, immunization) and finally, education and literacy.

In this round of ‘PAHELI’, elements of the ‘PAISA’ have been added to the ‘PAHELI’ tool kit. More specifically, we are trying to collect data about  funds flow in various central government schemes which are closely related to the above mentioned points.

One simple example is ‘Janani Suraksha Yojna’, a cash transfer scheme which pays Rs. 1400 to the pregnant mother who delivers her baby in a government medical facility. ASHA- a new cadre of community health workers, are supposed to play an important role in the implementation of this scheme and receive a total of Rs.600 as incentive consisting of a component for arranging transportation, staying with the pregnant mother and thirdly a general cash incentive for her role in the safe delivery. (Details of the scheme can be found here). We are in the process of developing questionnaires. We have been piloting these tools in the nearby villages.

The following observations are based on these pilots and are hence very sketchy. Nevertheless they tell us something.

1)      Awareness: Everybody knows that the beneficiary gets Rs. 1400 if she delivers the baby in a government hospital. However, awareness levels are very low amongst the ASHAs and the beneficiary (mothers) about the accredited private institutions. One possible reason for this could be that there are no accredited private institutions in the area or very few.

Even amongst the ASHA’s, there was no clear idea about the break-up of the payment- how much is meant for transport, how much for staying with pregnant women and how much is the incentive component. The ASHA’s were only aware of the fact that they get a total of Rs. 600 as incentive.

2)      Training: ASHAs are supposed to receive 23 days of induction training within 12 months of joining and then periodic training of 2 days every alternate month. But that does not seem to be happening. With the exception of one ASHA, none of the ASHAs reported receiving training as per the norms.

3)      ASHA Incentives: Our thinking was that an ASHA would be reimbursed for whatever expenses she incurs in facilitating the delivery of the pregnant women. But that does not seem to be the case. From what we gathered from some of the ASHAs, they get Rs. 600 (which is as per the rule) but no reimbursement. Hence in quite a few cases, the ASHAs reported spending money from their own pocket. A natural question that then arises is, why would anybody want to be an ASHA in such a situation. This might also, to some extent explain why they are taking money from the beneficiaries.

4)      Delay in ASHA Payments: In nearly all cases, the ASHA’s reported not receiving their incentives on time. In one village, the ASHA had still not received her payment of a delivery conducted in March 2011. In others, they had not received their incentive payment even 4-6 months after delivery. ASHAs reported having to  always keep aside some of her own personal household expenditure for arranging transport and other services.

5)      Payment Mechanism and Grievance Redressal Mechanism:

Once an ASHA facilitates a delivery, she takes the signature of the doctor and the ANM and submits her application for incentive, which is then forwarded to the Community Health Centre. The application is processed and then the money is sent directly to the ASHA’s account. Earlier the ANM used to pay the ASHA but now the ANM is completely bypassed. So if there is any grievance regarding money not reaching in time or not receiving the full amount, even an ANM does not know anything.  The ASHAs have to approach the Medical Officer of the PHC/CHC ( and in fact, it is the CHC) to get the the exact information.  The ASHAs we interacted with complained about the distances to the CHCs and having to go multiple times and reported getting very rude responses from these officers.

6)      Leakages and Corruption:

In some cases, it was found that ASHAs has taken money from the beneficiary. The impression we got was that mothers thought it as a legitimate payment while as per the guidelines, the mothers are not supposed to pay any amount to ASHAs. In another instance, it was also found that ASHA’s who were supposed to receive Rs.600 as their incentive, had to pay Rs. 100 to the Community Health Centre (CHC) officer. What exactly this means is not very clear.

School Management Committees (SMC’s) – The guardian institution for elementary education at the village-level

As an intern working with Accountability Initiative on PAISA project, I went on 4 days field visit to Chaksu block in Jaipur district, Rajasthan. The objective of the visit was to get an initial understanding of the School Management Committees (SMCs). This visit was the first step in the process documentation of SMC: their structure and membership and nature of decision-making process.

Chaksu block was chosen as it is the focus block for SMC intervention under the PAISA project. The intervention intends to strengthen the village level institution for community participation and greater control of the school management.

For the purpose of the process documentation, I held interviews and discussions at three different levels – at the block level with few block officials, at the nodal level with nodal HM’s and at the village level with members of the SMC. The key discussion points were related to RTE and SMC. The Right to Free and Compulsory Education Act (RTE), 2009 has mandated the constitution of a SMC. This is an example of decentralization to make the education system more effective and to encourage participation of parents in the decision process. There have been similar experiments involving SMCs/VECs (Village Education Committees) in countries like Kenya, India and Pakistan with limited success.

As per the RTE Act, the de-jure system for SMC is that it is constituted of a General body and an Executive Body. The General body consists of all the parents, teachers and every PRI member residing in the catchment area of the school. The Executive body is made up of 15 members elected from the General body, 11 of who are parents/guardians, Head Master of the school, 1 Gram Panchayat/Nagar Palika/ Ward member and 1 student. Of these 15 members, 50% should be women. In addition, the executive committee should also have representation by SC, ST, OBC and minority communitites. The tenure of the executive committee of the SMC is 2 years and should meet every month while the general body should meet once in 3 months. The head of the executive committee is the President and Vice-President elected from among the members and the Head Master of the concerned school is the Honorary Secretary. The RTE guideline mentions specific functions to be performed by the SMC like (i) monitor school activities and its working,
(ii) prepare and recommend school development plan, (iii) monitor grant utilization, (iv) monitor teachers’ and students’ attendance, (v) monitor MDM, (vi) ensure 100% enrollment of children in the age group of 6-14 years

De-facto, in the villages where I interacted with the SMC members, the SMCs were primarily formed without convening any general meeting. The HM of the school identified few parents to be the members of the executive committee. In all the three cases where discussions with SMC members were done, the President and Vice-President were consulted by the HM before selecting them for these posts. Most of the women members were not consulted, their names were written on the SMC register and signatures taken. In one case, it was found that the SMC register was sent to the houses of members to get their signatures. This was not in sync with the discussion with block level official and nodal HMs who said that prescribed rules were followed for SMC constitution. On the training front, the official message was that SMC specific training was conducted for nodal HMs at block level. However, in conversation with the nodal HMs, I figured that these trainings were very general and did not answer questions relating to process and the constraints faced. The nodal HMs, in turn, organized 2-3 days of training for the SMC members at the nodal level, where 3-4 SMC members from each school of the catchment area participated. At this meeting, the members were informed about their roles and responsibilities. Only one such training had been conducted and this was not sufficient to raise the awareness level of the SMC members. None of the women SMC members I talked to, had participated in the training. Lack of awareness and limited understanding of the roles and responsibilities of SMC are constraints in effective functioning of this institution. This is not a simple problem. Teachers feel that their work load has increased; they find it difficult to organize people for meeting. Members do not turn up for meetings; teachers have to go door to door to get members’ signatures. SMC members complain that meetings are not called. School Development Plans as envisioned by RTE have to be made by the SMC as per school needs but the last annual plan for the schools were made by teachers.

The initial phase of RTE implementation in Rajasthan is moving ahead but there is a gap between norms and practice. It will be interesting to see how SMCs evolve as the guardian institution for elementary education in the villages. Will they actively participate in school management leading to improvement in the elementary education or will they remain as token institutions for community participation? Will they evolve as another platform for politics similar to Panchayats or will they live up to expectations as envisioned in RTE Act? There is still a long time before answers to these questions start trickling in. In the meanwhile, it will be worth investing our time and effort in building the capacity of SMCs to enable them to deliver on their roles and responsibilities to make this a successful experiment.