The Process of Lawmaking in India

This post is an attempt to explain the process of law making in India. It also explains how citizen groups can participate in the process of lawmaking.

Who makes laws?

 In India, at the central level, laws are formulated by the Parliament and at the state level by Legislative Assemblies and Councils.

How is a law made?

The process of enacting a new law can be broadly divided into four steps:

Step 1: The need for a new law, or an amendment to an existing piece of legislation, is identified. This may be done either by the government or by citizen groups who can raise public awareness regarding the need for the law.

Step 2: The concerned ministry drafts a text of the proposed law, which is called a ‘Bill’. The Bill is circulated to other relevant ministries for inputs. Comments from the public on the proposed draft may also be invited. For example recently, the UIDAI has invited public feedback on the Draft National Identification Authority Bill. Following this, the draft is revised to incorporate such inputs and is then whetted by the Law Ministry. It is then presented to the Cabinet for approval.

Step 3: After the Cabinet approves the Bill, it is introduced in Parliament. Under the Indian political system, the Parliament is the central legislative (or law making) body. Every Bill goes through three Readings in both Houses before it becomes an Act.

  • During the First Reading the Bill is introduced in Parliament. The introduction of a Bill may be opposed and the matter may be put to a vote in the House. In August 2009, the Law Minister withdrew the motion to introduce the Judges (Disclosure of Assets and Liabilities) Bill as many MPs were opposed to the Bill, on grounds that it violated the Constitution.
  • After a Bill has been introduced, the Presiding Officer of the concerned House (Speaker in case of the Lok Sabha, Chairman in case of Rajya Sabha) may refer the Bill to the concerned Department Related Standing Committee for examination.
  • The Standing Committee considers the broad objectives and the specific clauses of the Bill referred to it and may invite public comments on a Bill. For example, the Standing Committee on Science and Technology, Environment and Forests has invited suggestions on the Civil Liability for Nuclear Damage Bill, 2010.
  • Bills which come under the ambit of a number of different ministries, may be referred to a Joint Comittee.
  • The Committee then submits its recommendations in the form of a report to Parliament.
  • In the Second Reading (Consideration), the Bill is scrutinized thoroughly. Each clause of the Bill is discussed on the floor of the House and may be accepted, amended or rejected.
  • During the Third Reading (Passing), the House votes on the redrafted Bill.
  • If the Bill is passed in one House, it is then sent to the other House, where it goes through  second and third readings.
  • During the second reading, the Government, or any MP, may introduce amendments to the Bill, some of which may be based on recommendations of the Standing Committee. However, the Government is not bound to accept the Committee’s recommendations.

Step 4: After both Houses of Parliament pass a Bill, it is presented to the President for assent. She has the right to seek information and clarification about the Bill, and may return it to Parliament for reconsideration. (This may be done only once. If both Houses pass the Bill again, the President has to assent.)

Step 5: After the President gives assent, the Bill is notified as an Act. Subsequently, the Bill is brought into force and rules and regulations to implement the Act are framed by the concerned ministry, and tabled in Parliament.

Do bills get passed even without any discussion in the parliament*?

Parliament passes about 60 Bills every year. It devotes 20-25% of its time on legislative business. The time spent on debating each Bill varies widely.

  • In total, the Lok Sabha passed 30 non-financial Bills in 2009.
  • In 2009, 8 Bills were passed in less than 5 minutes (27% of the Bills passed by Lok Sabha in 2009). These included, The Legal Metrology Bill, The Commercial Division of High Courts Bill, and the Trade Marks Amendment Bill.
  • Only 5 Bills were debated for more than 3 hours.
  • In 2008, 16 out of 36 Bills (excluding finance and appropriation bills) were passed by Lok Sabha in less than 20 minutes, most of these without any debate.
  • In 2008, Lok sabha worked for 46 days, the lowest ever in a calendar year.
  • Things are worse, for Legislative Assemblies. Delhi assembly worked for 20 days in 2007.

Number of Working Days in Legislative Assembly

Year 2006 2007
Delhi 23 20
Mizoram 19 18
Rajasthan 30 25
Chhattisgarh 41 35
Madhya Pradesh 43 29
Kerala 51 56
Karnataka 56 34

* Source: PRS Legislative Research

Sruti Bandyopadhyay is a Research Analyst with the Accountability Initiative.

M.P. Public Services Guarantee Bill – A Path-breaking Law

It has been recognised the world over that good governance is essential for sustainable development, both economic and social. The three essential aspects emphasised in good governance are transparency, accountability and responsiveness of the administration.  Citizens’ Charters are an effort to address these issues by focusing on solving the problems which citizens encounter while dealing with the organisations providing public services.

The concept of a Citizens’ Charters was first articulated and implemented in the UK in 1991 as a national programme with a simple aim: to continuously improve the quality of public services for the people of the country so that these services respond to the needs and wishes of the users.  The basic objective of a Citizens’ Charter is to strengthen the relationship between citizens and service providers. In India, the decision to formulate Citizens Charters was taken at the Conference of Chief Ministers held on 24 May, 1997 in New Delhi. At the conference an “Action Plan for Effective and Responsive Government” at the Centre and State levels was adopted and it was decided that Central and State Governments would formulate Citizens’ Charters, starting with those sectors that have a large public interface. These Charters were required to include standards of service, reasonable time limits for service delivery, avenues of grievance redress and a provision for independent scrutiny with the involvement of citizen and consumer groups. However, while the concept of Citizen’s Charters has been quite popular, in practice, they have failed to improve the relationship between frontline users and service providers. In this scenario, the Madhya Pradesh Public Services Guarantee Bill 2010 comes as the first-of-its-kind law in the country guaranteeing the delivery of public services to common people in a stipulated time frame.

The Shivraj Singh Government has described the Bill as “historic” and a reflection of the state’s commitment to achieving good governance. The Madhya Pradesh Public Services Guarantee Bill 2010 guarantees the delivery of basic public services to citizens within a stipulated time frame and sets in place accountability mechanisms for non-delivery of services.  Under the Bill, key public services like issuing caste, birth, marriage and domicile certificates, drinking water connections, ration cards, copies of land records will be notified. A time period will be fixed for the delivery of each service. If officials fail to perform their duties and provide these services on time, they will have to pay a fine starting from Rs. 250 per day to a maximum of Rs. 5000. This will check delays in the provisioning of services and remove inordinate pendency. The Bill provides for a two stage appeals process: In the event that citizens do not receive notified services in time, they can make an appeal to the first appellate authority. If the first appellate authority is negligent or if citizens are dissatisfied with the ruling, they can file an appeal with the second appellate authority, which can direct the subordinate authorities to deliver services. The second appellate authority also has the power to impose fines and order disciplinary action against officials. The new legislation also stipulates the number of days a particular file related to the delivery of a service can be kept with the officer concerned. The fine received from delinquent officers will go to the applicants to compensate them for the inconvenience caused to them. It is envisaged that the offices of the Chief Minister and other Ministers will also be brought under the purview of the law in the future.

The path-breaking law seeks to operationalise the system of Citizen Charters that have been in place for some time but have been quite ineffective. While previous governments in Madhya Pradesh have implemented the citizen charter arrangement, their efforts have largely been ineffective. This can be attributed to the parochial set-up of the bureaucracy, the absence of a consultative process in the formulation of the Citizens Charter and the lack of training and capacity building of officers and service seekers about the Charter and its potential.

The new law provides an effective instrument for realizing the concept of citizen’s charter while ensuring services to people in an assured manner. It will also prove an effective check on corruption.

Mr Awanish Somkuwar is the Assistant Director, Communications, Government of Madhya Pradesh.

Access to Information and Accountability: The Story of Vijaipura Panchayat

Unlike its predecessor the Sampooran Grameen Rozgar Yojna (SGRY), the National Rural Employment Guarantee  Act (NREGA), 2005 outlines an impressive list of transparency and accountability mechanisms to ensure that administrators are answerable and responsible to people for their behaviour and actions. Such measures include the institution of grievance redressal mechanisms, proactive disclosure of information, and community monitoring mechanisms such as Social Audits.  In June this year a team of us visited Vijaipura Panchayat in Rajasthan to understand the extent to which these measures were being implemented.

Vijaipura is a seemingly innocuous Panchayat set in a dusty drought ridden landscape, with little to boast apart from a view of the petering Aravalis. The fecundity of the land being all but despoiled has little to offer to its four thousand odd residents who survive largely as subsistence farmers or livestock rears. In such a hostile environ, NREGA emerges as the sole guy, railing in the several desperate souls from experiencing another more trenchant aspect of poverty.

The distinguishing feature of Vijaipura is the long standing relationship that the people of the region share with the Mazdoor Kisan Shaki Sangathan (MKSS). Since the 1980’s residents of Vijaipura have supported and been part of the movement’s activities. In recent history with the launching of the NREGA in 2008[1], the movement has played a critical role in spreading awareness on the rights and entitlements guaranteed in the Act.

Given the important role played by the MKSS, it was assumed that at least in Vijaipura, workers would be suitably empowered to demand accountability, if their rights were violated. Contrary to such assumptions our findings from interviews with workers and officials revealed that even in Vijaipura, significantly higher awareness levels of workers did not translate into greater exercise of voice. As per the official records only two formal complaints have been registered in Vijaipura. Out of these, one complaint relating to delays in payment of wages turned out to be bogus. Other complaints were informally registered, mostly orally. Surprisingly, 88.8% of the complaints were not formally registered with the recipient authorities. In only 44% of the cases complainants were given assurances that their complaints would be resolved within the designated period.  In 55% of the cases the respondents claimed that the complaints had not been investigated. Further, only 60% of respondents asserted that their complaint had resulted in a satisfactory outcome. However even in their case, the formal complaint was as such not properly investigated, it was only after pressure was applied that the officials finally acceded to the demands of the labourers[2].

According to our preliminary analysis, it appears that reasons for low rates of complaints in Vijaipura are attributable to the nature of the systems of grievance redressal. Such a system obliged individuals to take action in legally literate ways (Goetz and Gaventa 2001: 13). Workers who were illiterate or were unaware of the procedures involved in lodging complaints were unable to access such a system. To a certain extent then, learnings from the experiences of Vijaipura prompt an assessment of the ways in which accountability and transparency measures are designed, under the Act as well as more generally in other government programmes, and whether they are structurally defined to be participatory.

 Gayatri Sahgal is a Research Analyst with the Accountability Initiative.


[1] NREGA was instituted in Vijaipura during the second phase in 2008.


[2] These findings are based on a quantitative survey conducted with a sample size of nine respondents. The sample size was partly based on official records and partly on the basis of snow balling technique through which other complainants were identified.

Exploring the Links Between Mother’s Literacy and Child Achievement

It is a well known fact that children of more educated parents are likely to perform better in school. It is also well known that the amount of time parents dedicate to their children, either playing with them or helping them with their homework, also influences and shapes a child’s cognitive ability. Over and above this, theory also suggests that parents investment and consumption choices, the home environment, presence or absence of positive role models etc also plays an important role. I recently had the opportunity to field test some of these theoretical assumptions about the linkages between parents education and child achievement in a village in Ajmer, Rajasthan.

Located quite close to the Ajmer city centre, Ghughra is a medium sized village in Rajasthan where most residents derive their livelihoods from agriculture or rearing livestock. Many women in the village particularly those from the Gujjar community are employed on the NREGA worksites. Talking to mothers and fathers in the village, I got a unique insight into the different factors that can influence a child’s learning ability in a scenario where parents face different kinds of social and economic constraints.

  • Parents perception of education: Most of the parents I spoke to had enrolled their children in school – some in government schools and others in private schools. However, the dropout rate amongst girls in the village was quite high particularly amongst adolescent girls. On probing this issue further it came to light that the continued practice of child marriage in the community has had a major impact on how long girls stay in school. Most girls are married in their infancy and then sent to their marital home when they reach puberty around 14-15. This practice seems to work as a disincentive for parents to invest in their daughter’s education. When we spoke to women about the need for educating girls further, many expressed the fear that education would lead their daughters to marry outside the community.
  • Mother’s Literacy: There appeared to be a very clear link between mother’s literacy levels and the amount of time spent with the child on the child’s learning levels. Children who scored well on the reading tests I administered usually had at least one parent taking a keen interest in their studies and spending time with them after school. In most cases it was the mother. Within the Gujjar households, literacy levels amongst mothers and fathers were quite low. Most mothers were illiterate with little to no formal schooling. This seems to have a considerable impact on the degree of interaction that mothers had with their children when it came to education.
  • The mothers I spoke to expressed a lack of confidence when it came to supervising their children’s school work. However, when it came to playing number games, many mothers were able to rattle off the solutions to maths sums  quite easily. This raises interesting questions about what we understand by ‘adult literacy’.

So what did I learn?  First, it seems quite clear that over and above the formal education system, the amount of time and interest parents take in their children and their education has a positive impact on their learning ability.  This is the case even where both parents were illiterate and children were first time learners in the family. So time spent with children matters irrespective of whether parents are educated or not. Secondly, a creating a desire for education amongst parents and children is important – parents need to recognise the value of investing in their child’s education. Thirdly, adult literacy is important – parents with even a few years of schooling are better placed to monitor and supervise their children than those with little to no formal education. Fourth,  building the confidence of children and parents is important particularly in households where the child is a first time learner. Here creativity is key – encouraging parents to tell stories to their children, play games with them etc can be a fun way to make learning an interactive activity for parents and children.

Mandakini Devasher Surie is a Research Analyst with the Accountability Initiative.
Who are the Poor in India?

Over the years various indices and poverty measures have been developed to try and estimate the number of people living below the poverty line. The latest in this long line of poverty measures is the Multi-Dimensional Poverty Index (MPI). Developed by the Oxford Poverty and Human Development Initiative (OPHI) UNDP, the MPI aims to provide a more detailed assessment of poverty at the individual level. In India, the MPI estimates that 55% of the country’s population is poor. But as experience has shown, measuring and defining poverty is a complex task anywhere, more so in India where large sections country’s 1.2 billion population are unaccounted or misrepresented in official data.  A closer look at the great Indian poverty debate gives us a good idea of just how complicated things really are.

The Indian Government defines poverty with the help of a BPL survey that it conducts from time to time (three have been conducted so far, in 1992, 1997 and 2002). The last survey defined the percentage of the BPL population at 27.5%.  On the recommendations of the Suresh Tendulkar Committee however, the figure was recently changed to 37.2%. However, there has been some debate within policy circles about the accuracy of the BPL survey estimates.  According to noted economist, Jean Dreze, the government’s identification system is “divisive and open to manipulation”. On the flipside, Manjula Krishnan, Chief Economic Advisor, Ministry for Rural Development the government is “still crystallizing [it’s] ideas on how to identify poor households.”

The BPL Census employs a scoring scheme where households are judged based on 13 indicators and then eliminated by how high they score. The indicators cover characteristics of households ranging from ownership of items (pressure cookers, motor transport) to features of their house (concrete foundations and covered bathrooms). Many economists and policymakers find these exclusion criteria to be arbitrary and unfair and are pushing to reform them before the 2011 BPL census. To give a sense of the unfair picture these indicators might paint consider the following: a fourth of the BPL population owns a two-wheeler, a third own a color TV, and two-thirds own a pressure-cooker. A casual observer might wonder whether a household with ownership of these items deserves to be classified as “poor” (a recent Financial Express headline, less thoughtfully, proclaimed that the statistics indicate sections of the BPL population “live it up”). When dealing with this data, it’s important to remember the nuances of poverty and the different forms it might take: should a family with a TV and concrete foundation in their home, but no access to healthcare or running water be excluded from the BPL population? In past surveys, families with a ceiling fan, flush toilet, or more than ten articles of clothing were excluded from the BPL population. On the flip-side, according to N.N. Paul, a spokesman for the Planning Commission, well off families often use their political connections to get classified as poor and use government welfare schemes to for free perks. And while the BPL census is focused heavily on rural India, the rapidly expanding numbers of urban poor need to be accounted for as well.

The real problem with defining the BPL population in India however is not the metrics but the politics surrounding the delivery of welfare schemes. The government, it seems, can only afford to classify as poor the numbers it can afford to pay for in welfare schemes. The indicators used to determine poverty in India have so far been limited to food, fuel and clothing- something the Planning Commission has now changed to include education and healthcare, resulting in BPL numbers surging to over 400 million. This means that tens of millions will suddenly be added to the welfare rolls, and the PDS needs to be geared to accommodate them. Knee-jerk spending on welfare schemes can be explained by the obvious political dividends: the poor are a powerful voting block and the rapid approval of welfare schemes often overlooks functional service delivery. Spending on social services and development has increased 10.5%- 20% during 5 years of the Congress party in power. B.K. Sinha, an official in the Ministry for Rural Development, stresses that ration cards will continue to remain scarce despite the increased poverty numbers as long as they remain the sole ticket to the basket of welfare services and in the grip of arbitrary state control. States currently have a ‘poverty quota’ which only allows for new cards to be issued when old cards are canceled. To ensure that the BPL population is appropriately defined and therefore eligible for welfare schemes, it is imperative that the Planning Commission reassesses the methodology used to classify this population ahead of the next BPL Census slated for April 2011.

Concrete positive steps are thankfully underway. The Government’s decision to revamp the Rashtriya Swasthiya Bima Yojana by absorbing large sections of the unorganized workforce such as above poverty line NREGA workers, street vendors, taxi and rickshaw drivers into the scheme where they receive the same health benefits as BPL households reveals a more nuanced understanding of where welfare schemes need to be diverted. The India Protection Index developed by the NCAER uses 78 indicators on the basis of availability and strength in a manner where they are dynamically engaged with one another and contextualized. This index provides a more accurate mirror of both financial and social wellbeing of Indian families and is unique in that it seeks to quantify psychological factors. In doing so, it becomes one of the strongest efforts to measure poverty in India as more than a number, and instead a state of life—and consequentially welfare as a process toward happiness and national wellbeing.

Last but not least there is need for greater transparency in the process of enumerating and counting India’s poor. With various poverty estimates and statistics doing the rounds and crores of rupees in welfare benefits at stake, it is imperative that there is some answerability and accountability from the government on how estimates are arrived.

Click here to view a video from the Wall Street Journal on measuring poverty in India.

Rishiv Khattar was working as an intern with the Accountability Initiative.

India and the Failed States Index: 12 Counts of Failure

Foreign Policy and the Fund for Peace have been publishing the Failed States Index since 2005. The 2010 Index uses 90,000 publicly available sources to assess 177 countries and rate them on 12 metrics of state decay—India ranked 87 and received a score of 77.8.

Higher scores on a metric indicate a greater degree of failure. The scores used are from the Fund for Peace publication as there appears to be some inconsistency in the Foreign Policy publication’s score.

No. Metric India’s score
1 Mounting demographic pressures 8.3
2 Massive movement of refugees or internally displaced persons, creating complex humanitarian emergencies 4.9
3 Legacy of vengeance-seeking group grievance or group paranoia 7.3
4 Chronic and sustained human flight 6.7
5 Uneven economic development across group lines 8.9
6 Sharp and/ or severe economic decline 5.0
7 Criminalization and/ or delegitimization of the State 5.5
8 Progressive deterioration of public services 7.0
9 Suspension or arbitrary application of the rule of law and widespread violation of human rights 6.0
10 Security apparatus operates as a “State within a State” 7.1
11 Rise of factionalized elites 6.0
12 Intervention of other states or external political actors 5.1


Total 77.8

While the most recent analysis of the scores is not yet available, past assessments by the organizations and recent news are useful in deciphering the factors that may have contributed to these scores.

1) The score on the demographic pressure metric is due to high population density relative to food supply and other essential resources in the country, and pressures from skewed population growth that have led to a “youth bulge”.

2) India does not have a major refugee or IDP problem but does have a manageable influx of refugees from Tibet, Afghanistan and Sri Lanka.

3) Group grievance scores are high primarily in Kashmir, as a result of the rise of militant groups, communal violence, and tensions between India and Pakistan. An increasingly violent Maoist insurgency and the rise of Naxalism have also exacerbated grievances.

4) Human flight indicators remain high for India as a significant percentage of the country’s educated population leave to study or find jobs elsewhere.

(5) and (6) The Indian economy has rapidly developed and established itself as the world’s second-fastest growing economy. India’s recently updated foreign direct investment policy (2005) has helped further open markets. And India’s significant economic growth (GDP increased by 6.8 % in 2009 despite a global recession) has been inequitable, as a large section of the population lives in poverty.

7) Politicians running campaigns and being elected to office while on trial for criminal charges have undermined state legitimacy. While Indian law prohibits convicted criminals from holding office, nothing prevents them from doing so until they have been convicted. Apart from the growth of crime syndicates linked to government officials, there is endemic corruption and widespread resistance to accountability and transparency—something the recently passed Right to Information Act may improve.

The FfP’s most recent assessment of India’s core state institutions:


8) The quality of public services is severely lacking, especially in rural areas. Nonetheless, government efforts to improve health and education services (such as through the NRHM) have contributed to an improving score on this metric. Significant efforts this year—the Right to Food Act and the Right to Education—may further help.

9) India has a decent human rights record, having recently made concrete steps toward expanding the rights of women and LGBT populations. However, the state is sometimes accused of preventing human rights organizations from entering Kashmir.

10) The rise of militant groups as well as the power wielded by Kangaroo courts and unofficial governing bodies in rural areas impact performance on this metric. Populations often turn to these bodies to address their grievances due to social custom or a lack of confidence in elected officials.

11) Communal, caste and regional tensions are sometimes reflected in government which has led to the factionalization of elites, but this is often mitigated by India’s functioning democracy.


The quality of public services is a metric that India consistently performs poorly on. Whereas demographic pressures fluctuate with factors like natural disasters that lead to a massive loss of life, the progressive deterioration of public services can perhaps more effectively be tackled through systemic reforms and improved accountability. It’s important to note that India’s score of 7.0 on this metric puts it behind countries like Ghana, Kazakhstan, Namibia that it is more developed than in other categories.

The writer is an intern at the Accountability Initiative.


From Outlays to Outcomes- Getting Development from Development Expenditures

In August 2009, AI and the Centre for Development Finance, Institute for Financial Management and Research organised a conference entitled “From Outlays to Outcomes – Getting Development from Development Expenditures” in New Delhi. The papers presented at the conference have been featured in a special issue of India Review (Volume 9 Issue 2 2010). These include a section of guest editor papers, a number of papers discussing accountability in public expenditures in India, and a review essay on decentralization, institutions and accountability.

Health Care Spending Rising Faster Than Economic Growth In Industrialized Countries – OECD Health Data 2010

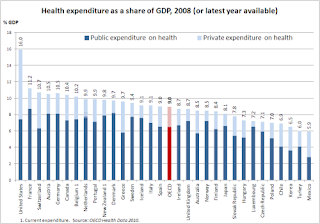
While India is still struggling to live up to the “Nine is Mine” dream (calling for 9% of GDP to be committed to health and education), according to OECD’s Health Data 2010, in leading industrialized countries, the health care spending is rising faster than economic growth. The study reports:

  • Average health spending in the 31 member OECD counties has increased from 7.8 percent of GDP in 2000 to 9.0 percent in 2008 –averaging around 8.4% of the GDP.
  • During the same period, health spending per person increased by 4.2% a year on average.
  • Governments of most OECD countries shoulder most of the burden of healthcare costs. Public expenditure has increased from an average of 12% of total government spending in 1990 to a record 16% in 2008.
  • United States tops the list, spending 7,538 dollars per person on health care in 2008, more than double the average 3,000 dollars for all OECD countries.