Putting the Test to Test: An Analysis of NCERT’s National Assessment Survey

The much awaited results of the 2012 National Achievement Survey (NAS) of Class III and Class VIII students are finally publicly available.[1]  The third round of the survey, conducted as part of Sarva Shiksha Abhiyan (SSA) by the National Council of Educational Research and Training (NCERT) is deemed to be one of the government’s most comprehensive educational assessments. The survey collects information about the achievement levels of students in reading, mathematics, science and social science across a sample of government and government-aided elementary schools.

How do the NAS results differ from those of the Annual Status of Education Report (ASER) [2]? The answer is – they aren’t comparable – so let’s not even get into that debate. The methodology and the objective of each study is different. While ASER is meant to be a dipstick analysis of basic competencies in reading and mathematics across rural India, conducted by community volunteers, in the child’s home; the NAS is a school-based, grade specific, country-wide assessment (covering both rural and urban) but limited to government and government aided schools. In fact, NAS was envisioned to officially monitor learning achievements under SSA in mathematics, science, language and social science.  Not surprisingly, the results of the two surveys are not comparable. (For details on the different methodologies see here[3])

To give the reader an overview of   the NAS methodology – The Class VIII survey was conducted between March-May 2012 for summer closing schools and November-December 2012 for winter closing schools. The survey used tests and questionnaires to gather information from 188,647 students in 6,722 schools across 33 states and union territories (UTs). In addition, questionnaires were used to collect information on schools, teachers, and pupils’ school experiences and home backgrounds.  There is a three stage sampling process. First, districts were selected based on the number of Class VIII students enrolled. Second, the requisite number of schools was selected. In most states, the sample size was around 250-300 schools. Finally, around 5000 Class VIII students were selected at random for each subject and tested.

This time, NAS has used Item Response Theory (IRT) [4] as the basis for analysing test results, as well as, reporting on outcomes. The IRT is an international standard for assessment surveys that; a) uses mathematical models to assume a statistical  connection between the difficulty level of the test item,  the ability of the student,  and the probability of that student being successful at a particular item , and b) allows for results to be compared between groups and over time. To elaborate – scores are placed on a scale from 0-500, which is normalised with a median of 250. This was later updated based on the results.  The results can thus be used to make comparisons between states as well as across time. To give an example – if State A’s  score in science increases from 260 to 270 between 2012 and 2015 whilst State B’s decreases from 270 to 250 during the same time, direct comparisons can be made even if the scores have been derived from different students, taking different tests at different times as the reporting scales are fixed.

Class VIII Achievement Results:
Reading                                                              Mathematics                                      Science
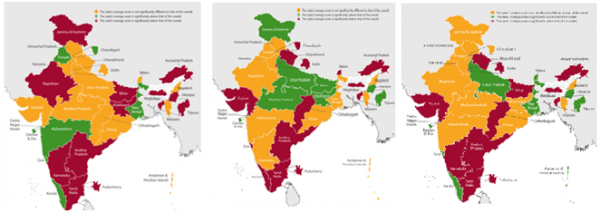
Legend:

Yellow: The states score is not significantly different to the overall score
Green: States average score is significantly above the overall
Red: States average score is significantly below the overall.

Below are some of the main findings from the NAS.

  • First and foremost, despite different methodologies – the NAS confirms the findings of ASER and other studies as it also identifies learning as a big challenge facing Indian education.
  • Unsurprisingly, there is significant variation both across states and subjects but also diversity in achievement between the highest and lowest performing students within the states. (See map above) It is important to highlight, that for reading comprehension the national average was 247, for mathematics (245) and 251 for science out of a possible 500.
  • Similarly, there are differences in terms of equity. Students who come from Scheduled Castes, Scheduled Tribes or Other Backward Classes tend to perform worse than students from the General category.
  • The study also dispels the science and maths gender myth as it finds   – nationally, there is no significant difference between boys and girls in achievement levels in maths, science and social science. In fact, girls outperformed boys in reading comprehension.  Some of the main exceptions to this were Kerala (where girls outperformed boys in the first three subjects); West Bengal (girls performed worse than boys in these subjects) and Bihar  (where girls performed worse than boys in reading)
  • There are differences in rural vs. urban: In science and mathematics, rural students out-performed urban students, in social science they fared equally. Only   in reading comprehension do urban students do better than rural students
  • Private tuitions also seem to be on the rise. In West Bengal, as high as 77% of students were taking private tuitions. (See Table 1)

Table 1

 States Proportion taking private tuitions (NAS 2012)
Chhattisgarh 8
Rajasthan 14
Punjab 16
Himachal Pradesh 20
Tamil Nadu 22
Uttar Pradesh 22
Haryana 23
Maharashtra 29
Gujarat 32
Kerala 36
Jharkhand 49
Odisha 56
West Bengal 77
India Average 35

NAS also seeks to understand the factors that impact learning. As mentioned earlier, the survey asked questions regarding household background and other school related factors and governance issues. Key findings are highlighted below:

Household related factors

  • Students with only one sibling outperform by a small but statistically significant amount those that who have two or more brothers.
  • Medium of instruction makes a difference
  • Higher the parents education, greater the probability of the student doing well.

School related factors

  • Co-educational schools do better than single sex schools.
  • Schools with pucca buildings tend to do better.
  • Government aided schools have lower performance, even when the key factors such as socio-economic status of parents, location etc. are taken into account.
  • Of the different entitlements, scholarships seem to have the highest impact.

Teachers and Teaching Related factors

  • Students who had their homework checked by their teacher every day tend to do better.
  • Students that reported group work with other students in solving mathematical problems perform significantly better in maths.

School leadership and governance seems to play a key role in achievement

  • Students of schools where head masters also teach, tend to do better.
  • Learning achievement  of the schools which are inspected more is better and finally,
  • Having VEC/AEC/SMC committees is associated with better performance.

Going Forward

So what does this mean in terms of going forward? Let’s start with the positives. As the report itself says, “NAS is an education health check that helps to establish the spread of what students know and can do at specific stages of education cycle[5]. Further, by assessing students in Class VIII and given that RTE norms ascertain that no child shall be held back in elementary school, it throws some light into the level of preparedness of students entering secondary schools. Further, the questionnaires on factors affecting learning can help teachers as well as policy-makers identify areas of concern and rectify them.

Going forward, I think it will be important move beyond debates of which method (ASER vs. NAS) is a better method of measuring learning outcomes. Instead, we should recognise that each assessment increases our understanding of the status as well as the context in which students learn. In fact, when several complementary studies[6] point to the same direction, it only makes the case stronger. This fact is recognised even by the 12th Five Year plan, which focussed on the need to focus now also on learning outcomes.[7]

There are however a few things that NAS needs to consider going forward. First, is a question of timing. One of the biggest advantages of ASER is the quick turnaround rate between conduction of the survey and survey results. As a result, ASER is able to create a regular, timely [8] update of the status of affairs in elementary education, thus giving evidence upon which policy changes could potentially be made. The survey conducted in 2012, is finally available on the website in 2014. Even after this 2 year lag, only the state report cards are publicly available. The complete data is yet to be made publicly accessible.

Second, is a question of data quality. Call me a sceptic, but I was slightly surprised with the results of Uttar Pradesh outperforming most other states including some of the south indian states in maths, science and social science. In fact, according to Class V results report by NAS, the “NCERT team reflected that there was no monitoring done from their end while the survey was being conducted and they relied too heavily on the state and district coordinators to carry out the monitoring tasks” [9].

Having a strong monitoring mechanism and robust data checks could alleviate some of the concerns regarding data quality. Details of this information should further be made publicly available. In fact, even DISE despite its large coverage has a 5 percent data rechecking in place.[10]

Third, recent years have seen a mushrooming of private schools across India and increasing enrolment in these private schools [11]. Often these schools remain out of the radar to the point that we do not even have an idea about their numbers let alone the quality of education in them. While the NAS currently only looks at government and government aided schools, going forward, it is important and necessary to also find a way of assessing private schools.

Finally, let’s make the data more user-friendly so that researchers like us and even policy makers can use it easily!

(p.s. – a word of advice for those who want to access the reports – use Internet Explorer as it doesn’t work properly on Chrome)


[1] The NAS had previously released the Class V survey conducted between 2010-11 in 2012. The latest NAS was officially released in February 2014, however data was not publicly available.

[2] More details on ASER are available at: http://www.asercentre.org/

[3] The document describes the differences between ASER and the NAS report for Class V, Cycle 3, 2010-2011 released in 2012.

[5] NCERT (2012), NAS Class VII Summary Report. Available online: http://mhrd.gov.in/sites/upload_files/mhrd/files/11%20March%20National%20Summary%20Report%20NAS%20Class%20VIII.pdf

[6] ASER, Educational Initiatives etc

[7] http://planningcommission.gov.in/plans/planrel/12thplan/pdf/12fyp_vol3.pdf

[8] ASER reports are released in January which is when the SSA’s planning cycle is underway.

[9] http://www.ssatcfund.org/LinkClick.aspx?fileticket=TEJBnXMcOiQ%3D&tabid=2508

[10] Despite this, DISE themselves have been struggling with making DISE data even more rigorous.

[11] DISE State Report Cards, ASER (2012), ASER (2013)

Structure of Elementary Education in Rajasthan

राजस्थान में प्रारम्भिक शिक्षा का ढांचा

किसी भी देष या समाज के विकास के लिए शिक्षा मूल आधार हैं। राजस्थान राज्य के निर्माण के बाद राज्य में शैक्षणिक विकास एवं शिक्षा में समानता लाने के लिए एक संरचनात्मक प्रषासनिक ढांचा निर्मित किया गया। जिसका मुख्य उद्वेष्य प्राथमिक शिक्षा का सार्वजनिकरण करके, बिना जाति, लिंग एवं धर्म के भेदभाव के आधार पर सभी कों शिक्षा के समान अवसर उपलब्ध करवाना, प्राथमिक एवं माध्यमिक शिक्षा में गुणात्मक उन्नयन, राष्टंीय शिक्षा नीति एवं राज्य द्वारा घोषित शिक्षा नीति एवं योजनाओं का क्रियान्वयन आदि है। राज्य के विभिन्न जिलों एवं क्षैत्रों में शैक्षणिक स्तर में काफी भिन्नताएं है।

शिक्षा विभाग

वर्ष 1950 में राज्य शिक्षा विभाग के तहत बीकानेर में प्राथमिक एवं माध्यमिक शिक्षा निदेषालय स्थापना की गई। शिक्षा में गुणवत्ता सुधार हेतू वर्ष 1997 में प्राथमिक शिक्षा एवं माध्यमिक शिक्षा के अलग-अलग निदेषालय स्थापित किए गए। राज्य स्तर पर शैक्षणिक ढांचे के अन्तर्गत मुख्य रूप से दो खण्ड है!

1.सचिवालय स्तर: सचिवालय स्तर पर शिक्षा मंत्री के अधीन प्रषासनिक एवं वित्तीय कार्यो के निर्वहन हेतू सचिव, स्कूल एवं संस्कृत शिक्षा होता है, जो इन कार्यो का निर्वहन विषिष्ठ शासन सचिव/उप सचिव, लेखाधिकारी एवं अनुभाग अधिकारी आदि के माध्यम से करता है। 

2. निदेषालय स्तर:- राज्य में स्कूली शिक्षा के निरीक्षण एवं अन्य कार्यो के निर्वहन हेतू सचिव, स्कूल एवं संस्कृत शिक्षा के अधीन प्राथमिक शिक्षा एवं माध्यमिक शिक्षा हेतू अलग-अलग निदेषालय है। दोनों निदेषालयों के अलग-अलग विभागाध्यक्ष निदेषक, प्रारम्भिक शिक्षा एवं निदेष, माध्यमिक शिक्षा है। राज्य में प्रारम्भिक एवं माध्यमिक निदेषालयों के अन्तर्गत क्रमषः प्रारम्भिक एवं माध्यमिक शिक्षा तथा निजी क्षैत्र में संचालित शिक्षा के निरीक्षण एवं प्रषासनिक कार्यो का निर्वहन होता है।

3. संभागीय स्तर:- राज्य में शिक्षा का प्रषासन 7 संभागों यथा- जयपुर, जोधपुर, उदयपुर, भरतपुर, कोटा, एवं चुरू मण्डल में विभक्त है। संभागीय स्तर पर प्रारम्भिक एवं माध्यमिक शिक्षा के लिए अलग-अलग उपनिदेषक होते है।

4. जिला स्तर:- जिला स्तर पर स्कूली शिक्षा से संबधित कार्यो का आयोजन, क्रियान्वयन एवं प्रबन्धन, जिला शिक्षा अधिकारियों के द्वारा किया जाता है! प्रत्येक जिले में प्रारम्भिक एवं माध्यमिक शिक्षा हेतू अलग-अलग जिला शिक्षा अधिकारी होते हैं।

5. प्रखण्ड स्तर:- उपखण्ड या पंचायत समिति में प्राथमिक एवं उच्च प्राथमिक विधायलयों के प्रबन्धन, शैक्षणिक गतिविधियों के क्रियान्वयन एवं प्रभावी नियत्रंण हेतू प्रखण्ड स्तर पर प्रखण्ड प्रारम्भिक शिक्षा अधिकारी होता है।

सर्व शिक्षा अभियान

राज्य में प्रारम्भिक शिक्षा के कार्यो को क्रियान्वित करने के लिए सर्व शिक्षा अभियान का एक संगठनात्मक ढांचा तैयार किया गया है। इसमें जस्थान प्रारम्भिक शिक्षा परिषद का गठन एक स्वाययतषाषी निकय के रूप में राजस्थान सहकारी समिति अधिनियम, 1958 के तहत किया गया। जब वर्ष 2000-01 में सर्व शिक्षा भियान कार्यक्रम की शुरूआत हुई तो इससे संबधित सभी कार्यों को राजस्थान प्रारम्भिक शिक्षा परिषद को सोप दिये गये। राज्य स्तर पर परियोजना के कार्यों के प्रभावी क्रियान्वयन एवं नीतिगत निर्णय हेतू कार्यकारी परिषद एवं राजकीय परिषद होती हैं। सर्व शिक्षा अभियान एक केन्द्रीय प्रवर्तित योजना है, जिसका क्रियान्वयन राज्य में एक पंजीकृत समिति द्वारा किया जाता है। केन्द्र सरकार द्वारा इस अभियान की राषि राज्य सरकारों को नही देकर सीधे इस परिषद को दी जाती है।

प्रारम्भिक शिक्षा पंचायतों के अधीन

2 अक्टूबर 2011 में राज्य सरकार ने जिला स्तर पर पांच महत्वपूर्ण विभागों को पूर्ण रूप से पंचायतों के हवाले करने का निर्णय किया। इस निर्णय से जिला तथा प्रखण्ड स्तर पर प्रारम्भिक शिक्षा से जुडे अधिकारी/कर्मचारी/षिक्षक क्रमषः जिला परिषद तथा पंचायत समिति के अधीन आ गये है। जबकि ग्राम स्तर पर षिक्षकों की उपस्थिति, मध्यान्ह भोजन, छात्र-छात्राओं की उपस्थिति, शाला परिसर के विकास तथा विधालय में पानी की व्यवस्था आदि गतिविधियां ग्राम पंचायतों के जिम्में कर दी गई है। शालाओं का निरीक्षण, निःषुल्क पाठ्य-पुस्तकों का विवरण, छात्र-छात्राओं के बैठने की व्यवस्था, अध्यापक समानीकरण आदि पंचायत समितियों तथा शाला भवनों का रखरखाव, अध्यापको की भर्ती तथा अनुषासनात्मक कार्यवाही जिला परिषदों के जिम्मे कर दी गई है। इससे प्रारम्भिक शिक्षा में पंचायतीराज की भूमिका भी महत्वपूर्ण हो गयी है।


Pedagogy to train SMC members needs to be Critical Pedagogy

Community based organizations such as School Management Committees (SMCs) have a significant role in functioning of schools. The recently introduced RTE Act has made the formation of SMCs mandatory. SMCs, if empowered with proper training based on critical pedagogy, can really play a greater role in school governance.

Background

India has one of the largest numbers of schools (1.3 million schools[1]) in the world. Since 2000 – 2001, ever since the Sarva Siksha Abhiyan (SSA)[2] has been operational, the education system in the country grew both in terms of institutions (school buildings) as well as in enrolment[3]. There is a shift in focus of the education system towards a system of mass education (compulsory education for all). This shift also shows how the education system, after RTE Act, in the country demands greater capability (teacher’s capacity, improved pedagogy, better TLM and school infrastructures) at the school level to respond to the emerging need of quality education for a diverse student population.

Enrolment in schools has increased tremendously. But retention is now a great challenge. Quality education (improving learning outcome) is an issue that needs to be tackled strategically[4]. Even though huge amount of funds are being spent by SSA on improving the school infrastructure[5] – according to a one survey reported for NDTV news[6], it was recorded that the main facilities and infrastructure were mostly unavailable or in a very poor state. Schools with unusable toilets were found in more than a third of the schools surveyed.

The conditions on the ground do not reflect the amount of funding allocated to build schools’ capacity Funds for improving school infrastructure like the School Maintenance Grant and School Development Grant,  as well as funds for Teaching Learning Materials (TLM) are now coming regularly to schools. As per the PAISA report 2012, there have been some improvements in the percentage of schools receiving grants in 2011 -12 as compared with 2010-11. However, the decision making process to spend this money effectively and efficiently needs to be strengthened. there is a stark decision making problem utilizing the funds coming through this grants effectively and efficiently.

SMC in RTE

The RTE Act, envisaged that parental involvement in children’s education through School Management Committees will improve governance at the school level and subsequently improve learning outcomes. SMCs have been given power to plan for the expenditure of money at the school level and monitor school level activities – such as teacher attendance, the Mid-Day Meal process amongst other things. They were formed to accelerate the process of a bottom – up planning and formed an important link in the process of decentralized planning, implementation and monitoring in the education system.

Reality at the ground level

SMC as a platform of enhancing school governance is yet to play a pivotal role. There are instances where SMC members are not aware of their status as SMC members[7]. Empowering parents cannot be seen in isolation from the community dynamics in the community. In one of the study by Mansuri and Rao[8], suggests that in many community based or driven initiatives for (like SMCs) in India it has been seen that they are “dominated by elites and both targeting and project quality tend to be markedly worse in more unequal society”. Having known the fact that Indian society is fragmented mainly on the basis of caste and gender, I fear that the SMCs may also face the same fate if such dynamics are not taken care of before any interventions.

The level of awareness and opinions of SMCs regarding various school level issues is relatively low[9]. Low awareness will lead to no participation or passive participation[10]. Simply raising awareness is not the ultimate solution to make them actively participate. They need to be trained in such a way that they understand the socio-economic contradictions within this society: and do not accept life for what it is and learn to question the truth that they follow.

Training Pedagogy for SMC

The pedagogy to be used for training SMC members by the government institutions and NGOs needs to be a critically assessed[11].

The pedagogy of the training session of SMC members must be based on adult learning principles. The SMC members should be facilitated to rethink their present role in school and the ways to improve it – as a manager of the school in which their children take education. Their active participation is the requisite to enhance their children’s learning outcomes. They should think it as their duty to take part actively in the decision making of the schools for their children’s betterment. It should give them hope, that change is possible. It should facilitate them to question and reflect why the grants at school level come late and if they can do something about this; they should also know what the learning outcomes of their children and be able to interact with teachers with confidence.

The SMC members after the training through critical pedagogy will be able to enter into dialogue with other stakeholders at the school level like the head master block level education officers and elected ward members for improved school governance. They can also actively support the school by motivating other community members to send their children to school, thereby increasing students’ enrolment and retention as and supporting teachers. If SMC members actively participate in SMC meetings then better action plan which will be Specific, Measurable, Achievable, Realistic and Time-bound. The concern of proper use of funds for better and usable infrastructure facilities will also be addressed more effectively. SMC members can be active advocates for the school development from the Panchayat to Zila Parishad level.

Hence my strong argument is to frame a critical pedagogy while training SMC members to take active part in owning their school activities and make a participatory School Development Plan. Hence, those who work with SMC members need to understand the members’ socio-economic profile, power structures in the village and in the school and the member’s level of consciousness before they really work on the pedagogy of training SMC members.


[1] http://www.dise.in/Downloads/Publications/Publications%202011-12/Flash%202011-12.pdf

[2] http://ssa.nic.in

[3] As per 9th ASER report, enrolment in 6-14 years age continues to be very high with more than 96% children enrolled in schools. Link to ASER report  (http://img.asercentre.org/docs/Publications/ASER%20Reports/ASER_2013/4-pagers/nationalfindings-aser2013.pdf)

[4]http://img.asercentre.org/docs/Publications/ASER%20Reports/ASER_2013/ASER2013_report%20sections/aser2013fullreportenglish.pdf

[5] PAISA 2012: Overall outlays for teachers and school infrastructure increased by 61% between 2010-11 and 2011-12. School Infrastructures accounted for the next highest share with an allocation of 35% of total SSA budget after allocations to teachers which are about 43%.

[6] http://www.siliconindia.com/news/general/Most-Govt-Schools-in-India-Lack-Basic-Infrastructure-Survey–nid-149669-cid-1.html

[7] Take for example, these quotes from the stories our PAISA associates sent us from the field[4] which show the information and capacity problems SMC’s face. –  “We found that the SMC members were not even aware that they are members” –Swapna Ramtake, Sagar, Madhya Pradesh  / “SMC members don’t make the connection between their attending meetings and the quality of outcomes in the school” – Poonam Choudhary, Jaipur, Rajasthan / “We met the lady who was made the SMC head by the headmaster, and she was never told what her roles and responsibilities are” – Seema Muskan, Nalanda Bihar. (http://www.accountabilityindia.in/accountabilityblog/2522-empowering-school-management-committees-helping-smc-members-plan-better)

[8] http://www.cultureandpublicaction.org/bijupdf/mansurirao.pdf (Community-Based and -Driven Development: A Critical Review, Ghazala Mansuri and Vijayendra Rao, The World Bank Research Observer, vol. 19, no. 1 – Spring 2004)

[9] http://www.create-rpc.org/pdf_documents/India_Policy_Brief_4.pdf

[10] Chettri, A. 2010. “Citizenship and Governance: Citizen Participation in Mandatory Village Forum”, Perspectives in Social Work (published by College of Social Work, Nirmala Niketan), Vol: XXV (No. 1 & 2) April – August 2010.

[11]Critical pedagogy is a philosophy of education and social movement that combines education with critical theory. First described by Paulo Freire, it has since been developed by Henry Giroux and others as a praxis-oriented “educational movement, guided by passion and principle, to help (People) develop consciousness of freedom, recognize authoritarian tendencies, and connect knowledge to power and the ability to take constructive action.” Critical pedagogy includes relationships between teaching and learning. Its proponents claim that it is a continuous process of what they call “unlearning”, “learning”, and “relearning”, “reflection”, “evaluation”, and the impact that these actions have on the students, in particular students whom they believe have been historically and continue to be disenfranchised by what they call “traditional schooling”.

How special is Bihar?

Bihar’s Chief Minister, Nitish Kumar has been unrelenting in his pursuit of the “special category” status for the State in recent months – and with elections around the corner, we may not hear the end of it anytime soon. Could it merely be a key poll plank for the party in the upcoming elections or dare we see it as the answer to Bihar’s many development woes? – We explore these questions below.

What is the concept of a “special category state”?

In 1969, when the Gadgil-Mukherjee[1] formula for sharing Central Plan assistance among states was conceived, Assam, Nagaland and Jammu & Kashmir were characterized as ‘special-category’ – or states that needed an extra push to bring them on par with development levels in other states. Over time, the number of special category states grew and today there are 11 such states – Arunanchal Pradesh, Assam, Manipur, Meghalaya, Mizoram, Nagaland, Sikkim, Tripura, Uttarakhand, Himachal Pradesh and Jammu & Kashmir (We may soon have a 12th entrant with the government having recently announced special category status to Seemandhara). The initial identifying features of special category states were harsh terrain (hilly regions, international borders), backwardness and social problems prevalent in the state.

The key benefits of a special status to a State are:

  • A higher share in the Union government’s resource allocation – 30% of the Centre’s Plan Budget support goes to special category states.
  • Significant excise duty concessions aimed at attracting investments in industries to relocate/locate manufacturing units to the State.
  • Until 2004-05, 90 % of the Central assistance to special category states used to be treated as a grant and the remaining 10 % was considered as an interest free loan. (This ratio was 70:30 for general category states).
  • The 12th Finance Commission recommended the Centre give only grants, and leave it to the states to raise loans. In fact, since 2005-06, with the advent of large Centrally Sponsored Scheme (CSS), the loan component for both categories has been reduced substantially. Instead, States are required to provide matching grants under such scheme, with differing norms for the 2 categories. For instance, under the Sarva Shiksha Abhiyan (SSA), general category States need to provide 35% of the total expenditure and 65% is borne by the Centre. For special category states, however, the ratio is 10:90.

Not just Bihar, but Chhattisgarh, Jharkhand, Odisha, West Bengal and Rajasthan have all also been demanding special category status for a decade now. We compare some of Bihar’s key financial indicators with other BIMARU states to see what makes Bihar special in its need for a special category status.

Overview: Per Capita Income, Population and GSDP

Uttar Pradesh has the lowest per capita income of all the BIMARU States, closely followed by Bihar.

State Population

(Census 2011)

GSDP 2011-12*

(INR Million)

GSDP Per Capita

(INR Thousand)

Bihar 104,099,452 2,469,950 23.7
Madhya Pradesh 72,626,809 2,012,900 27.7
Rajasthan 68,548,437 2,278,240 33.2
Uttar Pradesh 199,812,341 4,218,710 21.1

*at 2004-05 constant prices

Source: The Planning Commission

Ability to raise revenue internally

Of all the BIMARU states, Bihar seemingly has the hardest time raising revenues internally.  As a percentage of total tax revenue generated by general category states internally, Bihar has only a 2.4% share. The figure is even lower for non tax revenue at 1%.  By no means is this a result of the State’s population (as a loose proxy of the size of its economy) as Bihar ranks second only to UP among the 4 states.

In this context, it may be argued that such granting special status to the state of Bihar may create incentives for investment to come in to the State, generating incomes and raising the ability of the State to raise resources internally. Of course, merely granting tax holidays to investors may not be enough to bring them in and other complementary measures may be needed to be taken the state government as well.


State
Tax Revenue
Own tax Revenue
Non-tax Revenue
Own Non-tax Revenue
Bihar 5.3 2.4 4.9 1.0
Madhya Pradesh 5.9 5.1 8.0 8.5
Rajasthan 5.3 4.8 7.6 10.4
Uttar Pradesh 13.5 9.9 12.7 11.5

All figures as % of respective totals for all states in the category (special/ non special)

Source: “State Finances: A Study of Budgets, 2014”, RBI

Social Sector Spending

Of all BIMARU states, Bihar spends the least per capita on the social sector. These numbers should be interpreted carefully. Viewed simply, they could signal that the state’s resource envelope is so small that it is unable to spend any higher amount on its social sector. This can also be seen above in low per capita income figures and a low ability of the state to generate revenues internally. However, such low spending can also indicate more fundamental, systemic problems with the State’s ability to spend the money available with it. Such problems may manifest themselves in many ways – inadequate planning, bottlenecks in the flow and release of funds, lack of financial autonomy with the end user of funds, a top down approach to fund allocation often leading to a mismatch between what the money is allocated for and what really needs to be spent on – so on and so forth.

In such circumstances, merely a higher allocation of funds to the State via a special status route may not be enough.

State Social Sector Expenditure* (INR Billion) Per Capita Social Sector Expenditure (INR Thousand) Social Sector Expenditure

(as % of GDSP) **

Bihar 240.5 2.31 9.7
Madhya Pradesh 271.3 3.74 13.5
Rajasthan 278.5 4.06 12.2
Uttar Pradesh 597.2 2.99 14.2

Source: “State Finances: A Study of Budgets, 2014”, RBI

Central Assistance: Loans, Grants and Share in Central Taxes

Bihar receives 12% of all Central taxes being distributed among the general category states in 2011-2012. This is the second highest share not only among BIMARU states, but among all the general category states, with no close second. Even among the share in grants, Bihar receives a significant share – placing it in the top 5 states across the non-special category. (Pradesh, Andhra Pradesh, Maharashta and West Bengal are the 3 states receiving a higher share of Central grants than Bihar)

State Share in Central Taxes* Grants* Loans from the Centre (Gross)

(INR Billion)

Bihar 12.1 7.6 8.3
Madhya Pradesh 7.9 7.6 10.3
Rajasthan 6.5 5.7 3.4
Uttar Pradesh 21.8 13.6 3.2

* As % of respective totals for all states in the category (special/ non special)

Source: “State Finances: A Study of Budgets, 2014”, RBI

Looking at the 3 heads under which a State may receive money directly from the Centre, we see that Bihar performs significantly above the average and receives considerable Central assistance. Of course, whether this is adequate or not may be debated but it remains true that not only are there other poor states that receive significantly less (for instance Orissa received 2.3 billion INR in loans in 2011-2012, and had a 5.3% share in central taxes and 6.3% share in central grants) – but also that there exist far deeper problems in our poor states (including Bihar) that cannot be solved by just throwing more money at them.

It must be noted that there exist no objective criteria for distribution of funds among the special category states. While the main considerations should be relative poverty and development needs (including those arising out of structural issues such as terrain), often these may be politically motivated decisions – led by the relationship of the incumbent State and Central governments. The concept of special category states may also need to be revisited and it must be recognised that poverty and growth are complex problems that demand complex solutions addressing not just financial issues, but also questions of political will,  governance, administrative accountability, capabilities and deep, systemic changes.


[1] The Gadgil-Mukherjee Formula works in two stages. First, 30 percent of total assistance money is earmarked for the special category states. This may be distributed among these states on the basis of their plan size and past plan expenditures, without using any explicit criteria. The remaining 70 percent are distributed among the general category states according to a set of criteria with relative weights. These criteria have been summarised in Avani Kapur’s blog on “Backwardness and Special Status”.

Vote on it

The 16th Lok Sabha elections are round the corner.  In an attempt to keep up with the times, this blog seeks to provide some insight into voter turnout trends and a theoretical model on what determines an individual’s decision to participate by voting in the election process.

Data source: Election Commission website

Based on data from the Election Commission of India, voter turnout has increased marginally from 55 % in 1971 (5th Round of Lok Sabha) to 58.7% in 2009 (15th Round of Lok Sabha Elections). In fact the highest voter turnout was in the 2nd Round at 62.2% in 1957 as per the website.

If one looks at the voter turnout in the last 5 General Elections in India, voter turnout has been around 58%.

If one was to compare our average voter turnout to developed democratic nations one finds that India has done better than the United States which has recorded an average voter turnout of 48.3 in all general elections from 1945 to 2000. In Canada the voter turnout is close to 68% for the same period.

The graph below highlights the variations in voter turnout in the last General Elections (2009):

Data source : http://pib.nic.in/newsite/PrintRelease.aspx?relid=104547

In the 2009 General Elections, the Northeast region did particularly well with Nagaland recording a turnout of over 90% followed by Sikkim and Tripura which recorded an 80% plus turnout. Delhi and Maharashtra for the same period had  a voter turnout of 51.85% and 50.7% respectively.

In the same period areas in South Delhi and South Mumbai recorded low voter turnouts (around 40%) in 2009. Media discussions during that period attributed this low turnout in the Metros to political apathy and the alienation of the elite and middle class from the political process.

An article by Swaminathan S Aiyar published right after the General Election in 2009 said that no one really knows what the driving force behind voter turnout is and media analysts need not be taken so seriously. He went on to state that the drastic changes in voter turnout in the same state between two general elections (For example Bihar dropped from 58% to 44% in terms of voter turnout between 2004 & 2009 elections)  suggested that this phenomenon was not a class, caste or income behavioural issue.

There are two different traditions that seek to address the question of why individuals choose to vote. One models itself on the lines of underlying demographic, socio-economic and attitudinal characteristics, as mentioned above.

The second tradition finds its roots in public choice literature. It models voter turnout as a rational choice model.  Voters make a decision to vote or not vote based on their own self-interest.( For more on information on this model read Hindriks and Myles book Intermediate Public Economics, 2006) In terms of the economic definition of utility there are things that must be taken into consideration.

Participation in the voting process always has a cost. There is the direct cost of travelling till the polling booth and the indirect cost of the time it takes for the activity.For the purpose of simplicity, let the direct and indirect cost of voting be denoted by C

Let the expected benefit the voter derives from voting be B

Only when B-C > 0 will a voter consider voting.  This derivation comes with the precondition that the individuals involved in voting are rational utility maximizers i.e. The expected benefit from voting must exceed the cost of voting. This is a necessary condition

Understanding what this expected benefit comprises of yields some semblance of understanding voter turnout. To elaborate on what expected benefits means, let us introduce two political parties into the narrative. Let one party be called Bappi and the other Daler. Bappi promises an expected benefit in cash, kind, ideology or possible provision of public goods which amounts to E(Bappi)  and similarly Daler delivers a benefit of E(Daler).

Depending on which party provides the individual voter with a greater benefit, the individual prefers one party to the other. For simplicity lets assume the Bappi Party provides voters with a greater benefit. i.e.

E(Bappi) > E(Daler)

The expected benefit B can then be defined as the probability of Bappi winning into benefits if Bappi comes to power added with the probability that Daler comes to power and the benefits of him coming to power. Mathematically :

B = E(Bappi)* Probability of Bappi winning + E(Daler)* Probability of Daler winning

The voting paradox is this. If an individually rational voter feels that Bappi will undoubtedly come to power, then there is no reason for him to incur the cost C as he can still enjoy the benefits of Bappi coming to power.

If the situation is reversed to where an individual knows / feels that Daler will come to power assuredly, there is still no reason for her to go out and vote. The expected Benefit under Daler is lower and going to a polling station to vote for the losing party serves no purpose.

The theory suggests, the rational voter will only choose to vote if they expect that they can affect the outcome of an election. This situation only arises when there is no clear winner in terms of the contesting parties. This occurs when the population is evenly divided amongst the contesting parties and thus an additional individual voting in favour or against a party does actually play a role.

To extend this theory let us look at what happened in Bihar between 2004 and 2009. In 2004 RJD and its allies won 26 seats while BJP and its allies won 11 seats. The voter turnout at that point was 58%.

In 2009 the results reversed. The NDA won 32 seats while the RJD won 4 seats. As the rational choice theory predicts: Nitish Kumar was the clear winner in that year and this could potentially be a reason why voter turnouts dropped to 44 % in 2009.

The  Delhi Elections of 2013 witnessed a  voter turnout of  66 % . This was a 8 % jump from 58.7% in 2008. Unquestionably 2013 was a much closer election and had everyone interested in politics biting their fingernails.

These two examples seem to suggest that possibly the rational choice model could be in play here. It is only when voters feel that their vote could make a difference, do they come out and vote.

In the coming Lok Sabha Elections, The Election Commission of India has forecasted an expected voter turnout of 70 % , which is 12 % higher than the last General Elections.

Undoubtedly one cannot underplay the role of the media, growing political awareness, dissent amongst the youth and the rest of the country in this potential democratic upsurge.

Perhaps one could also explain this by the rational choice model, in which voters see that there is no clear winner emerging even less than a month before the first phase of voting begins and thus believe that their vote may actually count and for once actively participate in the democratic process.

Levine and Palfrey (2007) test for the competition effect on voter turnout in an experimental setting. They borrow from concepts of Game theory and Nash equilibrium and apply it to their experiment. Their analysis shows strong evidence of a competition effect i.e. The more competitive the election, the higher the voter turnout. In their study they also find that voters are highly responsive to voting costs.

One could test for rational choice theory in India and see whether there is evidence of its existence by doing a constituency / state wise study of the candidates in the upcoming elections and comparing it with previous Lok Sabha elections. As a starting point one could simply check the correlation between the margins by which a party won and the voter turnout. However testing for rational choice would require a more in –depth study than just citing a few examples as presented in this blog to see whether this theoretical model is actually applicable in the Indian context.

References :

  1.  The Public Justice Report : Voter Turnout and Competitive Politics , 2000 David T Koyitz : http://www.cpjustice.org/stories/storyReader$509
  2. Election Commission India website : http://eci.nic.in/eci/eci.html
  3. Statewide Analysis of 14th Lok Sabha Elections : CSDS Team http://www.sciencespo.fr/ceri/sites/sciencespo.fr.ceri/files/elections.pdf
  4. Swaminomics Blog :http://swaminomics.org/fallacies-about-voter-turnout/
  5. Hindriks, Jean, and Gareth D Myles. Intermediate Public Economics.The MIT Press, 2006
  6. Levine, David K and Thomas R. Palfrey. The Paradox of Voter Participation? A Laboratory Study, The American Political Science Review, Vol. 101, No. 1 (Feb., 2007), pp. 143-15

A Night in the Life of a Delhi Government Hospital

Male, mid-thirties, native of Uttarakhand. Upper left arm disfigured due to incorrect vaccination received in childhood. No alcohol or narcotic intake. Working in Delhi since mid-1990s: first as a cycle-rickshaw driver, then construction labour, and finally, since he is growing weaker due to untreated tuberculosis (TB), as a domestic help. Picked up at approximately 8:00pm in a park in Roshan Pura, Old Delhi.

Male, late-thirties, native of Bihar. No visible distinguishing marks. No alcohol or narcotic intake. Working in Delhi since late-1980s as a sewer cleaner. Picked up at approximately 8:15pm as he walked from Old Delhi to Karol Bagh.

The men described above were two homeless men, or “vagabonds” in the Delhi Police’s terminology, whom I encountered on a late Friday night in the Casualty (Emergency Room) of a large government hospital in Delhi. I was there out of curiosity to see what happens during a regular night shift in the Casualty ward of a government hospital. They were part of a group of approximately fifteen men rounded up by the police, as Delhi streets were being swept clean of these vagabonds in an effort to reduce security threats ahead of Republic Day.

I had arrived shortly after the night shift had started. I didn’t have a set agenda, and had arrived with a vague purpose of trying to understand who exactly availed the health services provided at a government hospital, of observing the quality of care, and contextualizing the infrastructural, human resource, and budgetary constraints one hears of in such hospitals.

The Casualty ward was a hub of activity at that hour. Patients ranged from a young man with a rat bite, to a group of teenagers who had got into a street fight; from a young girl with a deep knife wound on her arm, inflicted by her raging adopted brother, to a small baby who was dead on arrival. To take care of all of these patients, there were two resident doctors, two interns, three nurses and a couple of ward boys. A policeman was also present to facilitate with the medico-legal cases (MLC), such as the group of vagabonds and the girl hurt by her brother.

A feisty young resident doctor was in charge, and was mostly busy with the vast amount of paperwork involved for each MLC.  However, to the extent that she could, she also took time to oversee how the interns were examining the patients, asking the interns questions about symptoms and mentoring them through the procedures. She had a great bedside manner: kind and empathetic to all patients she examined, but completely assertive with the rougher patients when she needed to show who was in charge. Through it all, she kept up a friendly banter with her fellow doctors.

As the night wore on, the commitment and leadership from this handful of doctors became apparent. However, there was a clear lack of human resources and it was not enough to deal with other systemic issues that led to the ill health of the homeless and poor migrants in the city. As the migrant from Uttarakhand recounted his tale, he mentioned that he was suffering from TB but had been unable to complete his treatment. Upon hearing this, the accompanying policeman’s expression visibly changed from a “been-there, heard-it-all-before” look, to one that was partly sheepish and partly showed concern. To be denied from taking a full 8-month treatment for TB just because one doesn’t have a “witness” or a caretaker to help deal with the side-effects of the medicine, was news not only to me, but also to the policeman. The police were just following through on orders from above and he tried to reassure me that all the men would be given a comfortable place to stay with a warm blanket. However, there is no way to determine the veracity of that statement or the true nature of their treatment in whatever facility they would have been taken to from the hospital.

As Delhi’s population multiplies and puts pressure on its resources, the need for streamlining and strengthening social protection and welfare schemes for the most vulnerable grows more acute. My experience at the Casualty ward highlighted for me the need to improve on three key aspects: a) a separate administrative wing in Casualty for MLCs; b) shelters for the homeless, and c) access to better health services for poor and mobile populations.

Concerning the first, it was apparent that the Casualty doctors were making the best of the facilities and staff at hand to provide medical care. The doctors shared that certain medicines allotted to the ward did not reach in them in the required numbers and, despite their complaints, no action had ever been taken. More than anything, however, the sheer amount of time spent by the resident doctors in filling out the paperwork associated with MLCs was staggering. One policeman to assist in this process was not enough, and resulted in several patients requiring critical care having to wait for the paperwork to finish. To ease the pressures on the resident doctors, it could be useful to have a separate team of junior doctors or administrative staff that take care of MLCs specifically.

Second, the development and maintenance of night shelters around the city is one of the mandates of the Delhi Urban Shelter Improvement Board (DUSIB). According to DUISB’s web site, at present there are 231 night shelters of various kinds in Delhi (see Table 1 below). There are no concrete figures for number of homeless people in Delhi (it ranges anywhere from 55,000 to 100,000 as a lower estimate) and the High Court has recently reprimanded and asked the DUISB to submit its long- and short-term policies for the homeless in March. If the DUISB puts more energy into providing an adequate number of shelters, perhaps the the susceptibility of these vagabonds to be out in the streets posing a threat could reduce.

Table 1: Night Shelters in Delhi

Type of Night Shelter Number
Permanent 84
Porta Cabin 98
Tent 22
Voluntary 27
Total 231

Source: DSUIB (2014). http://delhishelterboard.in/main/?page_id=3346

Finally, schemes such as the Rashtriya Swasthya Beema Yojana (RBSY), or the National Health Insurance Programme, which target Below Poverty Line (BPL) households across the country, need to take into account that individuals and families on the move may not always have the required documentary proofs of identity and residence to avail of such basic entitlements. As the examples cited above show, BPL migrants are more vulnerable to occupational health hazards, poor living conditions, and poor access to quality medical services. Thus, it becomes imperative to reflect upon how to include such populations while drafting social protection policies and programmes. The RSBY provides Rs 30,000 annual insurance coverage per BPL household. Provided with smartcards, beneficiaries can avail of cashless treatment upon presentation of the cards at public and private hospitals. However, several studies show that this innovation has yet to take off on the ground and that utilisation rates among the enrolled are actually quite low (see here, here, and here).

There are a number of organisations around the country, such as the Aajeevika Bureau, which have opened resource centres for migrants. These centres provide information on skill development, employment, health and housing services, as well as on legal aspects related to their rights and entitlements. At present, health services for migrants at these centres are not prioritised. Establishing more resource centres along these lines, with a greater focus on health, would go a long way in minimising “security threats” posed by the vagabonds I encountered that night.

Increasing internet surveillance: online transparency concerns in India

Early this February, internet giants including Google, Facebook, Yahoo! and Twitter made a breakthrough in online transparency laws, pushing the boundaries on how much information they can publish about U.S government requests made to them for data on online customers.  This breakthrough followed Edward Snowden’s disclosure of the mass data gathering exercises orchestrated by the National Security Agency (NSA) last year. The long and heated debate on the lack of transparency in U.S government-initiated internet surveillance mechanisms divided opinion between the right to privacy versus protecting national security.

After a long battle with the government, online companies are now able to report the number of Foreign Surveillance Information Act (FISA) requests and national security letters that they receive from the U.S government. While this is an important step towards beginning to understand the nature of government led surveillance, perhaps ‘breakthrough’ overshoots the definition of what happened in February.

Several rules imposed by the U.S government still manage to take the bite out of the data published. Two important features that hinder companies publishing updated, transparent information are:

a)      Companies cannot provide specific numbers – reports on total number of requests made by the government have to be published in bands of 1000s

b)      Information demanded under FISA would have to be published 6 months after the data is provided.

Despite these rules, online companies have inched towards clearing the air about how many requests they entertain from government agencies. Online service providers have published Transparency Reports on their websites that list government requests to provide or remove information. Most of them have user-friendly, downloadable datasets of government requests made over six month periods.

Why is this move important for India?

A comparison across governments reveals an interesting trend – India makes it top of the list of governments asking for information across a number of online platforms in 2013, as indicated in the following tables. At present, there is little information regarding the nature of government organizations collecting information and the type of information collected by governments. Considering the recent change in policy in America, this would be an ideal time to press for greater transparency in India too.

Google and YouTube (January – June 2013)

No. Country Total Requests made by Govt. Percentage of requests where some data was provided* Specific users / accounts requested by Govt.
1 United States 10918 83 21683
2 India 2691 64 4161
3 Germany 2311 48 3079
4 France 2011 49 2481
5 United Kingdom 1274 67 1818


Facebook (January – June 2013)

No. Country Total Requests made by Govt. Percentage of requests where some data was provided Specific users / accounts requested by Govt.
1 United States 11000 – 12000 79 20000 – 21000
2 India 3,245 50 4,144
3 United Kingdom 1,975 68 2,337
4 Germany 1,886 37 2,068
5 Italy 1,705 53 2,306


Yahoo! (January – June 2013) Though India is not amongst the top five, it ranks #7 on the list.

No. Country Total Requests made by Govt. Percentage of requests where some data was provided* Specific users / accounts requested by Govt.
1 United States 12,444 37 40,322
2 Germany 4,295 5 5,306
3 Italy 2,637 10 2,937
4 Taiwan 1,942 3 2,650
5 France 1,855 11 2,373
7 India 1,490 23 2,704

*Does not include Non Content Data Disclosed

Twitter (July – December 2013) Though India is not amongst the top five, it ranks #6 on the list.

No. Country Total Requests made by Govt. Percentage of requests where some data was provided* Specific users / accounts requested by Govt.
1 United States 833 69 1,323
2 Japan 213 23 253
3 France 57 23 102
4 United Kingdom 56 43 117
5 Brazil 20 30 55
6 India 19 32 27

*Does not include countries that made emergency disclosure requests

Several organizations such as Google, Microsoft, Yahoo! and Apple, amongst others have demanded a Global Government Surveillance Reform. Partly to establish their stance against data requests made by governments and partly, I would assume, to clear the air against the bad press they earned in the debate for greater internet privacy.  This push for reforms can be the starting point for a mutually agreed upon framework that spans across governments across the world to uphold the rights of individuals online. It can also mark the beginning for country-specific advocacy for greater transparency.

A summary of the reform agenda:

a)      Governments should self-regulate and request for specific data related to clearly-defined cases as opposed to asking for large quantities of information

b)      Charter a legal framework to protect the rights of individuals and provide checks and balances against authorities asking for data

c)       Allow disclosure of information by companies providing the data (number and nature of demands) and governments demanding the data

d)      Open information borders, so that citizens can access information stored outside their country and service providers do not have to operate locally

e)      Create a transparent framework that stretches across borders and homogenizes conflicting laws

In addition to the issues covered above, this blog post attempts to raise more questions for discussion:

a)      Is there a need for a shared forum to discuss what an individual can do once they are alerted to the fact that their privacy has been compromised? (Whom can they contact, what are country specific laws?) In the case where companies cannot disclose to individuals that their information was shared, can there be a mutually agreed upon time-lapse– after which governments and companies can deem it safe to let the individual know that their information was compromised in the past?

b)      Who is liable to keep data safe once it has been handed over to governments? Where does the responsibility for safekeeping of the data begin and end for those asking for and those providing data? How long can a government agency store an individual’s data?

c)       How do we create a space for more research to disambiguate current data published by companies? For example, are increasing demands for information relative to the growing number of subscribers for an online product? What criteria define companies to comply with or deny requests? Is this criterion uniform across companies and uniformly applicable to all governments – what explains the higher compliance to certain countries requests such as the U.S?

d)      Finally, how can we hold our governments responsible to publishing their own transparency reports? At present, the word ‘government’ offers no nuances on the departments demanding, using and storing data – thus making it difficult to demand transparency measures from them.

Considering India is high on the list of governments requesting data – at least in terms of absolute numbers of requests made, it would be worthy to begin compiling what information and laws exist or progress has been made to increase transparency within the country.

Do Private Tuitions improve Learning Outcomes?

Despite increased attention to school based learning over the past decade by policy makers, the ASER reports have shown that the learning levels of children in the Indian education system have remained consistently low and have, in fact, declined over the past 8 years. The latest ASER report shows that only 41% of children in the age group of 6-14 can read a standard 2 text (ASER 2013). Consequently, critical and rigorous analysis of policies surrounding provision of school-based education has received much-deserved attention[1]. In the process, the role of additional educational inputs provided by households, such as private tutoring, has remained neglected.

Private tutoring is defined as fee-based tutoring that provides supplementary instruction to children in academic subjects that they study in the mainstream education system. This phenomenon is widespread across many developing countries, including India[2]. As per the latest ASER (ASER 2013), approximately one-fourth of children enrolled at elementary level (Std. 1 to 8) in rural India attend private tuitions. They pay on average, Rs. 170 per month, amounting to slightly above Rs. 2000 per annum to attend these tuitions[3].

An important question that arises in this context is: do learning outcomes of children improve if they attend tuition? Finding a difference in learning outcomes of those who attend tuition and those who don’t, and attributing it to private tuitions is misleading. Part or all of the difference in learning outcomes might be due to different characteristics of children who attend tuition. There are observable and unobservable differences between the two groups of children, which make it difficult to figure out the effect of tuition, if any[4].  To give an example, ASER data indicates that children belonging to richer households are more likely to attend tuitions. Richer households are also likely to provide more support to a child in the form of other material inputs. Data also shows that children of more educated parents are more likely to attend private tuition, but more educated parents are also in a position to help the child with studies. This makes it difficult to disentangle the effect of tuition from the effect of other material inputs, or the effect of having educated parents.

There are many techniques available to overcome this problem. Interested readers can refer to the relevant literature[5]. Choice of technique ultimately depends on availability (or not) of appropriate dataset, time and money at hand, and feasibility of data collection. We use household fixed effects (FE) technique to estimate effect of tuition on learning outcomes[6]. Household FE utilizes variation in status of children on private tuition within a household. To give an example, suppose there are two children in a household. One attends private tuition, and other doesn’t. Then, the difference in the learning outcomes of these two children would be attributed to private tuition. Note that all other observable and unobservable factors at the household or village level affecting learning outcomes are controlled for in this technique. Hence, household FE approach reduces self-selection problem substantially. But one must remember that it doesn’t eliminate the problem completely since it can’t control unobservable child-specific differences such as motivation, intelligence, dedication etc.

We use this technique due to the availability of ASER dataset for 2011, whose underlying sampling strategy is such that pre-determined number of villages from each district and pre-determined number of households from each selected village are surveyed[7]. A unique characteristic of ASER dataset is availability of learning outcomes for reading and math[8].

In order to estimate learning levels, we developed a standardized aggregate score. For this, we sum up reading and math scores for each child, and then standardize it by subtracting a child’s aggregate score from the mean aggregate score of all students, and then dividing by the standard deviation of aggregate score for that year. This standardized aggregate score has been used as the dependent variable in our empirical analysis. The key independent variable is whether the child attends tuition. Other independent variables are whether the child attends government or private school, age and gender of the child, class in which the child is studying, and finally both parents’ age and education. We have other controls at the household and village level, but they are not relevant in a household FE model.

What do the results show? Household FE estimation results indicate that attending private tuition has 0.14σ effect on learning levels. How large is this effect? Comparing the coefficient on private tuition with that of standard/class in which child is studying or that of type of school reveal that the effect of attending tuition is as large as an additional year of education or attending a private school instead of a government school[9].  Interestingly, results also show that the effect of tuition is almost twice as high for children enrolled in government schools, compared to those who are enrolled in private schools. Further, children who attend tuition and whose parents are less educated, benefit more from these tuitions. Effect of tuition is also higher for children who stay in non-pucca households compared to those who stay in pucca households. Given that children attending government schools or having less educated parents or less well-off have lower learning levels, private tuitions clearly are benefitting disadvantaged students.

There is significant variation in prevalence of private tuition across states. States like West Bengal, Tripura have 67-69% children at elementary level attending private tuition, while Bihar and Orissa have 40-50% children at elementary level attending private tuition. And we find that the effect of tuition is higher in these states. In Bihar and West Bengal, attending private tuition has 0.22σ effect on learning levels, while in Odisha, attending private tuition has 0.18σ effect on learning levels.

Why do private tuitions have a positive effect on learning outcomes? One straightforward explanation is that those who attend tuition spend more time studying. Though ASER doesn’t capture time spent at tuitions, analysis of IHDS data indicates that those who attend tuition spend, on average, 9 hours in tuitions[10]. That would mean 1.5 extra school days per week. Another explanation could be remedial teaching in the sense that tutors might be making some efforts to identify the child’s weakness, and teach accordingly. And finally, as Dr. Wadhwa points out in the ASER report, the link between incentives and accountability – if someone is paying for a service, the onus is on the service provider to deliver, because the consumer can always ‘vote with her feet’.

References

Bray, Mark. 2007. The Shadow Education System: Private Tutoring and Its Implication for Planners. UNESCO: International Institute for Educational Planning, Paris

Duflo, Esther, Glennerster, Rachel, & Kremer, Michael. 2007. Using Randomization in Development Economics Research: A Toolkit. Handbook of Development Economics, edited by T. Paul Schultz and John A. Strauss, Vol. 4

French, Rob & Gandhi-Kingdon, Geeta. 2010. The Relative Effectiveness of Private and Government Schools in Rural India: Evidence from ASER Data. DOQSS Working Paper No. 10-03, Institute of Education, University of London

Muralidharan, Karthik. 2013. Priorities for Primary Education Policy in India’s 12th Five Year Plan. India Policy Forum 2012-13. Vol. 9, pp1-46

Wadhwa, Wilma. 2014. Private Inputs into Schooling: Bang for the Buck?, ASER 2014. Available at http://www.asercentre.org/Keywords/p/205.html.


[1] See Muralidharan (2013).

[2] See Bray (2007).

[3] There are Statewise variations. For details, see Wadhwa (2014).

[4] This is referred to as ‘self-selection’ problem in empirical economics.

[5] Duflo et al. (2007).

[6] Approach is similar to French & Gandhi-Kingdon (2010)

[7] We perform same analysis using ASER 2012 data as well. Since results are fairly similar, we report findings obtained from using ASER 2011 only.

[8] Details can be found in any ASER report available on ASER website.

[9] Baseline is a child in government school not attending private tuition.

[10] IHDS stands for India Human Development Survey. Details can be found here: http://ihds.umd.edu/

Highlights from the Interim Budget 2014-15

This document highlights the key features of the interim budget 2014-15 that was released on 17th February, 2014.

The final budget will be released post elections in July 2014. Please keep track of the analysis of the final budget on the AI website. Last year’s briefs are available here.

  • Overview
  • In 2013-14 there has been lower than expected growth which has consequently led to lower than estimated revenues. The country will not be able to spend the budgeted plan expenditure. The non plan expenditure will exceed the budget by a marginal amount. Thus, no significant change in the plan and non-plan expenditures for 2014-15. Total plan expenditure of the government for 2014-15 is  5,55,322 cores; Non-plan expenditure 12,07,892 crores.
  • The overall Gross Domestic Product (GDP) growth is estimated at 4.9 percent for the year 2013-14 The Fiscal deficit is 4.6 percent of the GDP.
  • The Revenue deficit is at 3.3 percent.
  • Core inflation is 3 percent and Wholesale Price Index (WPI) inflation is 5.05 percent.
  • Food inflation though still high has reduced from 13.6 percent  to 6.2 percent in the last one year
  • Report Card: 10 years ago and now

The table below highlights some of the main changes in the past 10 years.

10 years ago 2013-14 BE
Food grain production 213 million tonnes 263 million tonnes
Rural roads under PMGSY (in km) 51,511 kms 389,578 kms
Education spending  10145 crores  79451 crores
Health spending  7248 crores  36322 crores


  • Social Sector Initiatives

The plan allocation for some key ministries, schemes and sub-plans is as follows:

Name of Ministry / Sub-plan Allocation in   crores
Ministry of Minority Affairs 3,711
Ministry of Tribal Affairs 4,379
Ministry of Social Justice and Empowerment 6,000
Ministry of Panchayati Raj 7,000
Ministry of Drinking Water and Sanitation 15,260
Ministry of Women and Child Development 21,000
Ministry of Health and Family Welfare 33,725
Ministry of Human Resource Development 67,398
Ministry of Rural Development 82,202
Scheduled Caste Sub-plan 48,638
Scheduled Tribe Sub-plan 30,726
Gender Budget 97,533
Child Budget 81,024
Food Subsidy 115,000
  • The North East states, Himachal Pradesh and Uttarakhand have been provided with an additional central assistance of  1200 crores.
  • New initiatives
  • An allocation of   444.59 crores has been made towards marketing minor forest produce.
  • A scheme to promote community radio stations has been allocated 100 crores.
  •  200 crores have been allocated to promote entrepreneurship and provide concessional finance among the scheduled caste (SCs). This will be done through Industrial Finance Corporation of India (IFCI) who will set up a Venture Capital fund for SCs.
  • For Skill Development, the National Skill Certification and Monetary Reward Scheme has been launched in August 2013. 168,043 youth have been enrolled and 46 percent of them have completed their training
  • Finance Sector
  • Proposal to provide  11,200 crores for capital infusion in public sector banks.
  • The Bhartiya Mahila bank has been inaugurated. A corpus of 8000 crores has been provided for housing ( 2000 crores for Urban Housing Fund and  6000 crores for Rural Housing fund).
  • Banks are expected to exceed the target of  700000 crores of agricultural credit.
  • The SHG network has grown from 9,71,182 women being linked to banks to 41,16,000 women in the last decade.
  • Important Legislations passed
  • 12.8 lakhs land titles covering 18.80 lakh hectare were distributed under the Scheduled Tribes and Other traditional Forest Dwellers Act
  • New companies Act passed to replace a law of 1956.
  • The Right to Free and Compulsory Education Act passed in 2009.
  • National Food Security Act was passed.
  • The Pension Fund Regulatory and Development Authority Act (PFRDA) was passed which establishes a new pension system

Strengthening SMC to make SDP– Should be an Empowering Process

I had recently attended two training programmes on Strengthening the School Management Committee[1] (SMC) to make an effective School Development Plan. One of it was at the state level, wherein all the District Education Officers of the state attended and the other was at block level, where in block level extension officers for education including some head masters and cluster coordinators were present.  The major objective of this program was to train the officers to support SMC members with respect to access, equity, quality and community participation, while SMCs develop the School Development Plan (SDP). All of them are directed towards empowering individuals in the management of school related activities.

The aim of this blog is to unravel whether state mechanisms are serious in moving towards empowering SMC members, or whether it is merely a box-checking endeavor to gather numbers, using experiences and reflections from this training programme.

At the outset, I was really impressed with the detailed module[2]  on how to prepare School Development Plan (SDP)[3] the state has prepared. The module for the training programme had a detailed schedule, with the exact time the trainer required for each topic. In both the training programme that I attended, I found that the trainers have followed the module fully. However, while they were instructing the officers on what they need to do, they failed to share or explain, how to do it – the process/methodology of doing it. In other words, the trainer did not focus on the information which could potentially be the vehicle to empower and conscientize the SMC members and the community at large. This is the concern that I want to raise among the policy makers for critical debate on the process of strengthening SMC at the community level.

The process of training, that I witnessed, was like the “banking” approach to education — a metaphor used by Paulo Freire[4] that suggests trainees are considered empty bank accounts that should remain open to deposits made by the trainers. This “banking” approach will result in the dehumanization of both the trainees and the trainers. In addition, it will stimulate oppressive attitudes and practices in society. Hence the SMC members will never take the role as envisaged in RTE Act.

As per the module, the SMC members need to map down the history of the school, make a social and resource mapping, as well as draw out different types of Venn diagram for mapping out the distance of different villages from where the children come to that particular school, etc. I feel that this process, is actually a Participatory Learning and Action (PLA)[5] methodology. These tools allow parents to know more about the school and can be an empowering process for the community members. They can really own the school and feel for it. It can be the vehicle that helps the SMC members by allowing them to be aware of the strengths as well as the areas of improvements in their school while also mapping out different ways to make it more resourceful.

For example, if during SMC meetings, while documenting the history of the school, the people will come to know that actually this school was made due to someone’s contribution. This could motivate someone else in the village or the whole village to ponder over these things and also follow the same benevolent act in another way for the school. Thus, this method of collecting information through stories can lead to a domino effect of motivating other community members to not just start a thought-process on how to improve the schooling system in their community, but also try to emulate others who have made an impact.

The whole process of training the SMC members should be a means of consciously shaping them and the society for making a SMART[6] SDP. This particular philosophy, I feel, is missing from the whole process of training of the officers and thus, is not seen in the training of the SMC members.. I am really skeptical of the ability of such a training process to empower the community and SMC members.

The above reflection also helps us to look into two key areas for critical discussion:

a)      The process of making the SDP using participatory techniques will ‘break the silence’ of the poor and disadvantaged sections, recognize the value of popular collective knowledge and wisdom as well as legitimize the production of knowledge by the people themselves.

b)      The process of strengthening SMC training might  fail to highlight the key techniques in adult training for learning such as linking learning to problems, linking learning to people’s goals and visions, and giving SMC members  control over decisions on training.

The government officials need to understand that the School Management Committee (SMC) is another community based institutions (CBO) which, if strengthened and empowered well, with conscious effort, can really make many of their interventions effective at the grassroots level. The whole initiative of decentralization of power at the school level can be really strengthened. Above all the SMCs have a legal validity through the RTE Act 2009. It can be another marvelous initiative to move a step forward in terms of delegation of power and resources from the upper level to the lowest level.

The government officials are currently looking at the process of formation and strengthening of SMC as a task, like any other task, and leaving a trail of data, without really looking at the human aspect of it.

The envisaged dream of the RTE Act with regard to SMC’s functioning can only be achieved, if and only if the “Community” is conscientised. The active participation of its members in planning of SDP formation and quality monitoring is a great challenge which can be treated as an opportunity also. The RTE Act in a specific way wants to make the parents an important stakeholder in the decision-making process with an objective to make teachers and the principal more accountable for education delivery. This is envisaged for better learning outcomes of students. Thus the effort of integrating teacher and community through SMC can lead to better education system with decentralized planning and management.

The PAISA report has shown us that planning and allocation of funds as well as the timing of releasing funds and their actual receipts in schools are so problematic that whether the SDP will get the required funds at the right time is a big question. This is a persistent problem which needs a lot of bureaucratic support along with legislative advocacy for mending this problem. This process is continuous and taking place slowly but steadily. If the SDP does not get implemented due to delay of funds, then people could get de-motivated and slowly withdraw from the whole process. It is very important that SMC members are empowered to understand the constraints and take steps accordingly. Thus the whole training process should be liberating process to view things critically for better Redressal. Otherwise, I fear that with the existing training process, the SDP formation and implementation will be rhetoric bureaucratic exercise of just filling data and fulfilling the required norms without bringing any change in the community managed decision making process in education.

Through this blog, I would like my readers think about the following questions and initiate a discussion, “Whether the present Government policy and administrative structure/s provide a favorable environment for SMC to be conscientious and function effectively to achieve the goal as penned down in RTE Act?”

At the end, I feel that the soft component (Capacity Building) of the implementation of RTE cannot be ignored or taken for granted if we really want to see RTE Act moving out from the framework of implementation of schemes to enforcement of rights.


[1] To make the education system more effective and to encourage participation of parents in the decision process, a School Management Committee (SMC) will be formed in every school under the Right to Education (RTE) Act. As per the RTE Act, School Management Committee (SMC) should perform the following functions like, Monitor the working of the school; prepare and recommend school development plan, monitor the utilization of the grants received from the appropriate government or local authority or any other source, perform such functions as may be prescribed.

[2] http://www.mpsp.maharashtra.gov.in/site/Pdf/Forms/SDPform.pdf).

[3] http://righttoeducation.in/what-school-development-plan-smcs-will-prepare

[4] http://www.pedagogyoftheoppressed.com/author/

[5] https://faculty.washington.edu/markh/TC498/Readings/PRA_Manual.pdf

[6] SMART: Specific, Measurable, Achievable, Realistic and Time-bound