Through the Looking Glass

In all the debates about rights, social sector schemes and pushing towards ensuring quality services to citizens, there is but mere passing mention about the importance of performance management and administrative reforms over and above the implementation failure of public services[1].  This blog looks at the growing emphasis on the features of the social sector schemes, and overlooking the other side of the (administrative) coin which looks at the management style and employer-employee relations in a public sector context. This has been discussed by Lant Pritchett[2]  in the context of ‘State Capability Trap’ in reference to governance & public sector reform.

This view is definitely not new, and some efforts have been made towards inching closer to more output-based large scale performance management tools. While there are presently vertical lines of appraisal systems in place across departments and ministries, and supervisory checks are present on paper for those implementing schemes at a local level (see blogs on the process in the education sector by my colleagues), as well as citizen-led monitoring through social audits for large schemes like the MGNREGA, there are serious gaps when it comes to understanding performance at a macro level. From the World Development Report 1997, “The State in a Changing World”[3] we see a growing interest in the significant role that formal and informal institutions played, and the need for an overarching Public Sector Reform agenda that focused on ‘managerial capacities, developing positive organisational cultures, and providing incentives for performance both at individual and organisational level’. India added this to their agenda with the UPA government setting up the 2nd Administrative Reforms Commission (ARC) in 2005, which brought out 15 key recommendation reports over a period of 5 years. This was followed by the Public Services Bill in 2007 which reviewed and set up a Management System for Public Service.

A colleague at AI a few years ago had written a blog about the introduction of the PMES or the ‘Performance Monitoring and Evaluation System’ in 2009 (see here). Since then, quite a few evaluation reports have been published . So what is the PMES? According to the Administrative Reforms Commissions 10th Report in 2011, “Performance management is the systematic process by which the organization involves its employees, as individuals and members of a group, in improving organizational effectiveness in the accomplishment of organizational mission and goals”[4]. A subset of performance measurement, which looks at the inputs, goals, impact and effectiveness defined by the departments themselves  of a particular service/scheme, performance management looks at the planning, reviewing and evaluating the performance of individuals and departments, looking towards developing capacity (skill building) and promoting innovation for a result-oriented work process. A visual of what this looks like is given below

(Source: Adapted from Second Administrative Reforms Commission’s Tenth Report, 2008)


This is preceded by the processes that Ministries and Departments engage in, when structuring projects. According to the Guidelines for the Results Based Document (RFD), each Department (with consultations with their officers) sends in the RFD to the Ministry by February end, specifying their goals and success indicators for the year. After being reviewed by an Ad- Hoc Task Force (ATF) (which consists of domain experts, former Secretaries to the Government of India and retired Corporate Heads) this document, and the Budget, is approved/edited by March every year by the Cabinet Secretariat. This is followed by a review of the document by the High Power Committee- HPC (which consists of the Cabinet Secretary, Finance Secretary and other senior officials)- and submission of the report to the Prime Minister. The Departments/Ministries have to send in the year-end evaluation by May of the following year- with reviews again by the ATF and the HPC.

The strength of forming such a system is the recognition that there is a need for assessing performance of individuals in a system, done so in relation to the targets prepared at the beginning and in sync with goals of the department and not limited to the individual’s capacity. This type of review existed previously only for IAS officers (by the Department of Personnel & Training), but was not done for state level officials until recently. Taking a few pointers from the Appraisal format that currently exists by the Ministry of Personnel, the PMES allows for a concrete and systematic assessment of officials and their work in a standardized way and makes each Department review (and hopefully revise) their own specific structure of appraisals. A performance system, then, aims to removes any vague criteria of ‘good or bad’ for promotion, and moves towards improving motivation and creating an incentive based rating system that places the individual in a larger context of the organisation. This is backed by creating avenues for developing interests and aligning potential of an officer to what they will be doing in the future.

While these all are a welcome change, there are, as with every new system, challenges they need to overcome. At a broader level, most reforms that take an administrative avatar, have quite frankly, failed to take off, or be implemented. Even the recommendations that were offered by the ARC have only been taken up by a handful of States (though almost all of them were accepted by the Cabinet committee)- and it is unclear whether this was done with intentions for actual implementation or as a box-checking task. Problems such as pre-decided budgetary allocation, inflexible program structure or even the lack of a conducive work environment can hamper a government official’s performance.

This, in addition to blurred reporting structures (as is seen in most projects that have an inter-department characteristic or being handled by multiple agencies) can create hurdles for those who are finally held accountable for inaction. The website, where a few reports are available, does not showcase any documents on action taken if an official has fared poorly in the performance rating, or what incentive-schemes were developed, or the type of innovations that may have led to promotions. Putting this out in the public domain could be the start of increasing transparency in this area.

Recent debates emphasise the challenges that are seen with outputs (or lack thereof) of particular schemes, plagued with officials that do not implement well, usurp public resources and are inefficient. What has not gained much traction in these debates is the point of internal public sector reforms that has tried to go hand in hand with more schemes and more public services offered. If we look at the sheer number of schemes that exist in this country, and the number of officials on the ground and the incentives that currently exist, we can assess the gargantuan task that lies ahead. While steps have been taken to bring attention to this, the lack of enthusiasm in terms of the uptake of previous recommendations is telling of the future course of action.


[1] Performance of social sector schemes, 2014. http://finmin.nic.in/WorkingPaper/Performance_MSSSchemes.pdf

[2] ‘Capability Trap: The Mechanisms of Persistant Implementation Failure’ http://www.cgdev.org/publication/capability-traps-mechanisms-persistent-implementation-failure-working-paper-234

[3] World Bank. World Development Report 1997. http://wdronline.worldbank.org/worldbank/a/c.html/world_development_report_1997/abstract/WB.0-1952-1114-6.abstract

[4] Government of India. Department of Administrative Reforms & Public Grievances. ‘Performance Management in Government’ http://indiagovernance.gov.in/files/performance-management.pdf
On Backwardness and Special Status – part 2

My previous blog (available here) had outlined the manner in which funds are transferred from Government of India (GOI) to states and the need for a fresh approach in transferring funds in the context of changing centre-state relations. In May 2013, GOI had set up a six-member Committee headed by Raghuram Rajan (now RBI Governor) to develop a measure of development or (under) development. The Committee released a Composite Development Index in September 2013. This blog presents a summary of the index by laying out the objectives, methodology and finally the resultant shares of fiscal transfers from GOI to respective states.

Objective

There are two main objectives of the index. First is to propose a general method for allocating funds from GOI to the states based on both a state’s development “need” as well as its performance. Second, by categorizing states into relative degrees of (under) development- “least developed,” “less developed” and “relatively developed”- the index provides a benchmark by which GOI could consider offering additional forms of financial assistance to states that are particularly underdeveloped.

Methodology

As mentioned above, the index is a combination of a number of indicators representing a state’s “need,” based on geographical, income and human development indicators as well as its performance. While a state’s need was given a 75 percent weight, performance constituted 25 percent. The step by step methodology is given below:-

Step 1: Determining a State’s “Need”

The index measures need through a composite index of 10 indicators each assigned an equal weight. These were: (i) monthly per capita consumption expenditure, (ii) education, (iii) health, (iv) household amenities, (v) poverty rate, (vi) female literacy, (vii) percent of SC-ST population, (viii) urbanization rate, (viii) financial inclusion, and (x) connectivity.

Each state is assigned points based on their relative need, such that less developed states would rank higher on the index, and thereby get a larger share of allocations. Further, in order to ensure those particularly in need get a disproportionately higher share of resources, the underdevelopment scores are “squared” (see formula below).

Step 2: Accounting for State Size

In order to allocate more to underdeveloped states with large areas but small populations, weights were assigned to a state’s share in population (80 percent weightage) as well as its share in area (20 percent weightage).

The formula for need is thus given as/by:

(0.8* state’s population share + 0.2 * state’s area share)* [(under)development index for the state]2 

Step 3: Accounting for Performance

The committee recognized that need alone is an incomplete measure. A state’s ability to absorb and spend funds is affected by its administrative capacity. In a poorly governed state, additional resources may not reach a majority of the population nor have the desired impact. Further, if underdevelopment ensures a greater share of resources, looking at need alone could create a perverse incentive for states to not develop,. The index thus added a component of performance measured as the improvement in a states development index over time (i.e. a fall in underdevelopment).

The formula for performance is thus:

points to the state based on need * change in (under)development index for the state * performance weighing parameter

Step 4: Identifying the Constant – or the Basic Minimum

Finally, recognizing that all states require a basic minimum to meet fixed expenditures such as administrative costs, the committee assigned a fixed basic allocation for all states. Given that there are 28 states included in the index – the committee determined 8.4% (or 0.3%*28) as the fixed allocation.

The formula thus is: –

% share of a state to the total GOI allocation = 0.3% (i.e., the fixed allocation) + % share of a state based on need + % share of a state based on performance.

Comparison with other methodologies

The index has a number of interesting innovations when compared with previous methodologies.

First is the use of monthly per capita consumption expenditure (MPCE) as opposed to a state’s per capita income. The rationale for using MPCE data was that the value of the underdevelopment index for a state should represent the need of an average individual in the state which may or may not be related to the state’s per capita income. For instance, the presence of a large number of registered offices of corporations in a state like Maharashtra or Karnataka, may increase the states’ per capita income but average household consumption may still be low. While the use of MPCE was debated within the committee,[1] it is an interesting attempt to measure the income actually available for an individual household.

Second, while the focus on performance is not new (the Gadgil formula includes components of a state’s fiscal performance), the index gives a higher weightage to performance than some of the previous methodologies. In fact, an important feature of the formula used is that since performance is multiplied by need – the formula rewards underdeveloped states more for an improvement in the index.

Finally, the methodology attempts to introduce a system of proportionate but non-linear share of allocations. For instance, by giving proportionate to need the formula takes into account changing trends over time such that over time a state may get a greater or lesser share of allocations over time. Moreover, by “squaring” the points a state gets on the need criteria – the methodology ensures that those in greater “need” get a higher share of resources.

Findings

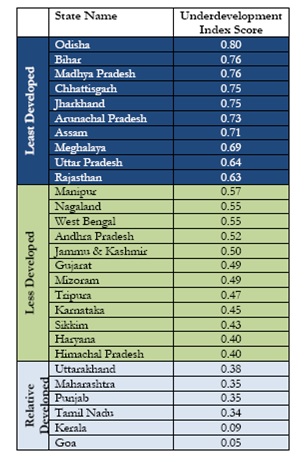
As mentioned earlier, the index ranks different states based on their relative degree of (under)development.[2] Accordingly, Odisha ranks 1 in terms of underdevelopment, followed by Bihar and Madhya Pradesh. In contrast, Goa, Kerala, Tamil Nadu, Punjab, Maharashtra and Uttarakhand are amongst the states which are relative more developed. Table 1 below outlines the rank of the different states based on the underdevelopment index. (See Table 1 for more details)

Table 1: Relative Degrees of Development: Ranking of States

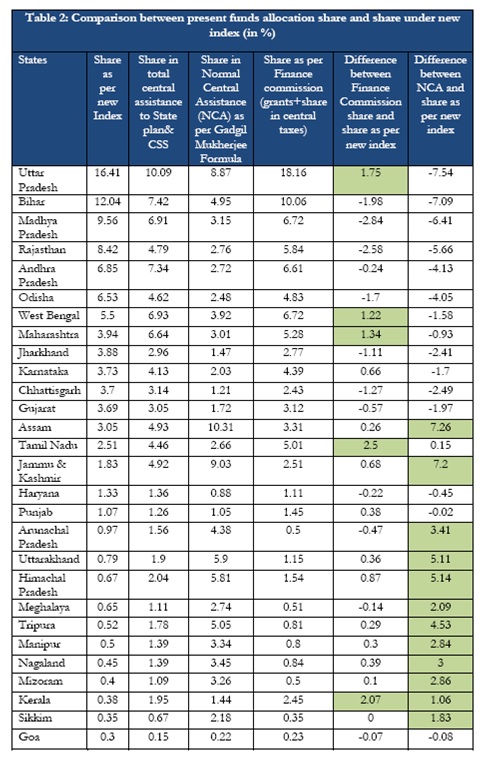
Table 2 shows the share of allocations for each state based on this index, which are then compared with allocations received through the Planning Commission and Finance Commission grants. On average, each state gets 3.6 percent of allocation of funds. However there are significant variations ranging from 0.3 percent to as high as 16.41 percent. In fact, according to this formula, 7 of the poorest states of the country—Bihar, Chhattisgarh, Jharkhand, Madhya Pradesh, Odisha, Rajasthan and Uttar Pradesh—will corner 60.56 per cent of the Central allocation under the new formula.

Relative to the Finance Commission formula, only five states, namely Uttar Pradesh, West Bengal, Maharashtra, Tamil Nadu and Kerala lose one percentage point or more of their share. In contrast, compared to the Gadgil Mukherjee Formula, 12 states lose more than 1 percentage point with 4 of them losing more than 5 percentage points.

As one can see, the index is based on a combination of factors – a state may do better in terms of one measure but not with respect to another. For instance, based on the index, Uttar Pradesh gets the highest share based on both need and performance, followed by Bihar in terms of need but not in terms of performance. Andhra Pradesh, on the other hand, gets a significantly high share based on performance but not as much on need. When measured in relation to population,  Arunachal Pradesh, Odisha, Chhattisgarh and Meghalaya, receive the highest based on need; whereas Rajasthan, Odisha, Jammu and Kashmir and Sikkim get the highest shares based on performance.

Conclusion

The findings of the index have raised a lot of debate. While some states stand to gain by this methodology, others such as Kerala, Goa, Sikkim and Assam, would lose in terms of a decreasing share of GOI allocations. The recommendations suggested in the Report are currently being examined by the Government.[3] The 14th Finance Commission, too, will be coming up with their report later in the year. Whether the composite development index methodology or some part of it will be used in determining the transfer of funds remains to be seen. If nothing else,the report has been successful in reigniting the debate on the need for a new criteria.

All information on the index is available online at: http://finmin.nic.in/reports/Report_CompDevState.pdf


[1] A note of dissent by Dr. Shaibal Gupta is available in Appendix 7 of the Report..

[2] States that score 0.6 and above on the index  were categorized as “least developed” states. States that score below 0.6 and above 0.4 as “less developed” states, while states that score below 0.4 as “relatively developed” states.

[3] PIB Release, Criteria for Central Assistance, 13/12/2013

Not The Straight & The Narrow

With a new government coming to power in the capital and National Elections round the corner; there have been a lot of discussion over issues of government. The question of why governments do not take some obvious steps to improve governance and implementation of public policy is central to this debate. This blog aims to provide an overview on the role cast out for the government in economic theory and how this can be extended and modified to understand government behaviour. In part, it also seeks to answer why social sector schemes and activities in the economic realm do not function the way they ought to.

One extends the meaning of the term government to incorporate the political class, bureaucracy and public sector enterprise. Classic public economic theory adopts the Paul Samuelson formulation where the government is seen as a socially benevolent planner,who attempts to achieve the best result for all parties involved. Intervention by the government in case of negative externalities like pollution, missing markets and for the provision of public goods justifies this perception. Given a socially benevolent government that derives its utility from working in the interest of the public and is only concerned with social welfare, intervention would perhaps lead to socially optimal outcomes. A government that maximizes welfare will intervene on issues based on poverty alleviation, access to healthcare and education. India like most governments around the world has introduced social sector schemes such as SSA, ICDS, MGNREGA and NRHM to name a few. These schemes however are riddled with systemic inefficiencies and misappropriation of funds.

Nature of the Government: An alternative view

According to Hindriks and Myles (2006), the assumption that the government has our best interests at heart providesa misleading picture of both reality and the benefits of public policy. In addition to the systemic realities that need to be understood, looking at levels of efficiency goes a long way towards analyzing government functioning. Intervention may not be efficient, especially when information is incomplete or restricted even between the different government agencies/ officials. Public choice economists are of the opinion that there is something known as government failure. There are endogenous reasons why government intervention does not achieve the desired effect.

This theory makes room for the possibility that the government is not a social welfare-maximizing, agency. Each member of the government, be it the politician, bureaucrat or mid level official, could be governed by self-interest. It may not be in their best interest to see that a scheme is implemented efficiently. The opportunity cost of being efficient may be too high. This theory purports that individuals in the government system are constrained by political and monetary considerations and there is an inherent conflict between the duties of the government and their individual personal interest.

Unlike the government, the private sector exploits the market directly to raise income and serve their self-interest. Individuals in the government mayalso want to raise their income from the market, but for them the process is not as straightforward. In fact, Niskanen (1968) suggests that individuals in the government derive their utility from non-pecuniary goods such as power, patronage and reputation. Possibly most government officials raise their incomes through patronage of some form.

Given this hypothesis, if the government has the same information set available as the unregulated economy and is managed by at least some non-benevolent officials, subject to their own set of constraints, it may fail to correct the market failure and may also introduce a new set of costs. Socially ideal interventions or outcomes may not be achieved as a result.

A non-benevolent government and corruption

This gains greater significance given the fact that corruption exists. In India alone, over the past five years we have seen scams coming to the fore; the CWG 2010, the 2G Spectrum Allocations, Coal Gate to name a few. Corruption in the system then emerges as a consequence of government officials using their power for personal gain and some players in the market endorsing it. In some ways a non-benevolent government has the potential to cause far more welfare loss than a monopolist. A government once formed has a monopoly over the force of coercion, which underlies every intervention, and such power, plausibly can be abused. With utility defined by non-pecuniary goods, their actions can impact societal outcomes negatively. The argument in consumer theory against tax collection has always been that it creates distortions (a deadweight loss) for society. Nevertheless one pays taxes in the belief that the government will use the collected revenue to provide necessary public goods and redistribute in the form of social sector schemes to reduce inequity. Welfare loss is exacerbated when the non- benevolent planner is the recipient of the taxpayers’ money. The scope for misuse is tremendous. The allocated resources move away from productive or equity based to rent seeking occupation. It adversely affects decisions in policy, which may no longer be governed by principles of equity, justice or efficiency. It is likely to be influenced by an interest group, who the officials may favour based on political considerations.

One of the most damaging forms of corruption is predatory regulation. In layman terms predatory regulation can be described as a method in which the government deliberately lays down very cumbersome regulatory rules that entrepreneurs/ the private sector have to pay bribes to wheedle out of. This of course raises the cost of productive activity and reduces efficiency and pushes some players out of the market. Cronyism as a phenomenon is not unheard of and predatory regulation favours its rise. The problem is more acute when several government officials autonomously create obstacles at every level so that each individual can collect a separate bribe. This has the effect of stunting economic growth and development. In the realm of public policy, corruptionleads to situations where beneficiaries of schemes are handpicked and the officials handing out the benefits receive some kickbacks. Public policy thereby suffers from several lacunae and fails to provide support on a need basis for alleviation.

Laffont (2000) offers any reader of development economic theory solace by stating that corruption is an endogenous phenomenon of society and zero corruption is observed nowhere. He suggests rather ironically that since it is observed nowhere, zero corruption is perhaps not optimal. He argues that as an economy continues to develop, new and complex systems and institutions are added, which open up more avenues for corruption. His inverted U shape hypothesis is: As an economy develops, opportunities for corruption increase, peak at a point and then begin to decline as an economy continues to develop further. He acknowledges that this relationship between corruption and development is only feasible if the government is benevolent.

One can extend this argument to include a government, which is primarily governed by self-interest. Presumably one of the goals of the political class is to get re-elected. As a country develops and more people are educated: there is a possibility that democracy will function the way it was visualized. Potentially, the people could direct the government towards making socially optimal decisions by holding them accountable for the policy decisions they take. Irrespective of the nature of the government (benevolent or governed by self interest), one could alter the constraints a government functions within to include consequences for not moving towards socially optimal schemes or results. It would be in their bestinterest that they put in place better deterrents for corruption even for the non-elected officials. An optimistic view hopes that then the opportunity cost of fighting corruption will decrease, given this new set of considerations.

References:

Hindriks, Jean, and Gareth D Myles. Intermediate Public Economics.The MIT Press, 2006

Niskanen, William. “The Peculiar Economics of Bureaucracy.” The American Economic Review, 1968

Laffont, J.J. ,Incentives and Political Economy, Oxford University Press,  2000

Conditionally Yours: Cash Transfers and School Attendance in Bihar

Student attendance in government schools in Bihar has been low for some time.[1] The Government of Bihar (GoB), with a view to boost attendance in its schools, decided that only those students who have at least 75% attendance in the period of April to September, would be eligible for various entitlements, such as money for uniforms, cycles and scholarship. The academic year 2012-13 was the first year in which this policy was introduced. A couple of our blog-posts last year had looked at the implementation of this policy at the school-level (see here and here). In a nutshell, there was much confusion on the ground about eligibility and distribution, with massive protests from parents and students. Overall, however, most teachers and administrators at the time claimed that such a condition on entitlements was necessary to get children to stay in school.

GoB decided to continue with this policy for academic year 2013-14 as well. All government schools were supposed to distribute cash to eligible students on the designated day, during December 16 to December 31, 2013, as decided by the District and/or Block officials. We conducted some preliminary field-work in Nalanda and Purnea to understand implementation at the school-level, given what we had seen last year. This blog post presents some of these initial findings.

Campaign Planning and Organisation

The biggest challenge faced last year was that schools did not have enough time to prepare the new beneficiary lists, communicate the new eligibility norms to parents, and hold distribution camps systematically.

In light of these problems, in 2013-14, Government Orders were issued by the State at the beginning of September 2013 to inform district and block administrations about the campaign to be held in December, as well as the preparation required for it. SSA devised specific formats in which beneficiary lists and demand for funds were to be submitted by schools to the block officials. These were given to headmasters by September, and were submitted at the block-level by early October in most cases. By November, several districts had prepared panchayat– or cluster-wise schedules for holding distribution camps. General information as well as campaign dates were published in newspapers across the state. Teachers and headmasters had also been instructed to give periodic information about norms to students and their parents.

Fund Flows

In 2012-13, there was huge rush to distribute funds in a campaign mode, and district administrations and schools had little time to prepare adequately.

This year, as with beneficiary lists, the demand for funds was submitted in the formats provided by SSA, and only the amount demanded was transferred to school bank accounts. This was crucial since last year lump-sum amounts were sent to schools according to the number of students enrolled rather than for those eligible. In cases where more money than required was sent, getting it back became an issue. District and state officials revealed that even by December 2013, not all schools had submitted their UCs or returned the money in whole. Such a problem is not expected to arise this year.

Distribution during Camps

The actual distribution of funds during camps held at schools has been much more streamlined than in the previous year. Most schools have distributed funds class-wise and at specific times, either in separate classrooms or at separate distribution counters set up within the school premises. This minimised chaos on the day of the distribution.

Monitoring

The local police was observed to be doing the rounds to maintain peace during the campaign. Block and cluster officials also came to monitor how camps were being conducted each day; however, this varied from block-to-block. The frequency of visits by district officials was much lower, close to negligible, at the time of observation in late December.

So broadly, one does see an improvement in the overall planning and management of this massive exercise. But this year also threw up quite a few challenges.

Confusion over Scholarships Norms and Data Collection

This year, until mid-December, there was much confusion over eligibility for the scholarships given by Department of Welfare. Generally, the scholarships are given to the children belonging to SC, ST, BC-1 and BC-II households. This year, however, there was some talk that more students would get the scholarships. Only in mid-November did the Bihar Cabinet pass a resolution that “General” category girls would also get scholarships. Incorrect interpretations of the Cabinet’s decisions in early December led to further chaos, as schools and parents really did not have clarity on who was eligible and who was not. Moreover, rather than the Welfare Department collecting scholarship beneficiary lists, SSA was asked to do that. All scholarship data was supposed to be submitted to the State by December 7, admittedly unrealistically. Given such delays in planning, there were clear adverse consequences on the fund flows for scholarships.

Problems in Fund Flows

Many schools reported not receiving money in time. One major reason cited for this is the staff shortage at the bank level as well as liquidity crunch at rural branches, leading to delays in transfers to schools. Additionally, given the confusion in December over scholarship norms and eligibility as mentioned earlier, funds for scholarship from the Department of Welfare have yet to reach a majority of schools.

Problems in Distribution during Camps

In almost all schools we visited, parents were observed protesting that their child should also be given the benefits. They all had prior knowledge about the 75% minimum attendance requirement, but their main bone of contention was that their child’s attendance had not been taken properly during the year. Teachers responded to this by telling parents that they should come and monitor attendance more often.

As per norm, vouchers or receipts indicating purchase of uniforms must be shown in order to receive the funds. However, this verification was not done systematically in each school and was left to the headmasters’ discretion. Our surveyors also reported that funds were distributed to children who did not have the requisite attendance rates – either to placate community members or out of fear of repercussion from influential local leaders.

The distribution of remaining funds (i.e., scholarships) would not be done via camps, but would be distributed by teachers in the school as and when funds are received.  It is not yet certain by when this distribution would be completed.

What is of most interest is that attendance registers on which this entire entitlement distribution is conducted, don’t receive much attention. District and State Officials categorically stated that there was no time to verify the registers or the beneficiary lists submitted amidst all the other tasks. Given the allegations of parents, complete lack of trust between parents and school officials, and increasing awareness levels among parents, it is imperative that the administration enforces better – and more regular – monitoring of attendance registers. Regular and open communication, through enforcing the mandatory weekly parent-teacher meetings and monthly SMC meetings, would go a long way in establishing this trust and creating confidence among parents to ensure their children come to school.


[1]It has been less than 60% these past few years according to ASER.

New ways of conducting field surveys: Computerised data collection and responsive survey design

In November, I went for a talk at NCAER on “Computerized data collection and the management of Survey Costs and Quality” by James Wagner and Nicole Kirgis from the University of Michigan. The abstract of the talk stated that it would cover topics like responsive survey design, survey biases and ‘paradata’. Now, usually, I am quite wary of talks where I don’t understand 50% of the abstract. However, this talk turned out to be quite interesting and useful.

As most of you know, a lot of the PAISA work that AI does involves extensive surveys of schools in our PAISA districts[1]. To carry out such large scale surveys, we mobilize a team of 35-50 local volunteers who visit around 140-150 schools in each district. This process involves a number of monitoring and rechecking exercises at various levels to ensure that data collection is of the highest quality. What I learnt from the talk was that responsive survey design and ‘paradata’ can help in ensuring that this aim is achieved more efficiently.

So what exactly is responsive survey design?

A responsive survey design pre-identifies a set of design features which can affect survey costs and statistics, monitors them through the process of data collection and makes changes to features of the survey if required. The survey administrator is able to respond to the data being collected while the survey is being carried out thereby ensuring that mistakes are being rectified almost simultaneously[2]. For example, if we are doing a survey of 100 individuals between the age of 15-50 and out of this 10 people are in the age group of 15-20. However, when we conduct the survey, only 5 of these people consent to do the survey. The results of this data, would thus, suffer from a non-response bias because of a higher non-response in a specific category, which would lead to biased estimates. Similar problems could arise for specific questions as well, for example if there is a question about maternal health, certain sections of the society may not be comfortable responding to them. In a standard survey design, the survey would first have to be completed, compiled, data entered and then analysed before the administrators would see such trends emerging, which would make responding to these problems difficult. To overcome these issues, survey administrators can employ a responsive survey design through computerized collection of data.  This design would allow the administrators to skip the compilation and data entry stage, and start analyzing the data straightaway.  The main survey team can then monitor the process from a distance and check if there are certain sections which are not responding. If required, the surveyors can be instructed to conduct more follow-ups with such groups and try and correct this problem[3].

Paradata, which is the administrative data about the survey such as the time taken to survey, number of visits required to complete the survey etc., can be very useful at this stage. When we use a computerized form of data collection, we can automatically monitor the surveyors on various parameters like how many times did the surveyors follow-up with the respondents? How much time did they spend on a survey? Whether they had to go back to an earlier question while administering the survey etc. Thus, we can actually check if the surveyors are making that extra effort towards the sub sample where non response is higher. Softwares such as SurveyTrak[4] are easy to use for this purpose and they automatically generate a lot of useful paradata for the survey administrators. These softwares also allow us to record how the surveyors are introducing themselves and asking questions. This can be very handy during training as we can identify volunteers who need more support.

Along with reducing survey biases, this design can cut down on the cost of transporting the survey tools and getting the data entered. This method would further allow a centralized monitoring of the survey with the survey data and the paradata being generated in real time. Furthermore, since this process does not have to go through a data entry phase, the analysis can start almost simultaneously with the data collection. This would allow analysts to notice certain trends while the survey is still in the field and conduct any follow-up/corrections on this, if required. Finally, it allows surveyors to communicate directly with the team and leave comments which can be useful during the analysis.

However, there are some limitations to this. Firstly, the volunteers would have to be equipped with either laptops or other mobile devices to carry out the survey which would result in increased costs. Secondly, training volunteers to use this technology may also require a longer time and monetary investment. Thirdly, the low penetration of internet facilities in India would slow down the process as there would be a time lag between collection and upload of data. Finally, replicating this model in a national survey in India could be difficult as the software would have to be available in multiple languages, which may increase the costs significantly.

Any organization looking to take up such survey models will have to consider these factors and ascertain which cost model works best for them. The total sample size and the length of the survey would be the most important factors while deciding whether this investment is viable. However, looking at the benefits involved, any survey design should definitely consider this approach before proceeding.


[1] Our PAISA reports can be found here http://www.accountabilityindia.in/paisa_states The PAISA states are Andhra Pradesh, Bihar, Himachal Pradesh, Rajasthan, Madhya Pradesh, and Maharashtra.

[2] Such a design is currently being used in the National Survey of Family Growth in USA. For more details check out Wagner et al, 2012, “Use of Paradata in a Responsive Design Framework to Manage a Field Data Collection”, available at http://www.jos.nu/Articles/abstract.asp?article=284477

[3] For more such applications and a stronger theoretical framework for this survey design check out- Groves, Robert M., and Steven Heeringa. 2006. “Responsive design for household surveys: tools for actively controlling survey errors and costs.” Available at www.isr.umich.edu/src/smp/Electronic%20Copies/127.pdf

[4] You can find out more details about the software at http://www.surveytrak.com/

Notes from the field: School Management Committees – Somebody Else’s Problem Field

“The Somebody Else’s Problem field is much simpler, more effective (in making something properly invisible) … This is because it relies on people’s natural predisposition not to see anything they don’t want to, weren’t expecting, or can’t explain.”

Douglas Adams, The Hitchhiker’s Guide to the Galaxy

Three years ago, the Right to Free and Compulsory Education (RTE) Act[1] placed significant responsibilities on elected parents of students, representatives from the school staff (including the headmaster) and the community when they created School Management Committees[2] (SMCs) in every government school.

These committees were and continue to be created with the intention of devolving school-level planning, management, and expenditure of grants to the community level. As part of their responsibilities, each year SMCs create a School Development Plan (SDP) to guide school level expenditure. This plan also becomes the basis on which district and state administrations plan for elementary education that year.

However, anecdotes from the field suggest that SMCs are not functioning according to the ideals met in the RTE Act. Conversations with headmasters and the SSA administration have revealed that one of the biggest problems is that parents are not willing to participate in school level planning. SMC members do not attend trainings held by the SSA administration, are often absent from meetings in the school and are unwilling to participate in creating SDPs. This post is an attempt to understand some of the problems that make SMCs unwilling to participate in the school level planning process, based on recent field-visits to Himachal Pradesh and Rajasthan.

Few incentives to plan

During our last visit to Rajasthan, with a journalist who wanted to learn more about the PAISA study, a headmaster told us that the SDP had not helped them get the facilities they needed for the school. The headmaster had been repeatedly recording requests in the SDP to raise the level of the school’s playground to match that of the road that ran outside. For the last two years, the requests were ignored; and, like clockwork, the rains came and flooded the school’s premises every year, making it hard for students and teachers to get to their classrooms. When asked what he could do about it, the headmaster said that he would put the request in their Plan again the next year, but try first to ask the Panchayat for help.

Few incentives to provide feedback

Minutes later, the SMC President who was seated in the same room, and had been intently listening to our conversation, was asked what he thought of the SMCs ability to make a difference. At that moment, he looked nervously at the headmaster and assured us that things were going rather well; that the SMC members met regularly and worked towards  a sound SDP, based on which the school’s requests were met. Considering the school’s playground was a mud track several inches lower than the concrete road that ran outside, it became apparent that the headmaster was telling us the truth about SDP. The SMC president on the other hand, gave us a version of reality that was easier to digest – that the ideals enshrined in the Act have been met. However, in a situation like this one, unless there is an incentive to evaluate and verify conflicting stories on the ground, it is hard to assess what the truth really is.

Few incentives to evaluate

In Himachal Pradesh, a State-level education official told to us that SDPs were neither evaluated nor collated at the State-level. Moreover, a district-level official admitted that SMCs’ plans rarely find their way past the block office to the district office. The reason was that the State and district administration did not have the capacity or the need to take into consideration the nuances in the SDP. To meet the needs of a centralised planning system, which allocated resources based on aggregated reports, the State needed to use DISE[3] data, which neither prioritises the urgent needs of the schools, nor offers the granularity that SDPs promise. The official was aware that if the Plans continued to be overlooked, it would eventually dissuade community members from planning for the school altogether, but did not know what he could do about it at present.

Perhaps the first step to incentivise SMCs to participate in school-level planning is to admit that not all SMCs have been able to make plans, and that not all of these plans have been able to reflect the needs of the schools. Moreover, even when plans have reflected the needs of the school, it has been difficult for local-level administrations to incorporate the school’s plans into a rigid planning system. However, recording feedback from all the levels in the administration and the community is harder to do than tracking the lacunae in infrastructure or teaching staff at the school level.

When presented with the challenge of reporting progress on meeting policy directives, SMCs should be able to report to Block Officials on the extent to which they are prepared or willing to work with a school. Blocks should be able to report to Districts which of their schools need more support or training.  Districts should be able to tell the State which blocks require greater financial and physical assistance, and finally, the State can decide with the Centre if they truly are closer to the ideals enshrined in the RTE Act.

Unless there is an incentive to report on the nuances of community participation (or lack thereof) SMCs will soon slip under, what Douglas Adams effectively called, ‘The Somebody Else’s Problem field.’


[1] This link leads to the RTE Act http://mhrd.gov.in/sites/upload_files/mhrd/files/rte.pdf

[2] This leads to a blog post that provides more information about SMCs, their functions and powers: http://www.accountabilityindia.in/accountabilityblog/2510-empowering-schools-and-school-management and this leads to State specific rules on SMCs: http://mhrd.gov.in/smc

[3] District Information System for Education (DISE) is a computerised management information system, with the school as the unit of data collection. Every year, headmasters fill in a standardised format that feeds into the DISE database available here: http://dise.in/index.htm

MPLADS – Learnings and stumbling blocks.

Those familiar with the Indian political system will know of the roles and responsibilities of a member of parliament (MP). What do they do? If we were to go solely by news reports, hair-pulling, wielding microphones as weapons and occasional rioting form the bulk of the MP’s activity in parliament. However, MP’s are primarily known to don the part of a legislator- elected to debate & discuss issues of national importance, serve on committees and pass legislations of national relevance. The initiation of certain schemes, however, led to the coalescing of their duty as a legislator and that of performing executive functions. The passing of the Members of Parliament-Local Area Development Scheme (MPLADS) was such a decision. Now in its twentieth year, the scheme provides MPs a chance to not only route public money in areas that they believe need assistance in their constituency, but also expands their role as representatives of the people. Before delving into the controversial areas of the scheme, this blog tries to explore what the MPLADS is and what it aims to achieve.

The scheme, announced initially in 1993, began with the objective of creating sound and durable assets considered essential by the MPs for the development of their constituency. MPLADS laid the foundation for the type of works/projects that could be taken up by an MP with the aim of directing infrastructural development. This agenda began with the idea of providing basic amenities, such as drinking water or the construction of schools and roads. During the inception of the scheme, Rs 5 lakh was allocated to each MP to undertake certain projects. Between 1993 and 2013, the amount allocated has grown exponentially to reach Rs 5 crore[1]-, raising the annual expenditures from Rs 37.8 crore[2] when it began to Rs 3950 crore currently[3]. The increase in both entitlements as well as expenditures is staggering. MPs, of course, play the most important role within this framework. Not only do they recommend projects in and around their constituency, they also have the primary task of deciding the type of project, its length and required budget.

Financial devolution and monitoring

The Planning Commission has two ways in which funds are sent out: Central Assistance to State Plans and Grants through Central ministries. The MPLADS come under the former- as a Plan scheme where funds are sent out under the Special Central Assistance to States as Grant-in-Aids. The financial entitlement is sent in two instalments (Rs 2.5 crore each) by the Central Government, under the MOSPI (Ministry of Statistics and Programme Implementation) to the District Authority (Nodal District), first at the beginning of the financial year, and the rest after Utilization Certificates/Audit Certificates have been sent in by the District Authority. The funds that are released by the Central Government are non-lapsable and can be carried forward, and can be used by the next elected MP.

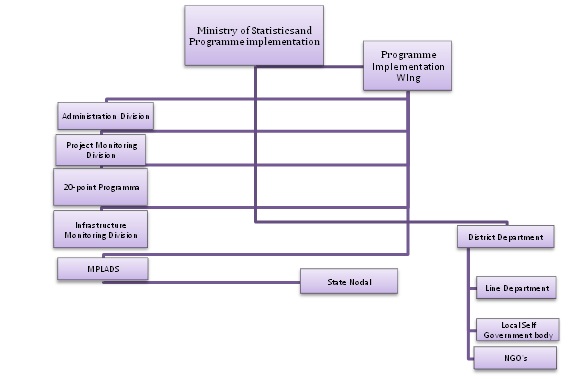
It is under the MOSPI that the monitoring of the MPLADS in each state is conducted. A look at the vertical structure of authority can be seen below.  While the Programme Implementation Wing coordinates and ensures the functioning of the scheme, with evaluation & assessment inputs from the State Nodal Department,  it is the District Authorities (usually the District Collector/District Magistrate/Deputy Commissioner of the area) that are at the forefront when it comes to monitoring the project closely, releasing the funds to implementing agencies on the ground, making sure all important reports are sent in, and supervising the works as well as submitting monthly progress reports[4]. A look at the monitoring and financial devolution of the scheme is given below.

Fig 1. Monitoring structure of MPLADS

Source: Details from the MPLADS Guidelines Report, 2012

Challenges and reflections

Some examples of successful projects (where projects have been completed) under MPLADS are those that have seen continuous participation from the MP at every level of its implementation. The completion of thousands of projects is a testament that MPs, implementing agencies, District Authorities and State Nodal Offices are following the books to some extent. Some states, primarily in the North-East and in the Northern regions (Punjab, Himachal Pradesh) have a high fund utilisation rate (view the total funds released, state-wise, here). In MOSPI’s latest report (2011-2012), it was stated that the total expenditure since the scheme was initiated, ran up to the tune of Rs. 24180.25 crore, coming to almost 89.4% expenditure incurred over the total released amount.

The implementation of this scheme (or lack, thereof) has rendered it in popular media as unworthy of continuously receiving large amounts of public money. News reports on the scheme focus largely on the various scams that are brimming. However, some steps have been taken recently, to reassess the monitoring and implementation of these projects. Last year, MOSPI announced the co-opting of MGNREGA works with MPLADS[5] – a positive step in ensuring that technical and labour support be given once the project has commenced. In addition to generating income and building infrastructure for the community[6], this decision also involves Zila Panchayats to provide a stamp of approval before the project is passed at the MOSPI level. Steps towards creating more transparency (besides having a one-sided progress report from the District Authority) have also begun. Back in 2011, MOSPI sent out feelers that they wanted to hire an independent firm that will inspect completed projects (similar to a social audit) to ensure the quality of the materials as well as the upkeep of previously completed projects[7]. With no official decision taken yet, the monitoring of the scheme remains ambiguous and does not exactly inspire confidence. Even a preliminary look will show that the scheme is riddled with challenges.

Initial planning and recommendations

As mentioned previously, there are vertical processes within MPLADS that involves MOSPI, District Authorities, MPs, local political entities and NGOs. Plans and works are recommended by MPs and sanctioned by the District Authority. It is only recently that panchayats at the local level had a say in these recommendations. To what extent are their recommendations given heed? Is there any community participation at all? Processes on how and where the funds should be utilized have been listed down under the Ministry’s Guidelines, but little or no information is available on where specifically the funds are allocated.  How are plans to utilise funds made? Specific details on the coverage of the project, whether the project is feasible and the maintenance of the assets created is entirely missing.

Allocation and use of funds

As with the planning process, the details regarding use of funds is minimal. Which MP has spent what, recommendations by the local governments, months taken to complete the project, and with which implementing agency this was done, are nowhere to be seen on the government website. Overall allocations and expenditures at the state level form the majority of the data available. While the overall expenditure on MPLADS since its inception displays an extremely high percentage, the disparity across states is obvious (higher number of MPs = higher allocations per state). UP comes up as having the highest amount released by the government (which isn’t a surprise, considering the sheer number of MP’s[8] from the state). Delhi, Tamil Nadu and Mizoram have some of the highest utilization rates. Delays in payment from the Centre and time taken to send approvals also lead to projects either being carried forward to the next year, or them being shelved. Once these funds are received, the level of discretion given to the MP can instead lead to skewed development between districts, or the funds in some cases simply lie dormant in situations where re-elected MPs do not utilize them (to know which recurring MPs have not spent funds, click here). It is difficult to point out any one reason on why MPs do not channelize the funds into projects.

Mismanagement and mistrust

The Administrative Reforms commission’s 4th Report titled ‘Ethics in Governance’ (see here) a few years ago recommended that the MPLADS scheme be abolished. This was mentioned under the issue of using ‘Office for Profit’ and conflict of interest. MPLADS have been under criticism for being unconstitutional since most of the projects they undertake are already part of state lists and subsequent budgets, so what is the rationale of utilizing central funds for such a scheme? In 2010, the Supreme Court came out with a judgment that the MPLADS is NOT unconstitutional because of its inherent goal towards serving the public[9]. However, the lack of impact assessments and publically available audit details makes the scheme even more ambiguous.  The CAG had once described the scheme as being the ‘most irregular and corrupt’ and of being ‘misused by MP’s for vested political interests’[10], and Yamini Aiyar’s earlier blog[11] also suggests that this scheme obfuscates accountability. The level of mistrust that this scheme has already generated in the last 20 years across party lines and civil society groups displays the level of suspicion that is now synonymous with the scheme.

The MPLADS is a perfect example of a scheme tailor-made for the elected members of parliament. The number of issues that remain to be addressed in the scheme, however, may possibly lead to its downfall. In addition to the widespread fear that government schemes are being used to channelize private profit, challenges like lack of community participation and conflict of interest still plague the initiative. Addressing the above through a thorough investigation of its impact will be useful for re-assessing the scheme’s feasibility and future course of action.


[1]NDTV. July 2011. Cabinet raises MPLAD fund from Rs 2 crore to Rs 5 crore. Accessible at http://www.ndtv.com/article/india/cabinet-raises-mplad-fund-from-rs-2-crore-to-rs-5-crore-117348 

[2] Annual Report 2010-2011. http://mplads.nic.in/MPLADS-ENGLISH-AR-2010-11.PDF

[3] MPLADS Guidelines 2012. http://mplads.nic.in/mplads–guidelines-eng-2012.pdf

[4] Ibid.

[5] Press Information Bureau announcement. Convergence of MGNREGA with MPLADs. January, 2012.

[6] The Economic Times. http://articles.economictimes.indiatimes.com/2012-01-23/news/30655749_1_mplad-scheme-mplads-funds-durable-assets

[7] Zee news. Independent agency to review MPLAD http://zeenews.india.com/exclusive/independent-agency-to-review-mplad_3381.html

[8] Fifteenth Lok Sabha state-wise list. http://164.100.47.132/LssNew/Members/Statewiselist.aspx

[9] The Hindu.  http://www.thehindu.com/news/national/nothing-unconstitutional-about-mplad-scheme-rules-supreme-court/article423882.ece

[10]Frontline. The Case against MPLADS. http://www.frontline.in/static/html/fl2122/stories/20041105005802400.htm

[11] Yamini Aiyar. SC Upholds MPLADs Scheme: A Questionable Judgement?- http://www.accountabilityindia.in/accountabilityblog/1184-sc-upholds-mplads-scheme-questionable-judgement

Of Backwardness and Special Status- Part 1

The last few months has seen a clamour from states including Odisha and Bihar for receiving “Special Category Status” (SCS). Meanwhile, last week a panel headed by Raghuram Rajan released a new index of “underdevelopment” to determine central fiscal assistance to states. The index ranked Odisha and Bihar amongst the least developed states. .  What do these criteria mean? What are the benefits of SCS? How is the new underdevelopment index different? This blog attempts to lay out the changing nature of centre – state finances through an analysis of both SCS and the new underdevelopment index. The blog is divided into 2 parts. The first part attempts to detail the definition of SCS in the context of the changing nature of centre-state finances. The second part discusses the new underdevelopment index for addressing development needs.

Background

The concept of SCS was first introduced in 1969 when the Fifth Finance Commission sought to provide historically and geographically disadvantaged states greater fiscal assistance. The idea being – some states are unable to mobilize adequate resources for development and thus require special attention. The decision to grant SCS rests with the National Development Council[1] an advisory body to the Planning Commission and is based on a certain set of indicators. These are: hilly and difficult terrain, low population density, high proportion of tribal population, strategic location along borders with neighbouring countries, economic and infrastructure backwardness and non-viable nature of state finances. Starting with only three states in 1969- Assam, Nagaland and Jammu there are currently 11 SCS including all eight north-eastern states, Himachal Pradesh, Jammu and Kashmir and Uttarakhand (the last to be added in 2001).

Before getting into the benefits of the SCS it would be important to understand the nature of Centre-state financing.

Central State Financing

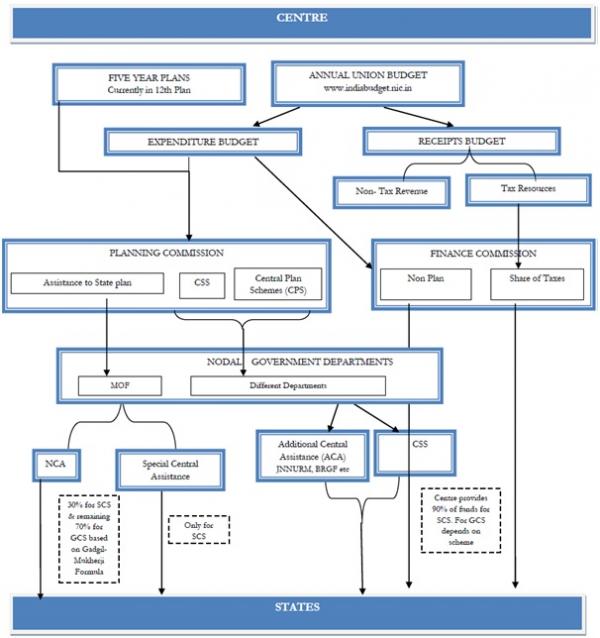
Transfer of funds from centre to states are determined by two main bodies:- the Finance commission and the Planning commission. (See graph below)

Finance Commission

The Finance commission is responsible for devolving central tax revenues to different states. The 13th FC set aside 32% of central tax revenue for states. In 2011-12, this amounted to Rs. 2.5 lakh crores making it the largest transfer (57%) to states. In addition, the FC recommends the transfer of non-plan grants and loans to states. These can be for state-specific needs such as disaster relief, building of roads and bridges, delivery of justice etc.

Planning Commission

Broadly, the Planning Commission transfers funds to states in two ways. These are:-

a) Central Assistance to State Plans which includes Normal Central Assistance (NCA) or unconditional block grants to States to finance their own plans; Additional Central Assistance (ACA), usually in the form of assistance for schemes such as Jawaharlal Nehru National Urban Renewal Mission (JNNURM), National Social Assistance Programme (NSAP), Backward Regions Grant Fund (BRGF) etc (Details on JNNURM and NSAP are available here insert hyperlink) and Special Assistance including grants for Border Areas,  North Eastern Council, Bodoland Territorial Council etc

b) Grants through Central ministries in accordance with guidelines of various Centrally Sponsored Schemes and Central Plan Schemes such as Sarva Shiksha Abhiyan (SSA), National Rural Health Mission (NRHM), Indira Awas Yojana (IAY), Mahatma Gandhi National Rural Employment Guarantee Scheme (MGNREGS) etc.

Benefits of SCS

The main benefit for SCS comes from grants determined by the Planning Commission.

  • First, out of the total funds for NCA (excluding externally aided programs), 30 percent of the funds are blocked for SCS. The remaining 70 percent are given to GCS on the basis of the Gadgil-Mukherji Formula[2]. Earlier, the type of funding was very different with SCS receiving 90% grants and 10% loans whilst GCS receiving only 30% grants. However, following the 12th FC recommendation that centre only gives loans, the 90:10 formula for SCS has been restricted to only CSS.
  • Second, SCS receive specific assistance addressing features like hill areas, tribal sub-plans and border areas as well as concessions in excise, custom duties and tax breaks.
  • Finally, with respect to Centrally Sponsored Schemes, if there is a sharing ratio between Centre and states, for SCS, the Centre provides 90 percent of the funds. For example, for SSA while GCS have a sharing ratio of 65:35, for SCS it would be 90:10.

Changing Nature of Centre-State Financing

Over time, there has been decreasing relevance of NCA funds in terms of the total resources transferred to states from the centre.

First, while the number of states has increased from 3 to 11 between 1969 and now, the quota of 30 percent has remained the same. As a result over time the proportion of funds received by each SCS has gone down.

The NDC decided in 1969 that Central Assistance to States for their plans should be unconditional block grants to enable them to plan in accordance with needs and scheme based support should be restricted to 1/6th of the untied assistance. Despite this, NCA transfers as a proportion of total plan transfers has fallen from 35 percent in the Ninth Five Year Plan to only 10 percent in the Eleventh Five Year Plan. In 2011-12, NCA constituted only 8.2 percent of total plan transfers. In fact, as a proportion of total resources transferred to states, it was a mere 3.8 percent. [3]

In contrast, recent years has seen a dramatic increase in the share of funds transferred through CSS. As a proportion of the total plan transfers, share of CSS has risen from 25 percent during the 9th Five Year Plan to over 50 percent during the 11th Five Year Plan.[4] As mentioned earlier, a large portion of the ACA too is tied to schemes such as JNNURM, BRGF, NSAP etc.

Add to that the fact that a large proportion of funds for CSS are transferred directly to state implementing societies thereby bypassing the state treasury. In 2007-08, Rs. 53014 crores were transferred directly to implementing societies. In 2013-14, this has tripled to Rs. 164195 crores.[5]

Emphasis on a new approach for addressing backwardness

While the SCS has been important in addressing historical disadvantages of many states, the above discussion highlights that the nature of centre-state financing has moved from the traditional approach of providing unconditional grants to a more schematic based approach in addressing fiscal imbalances and backwardness. In such a context, and given that the SCS is limited by its specific criteria[6], backward states such as Bihar, Odisha and Jharkhand have had to rely on additional resources from the centre through the scheme route.[7] These however tend to be based partially on states bargaining powers, as well as, the specific guidelines for each CSS. For instance under NRHM, a set of High Focus states receive the largest share of resources. Under SSA, there is no such specific criteria and allocation is based on a combination of requirements based on plans, past performance as well as availability of funds. Given these changes, recent years has witnessed a growing debate on the need to address regional disparity through a fresh approach in transferring funds to states. In September 2013, an expert committee headed by Raghuram Rajan developed a new index for “underdevelopment”.  While the underdevelopment index is not a replacement of the SCS, it attempts to develop a more holistic approach of underdevelopment taking into account socio-economic indicators to determine need and also performance. Part 2 of the blog will discuss the index in more detail.


[1] The NDC comprises the Prime Minister, Union Ministers, Chief Ministers and members of the Planning Commission.

[2] The formula gives weight to population (60%), per capita income (25%), fiscal performance (7.5%) and special problems (7.5%).

[3] Ministry of Finance (2013) – Report of the Commitee for Evolving A Composite Development Index of States

[4] Bhattacharjee, G (2013), “Special Category Status: Will it Actually Benefit Bihar”, Economic and Political Weekly, Vol XLVII No. 18, May 2013 and Expenditure Budget, Vol 1 available online at: www.indiabudget.nic.in

[5] www.indiabudget.nic.in

[6] An inter-ministry group in 2012 found that Bihar did not meet all the criteria for receiving the status.

[7] A cabinet committee recently approved Rs. 12,000 crores as special plan under the BRGF for Bihar

Achieving Total Sanitation: Measuring the Problem

With elections around the corner an issue that seems to have caught everyone’s attention is the poor state of sanitation in India. According to Census 2011 findings, only 30.7 percent of rural households have access to sanitation. Given the current unit cost of construction, this would entail over 1 lakh crores of additional expenditure (19 times the expenditure incurred from 1999-2011) to cover 2011 household levels. Construction aside, usage figures are even more dismal. A UNICEF and WHO report[1] found that in 2008 a mere 21 percent of rural India uses improved sanitation facilities[2].

While the Government of India (GOI) has taken some important steps in trying to address the problem of rural sanitation (emphasising the need to focus on community outcomes through the launch of Nirmal Bharat Abhiyan (NBA); a significant 425 percent increase in allocations for the rural sanitation sector in the 12th Five Year Plan; enhancing allocations for Information, Education and Communication (IEC) etc), one the biggest challenges in the rural sanitation sector is that we still don’t have a clear idea on what are we measuring.

Let me explain what I mean.

The first step in building an outcomes based delivery system for sanitation (which the NBA hopes to achieve), is the need to develop a database on outcomes. In other words, it needs a process of assessing needs on the ground, setting targets and measuring achievement.

However, while the concept of Open Defecation Free (ODF) communities as an objective has been part of the guidelines since the start of Total Sanitation Campaign (TSC)[3] in 1999, the only estimation of usage came in 2008 with the introduction of the Nirmal Gram Puraskar- a financial reward given to Gram Panchayats (GPs) for achieving Open Defecation Free (ODF) status. The NGP guidelines defined ODF as the complete elimination of open defecation within the jurisdiction of a Gram Panchayat. In other words – all members of a GP have access to and are using a sanitation facility.

The launch of the NGP portal was thus the first step in developing a database on outcomes. However, a closer look at the NGP database points towards issues of data quality. First determining the accuracy of ODF status requires multiple checks and verification – a point realised by GOI itself when NGP tightened its verification process and found a decrease in the number of NGPs awarded (the number dropped to 4556 in 2009, 2808 in 2010 and 2857 in 2011.) Second, an effective database requires real-time monitoring. In the absence of efforts to build capacity at the local level and ensure regular monitoring and assessment, the sustainability of the ODF status remains a question. For instance, a recent report of the Planning Commission[4] found that 13.8 percent households of GPs awarded with the NGP had some of their family members still resorting to open defecation.

In the absence of reliable data on usage, objectives under the rural sanitation programme have been defined in two ways:- a) The progress in construction of toilets based on annual project targets determined on the basis of Annual Project Implementation Plans (APIPs) and, b)The number of toilets built in comparison with the total number of households. Both measures however have their problems. While APIPs are meant to be an aggregation of demand based on needs assessed by GPs, in actuality they reflect annual targets for toilet construction. Given that these targets can change yearly, the result is the lack of a uniform and standardized measure of “achievement”. For instance: while the Project Objectives for Kerala were 10.7 lakh household toilets, the achievement showed 11.3 lakh toilets constructed. In essence the achievement rate would be over 100 percent. But according to Census figures for 2011, there are still 2.8 lakh households without access to toilets.

Similarly, even in terms of measuring against number of households, NBA’s current design does not have a mechanism to measure increase or decrease in rural populations or the possibility of slip-back habitations or toilets no longer in existence or defunct. For instance, while the number of households has increased by 2.96 crores between Census 2001 and Census 2011, the NBA achievement rates continue to benchmark themselves against Census 2001 household numbers, resulting in an overestimation of achievement at close to 80 percent!! (Remember Census 2011 found only 30.7 households have toilets).  (See Table 1 for more details)

Recognising that increasing population could be a factor driving these differences, the TSC achievement rate was normalised for rural household numbers for 2011. The results suggest that when the new household numbers are used, the achievement rate drops significantly, however, there continues to be a difference between the two rates of achievement. For details on methodology see here.

Table 1: Differences in coverage

States Census 2011 (toilet coverage) TSC reported physical achievement  (based o 2001 household numbers TSC with new population denominator
Andhra Pradesh 32.2 75.9 67.6
Bihar 17.6 38.7 28.9
Chhattisgarh 14.5 60.2 46.1
Gujarat 33 95.4 83
Haryana 56.1 100 82.8
Himachal Pradesh 66.6 100 83.7
Jharkhand 7.6 47.4 38.5
Karnataka 28.4 73.9 62.7
Kerala 93.2 100 120.7
Madhya Pradesh 13.1 85.1 62.1
Maharashtra 38 78 65.9
Odisha 14.1 58.9 49.1
Punjab 70.4 77.5 64.9
Rajasthan 19.6 63.6 48
Tamil Nadu 23.2 96.7 83.6
Uttar Pradesh 21.8 96.7 78.1

Source: Census(2011), Availability and Type of Latrine Facility: 2001-2011, available online at: http://www.censusindia.gov.in/2011census/hlo/Data_sheet/India/Latrine.pdf; and calculated from TSC Portal, Physical Report, Year-wise percentage achievement (including census), available online at: http://tsc.gov.in/tsc/Report/Physical/RptPerwiseAchCensus_net.aspx?id=PHY

To add to the confusion, NBA has launched a Baseline survey in 2012. This survey is meant to provide revised (and hopefully more comprehensive) data on coverage and includes parameters such as functional and defunct toilets. However, a comparison of states which have nearly completed the survey with Census 2011 still points to differences in assessment numbers. (See Table 2).  Further, Baseline 2012 still does not give any estimate on toilet usage.

Table 2: Comparison with Baseline Survey 2012

State Name %age of baseline survey entries complete %age of households not having toilets according to Baseline survey 2012 %age of households not having toilets according to Census 2011
Jharkhand 100 76.21 92.4
Kerala 100 5.32 6.8
Nagaland 100 50.22 30.8
Punjab 100 24.83 29.6
Rajasthan 100 72.70 80.4
Karnataka 99.93 65.03 71.6
Maharashtra 99.79 51.97 62
Madhya Pradesh 99.7 73.72 86.9
Uttar Pradesh 99.61 65.04 78.2
Chhattisgarh 99.03 60.56 85.5

Source: TSC Portal, Baseline Survey 2012, -Complete Entry Status. Available online at: http://tsc.nic.in/BLS2012/Report/Rpt_NBAS2012DataEntry.aspx Accessed on 17.07.2013, and Census (2011), Availability and Type of Latrine Facility: 2001-2011, available online at: http://www.censusindia.gov.in/2011census/hlo/Data_sheet/India/Latrine.pdf

The analysis above highlights that while policies may be designed in a manner which wants to focus on outcomes, in the absence of set benchmarks on outcomes, it is hard to imagine how these policies will be able to address the problem of rural sanitation. If total sanitation is our goal – let’s start with at least finding an accurate measure of determining the problem!


[1] UNICEF and WHO(2012), “Progress on Drinking Water and Sanitation”. Available online at: www.unicef.org/media/files/JMPreport2012.pdf Accessed on: 12.08.2013

[2]The JMP defines “improved sanitation” as facilities that are used and ensure hygienic separation of human excreta from human contact. They include a flush or pour-flush toilet/ latrine to piped sewer system, septic tank, pit latrine, ventilated improved pit (VIP) latrine; a pit latrine with slab; and a composting toilet.

[3] The TSC has now been rechristened the Nirmal Bharat Abhiyan

[4]Planning Evaluation Organisation (2013) – Evaluation Study on Total Sanitation Campaign.

Notes from the field: The trouble with transport

Monitoring PAISA surveys is particularly interesting in Himachal Pradesh’s Kangra district due to the challenges posed to get to schools. Some schools are located close to village centers and on concrete roads, and are easy to find. Others are further away, off mud tracks, between two village centres and harder to find. Yet others are built on hills, they require a steep climb, several nervous leaps over brimming streams and wild scrambling to get to.

This blog is about the latter kind of school, one that has nine students, two teachers (one of whom was the acting headmaster) and a cook – at maximum strength. The school had two classrooms, a neat kitchen and newly constructed toilets and took us a fair amount of effort to get to. The headmaster was surprised to see us (my colleague and I had reached the school close to the end of the school-day); he thought we from education department. When we told him that we weren’t, he looked a little more surprised.

The last time he recalled an official from the block or district visiting his school was four years ago. He said he understood the lack of visitors, as he himself hiked three kilometres up to school and down every day to get to the village’s closest bus stop. The bus stop was still several kilometres away from the block office and even further from the district headquarters, making a visit to the school a day-long affair. However, the School Management Committee (SMC), visited the school frequently. The headmaster relied on them to help with smaller projects, such as clearing out brambles that grew around the school and piling stones on the fringes of the school building to create a makeshift boundary wall – the only thing between the building and a quick tumble down the hill.

The headmaster told us that this distance made it hard for him to procure things for the school. They had recently bought a bookshelf, and he had to pay an additional fee for labourers to carry the rack up to the school. Costs for procurement increased by 10% for the school and the headmaster was reluctant to explain how he smoothed over the arrears.

The monsoons made getting to the school especially difficult. There were two approaches to the school, and both required crossing streams. When it rained, the streams swelled, making it dangerous for children to get to the school. Unfortunately, schools in Kangra stayed shut during summer and reopened just in time for the monsoons. On days when the rain was relentless, neither the headmaster nor the school’s students attended the school.

The visit left me thinking about whether the education planning system can be decentralised to an extent that would suit the specific needs of a school like this one. Procurement, administration and even daily travel seemed problematic to an extent that the staff, community and students of the school were best suited to understand and address. Strong community involvement during the absence of block and district support and supervision seemed essential to the school’s functioning.

Is it possible to create a strong local planning system that truly understands every school’s needs? If not, perhaps science will make greater strides and in the future, we can beam bookshelves into schools.

Until then, “Those who believe in telekinetics, raise my hand.” (Kurt Vonnegut)