Is the ban on private tutoring by school teachers justified?

The last two decades have seen a tremendous expansion of the government school system (and probably an even more rapid expansion of private schools) in India. Unfortunately, learning levels have not shown any such improvement, and are, more worryingly, showing a decline[1].  Researchers and policy makers are struggling to find ways to improve learning levels in a systemic way. It is in this context, the phenomenon of private tuitions has started getting some attention[2].

An important question that emerges here is – who provides these private tuitions? In many instances, it is the school teacher who also provides private coaching or tuitions after school hours. This creates a potential distortion in teacher incentives. It is quite possible for these teachers to finish only part of the syllabus in the classroom and generate demand for their own tuitions outside the classroom. As a result, the students who don’t demand these tuitions (because, say, they can’t afford it) are clearly worse-off.

In an interesting new paper, Seema Jayachandran tests precisely this hypothesis using survey and test scores data from secondary school students in Nepal, to empirically assess the effects of tutoring on student achievement.

Education in Nepal is divided into primary school (grades 1 to 5), lower secondary school (grades 6 to 8) and secondary school (grades 9 to 10). At the end of grade 10, students appear for national school leaving certificate (SLC) exams, which must be cleared to continue further education.  Given the importance of this exam for furthering education, tutoring is common at secondary level, especially for Math, Science and English, the subjects where the pass rates are quite low. Tutoring is provided by school teachers post school-hours, as well as by others. But the share of these other third-party providers is quite low.

The author tests a number of hypotheses in her paper[3]. The first is that the teachers who offer tuitions, cover less material during the school day in order to generate demand for their tutoring.  She finds that offering tuitions make government school teachers 7.1 percentage points less likely to teach for the whole period compared to their counterparts in private schools.  Second, what consequences does this have for student test performance? Not surprisingly, the results reported in the paper suggest that offering tuition reduces the passing rate by 10 percentage points in government schools as compared to private schools.  Third, the author shows that household wealth is the most important predictor of higher take-up of tutoring. Thus, the existence of tutoring by government school teachers is likely to be most harmful for the poorest students, which is what the evidence seems to suggest.

The implications of this finding are quite clear: discouraging teachers from tutoring can actually be beneficial and can improve student’s academic performance. This is what the Right to Education Act (RTE) has done in India. The Act clearly states that, “no teacher shall engage himself or herself in private tuition or private teaching activity”. But do we know how well is this implemented on the ground?


[1] See ASER Reports for various years, available on http://www.asercentre.org/#qd70g

[2] There is some literature on prevalence on private tuitions but not much on impact of tuitions on learning level. See ‘The Shadow Education System: Private Tutoring and Its Implications for Planners’, Bray Mark (2007), UNESCO: International Institute for Educational Planning.  

[3] I have not gone in details of empirical techniques employed in the paper. Those interested in that aspect are requested to read the paper.

From Farm to School: A Photo Essay on the Provision of MDM in Schools

A few months ago, Vibhu and I discussed the issues surrounding the delivery of grain for the Mid-Day Meal (MDM) Scheme (see here).

This photo essay aims to visually depict the supply chain of grains to schools, as well as some of the school-level issues we’ve observed during our field-work on tracking the flow of grain and funds under MDM.

1. Acquisition of grain
                 

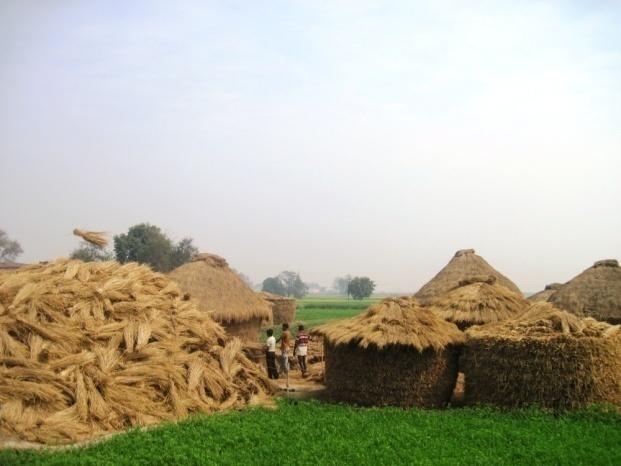
 Farmers make manageable heaps of harvested paddy from paddy stacks before threshing at a village in Bihar. February 2013.

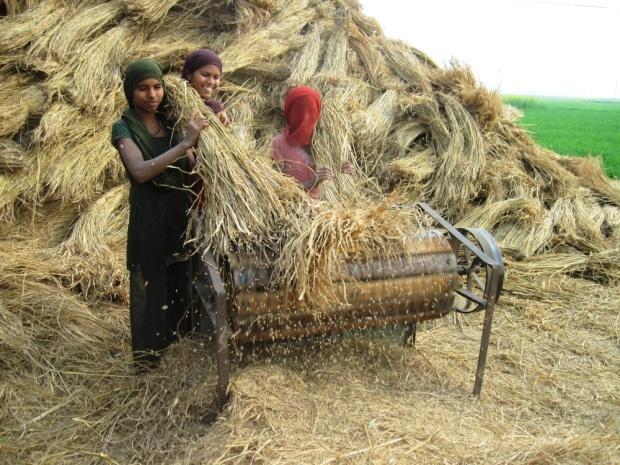
 A family threshes its produce of paddy before taking it to the market. Bihar, February 2013. 

Come harvest season each year, the Food Corporation of India (FCI) procures grain (rice and wheat) from farmers in select states and districts at designated purchasing centres and/or mandis. These grains are allotted to the Targeted Public Distribution System (TPDS) and other schemes including the MDM Scheme.

2. Delivery of grain to godowns and lifting of grains for MDM

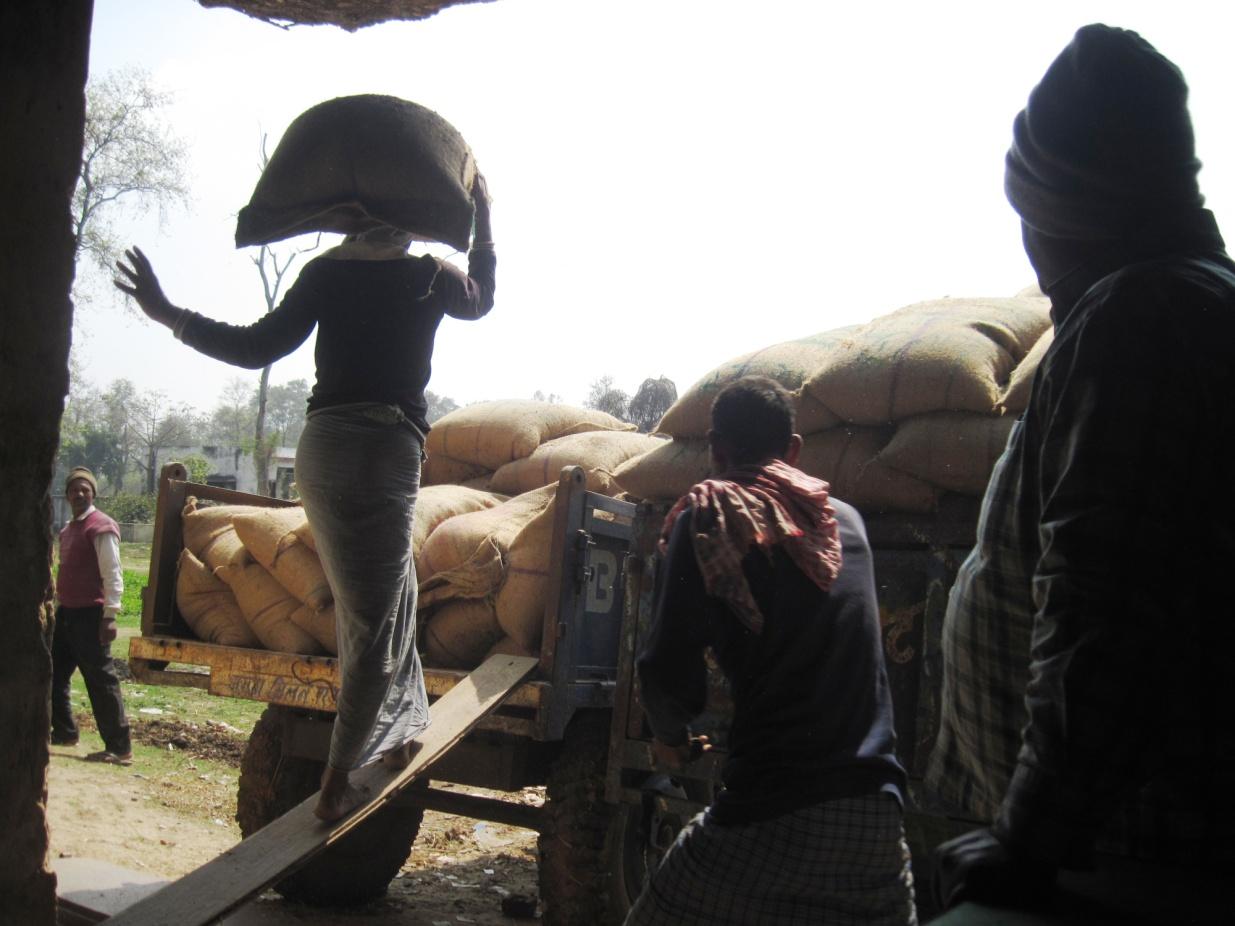
Grains once received by the FCI are packed into gunny bags of 50kg each and transported by rakes from the procurement state to regional FCI godowns (warehouses) around the country. Once weighed, stamped and sealed, these bags can not be opened until they reach their final destination. For MDM, the Ministry of Human Resource Development (MHRD) allots grain to each statebased on the enrolment in elementary schools and the number of working days approved by the Project Approval Board (PAB) during the previous year. At the state-level and below, the MDM Directorate and the District MDM Authority liaise with the FCI and state bodies such as the State Food and Civil Supplies Corporation (SFC) to ensure delivery of grains to schools. (See the PAISA report on the MDM Scheme for more details on the process of grain flow from FCI to schools.)
One of the most persistent complaints we heard from headmasters and teachers relating to grain delivery is that the quantity of grain received at the school is always less: each gunny sack contains anywhere from 3-8kg less. Yet, they have to sign receipt for the stipulated allocation. Officials and contractors overseeing lifting of grains and delivery to schools also say that bags are never properly weighed at any stage.

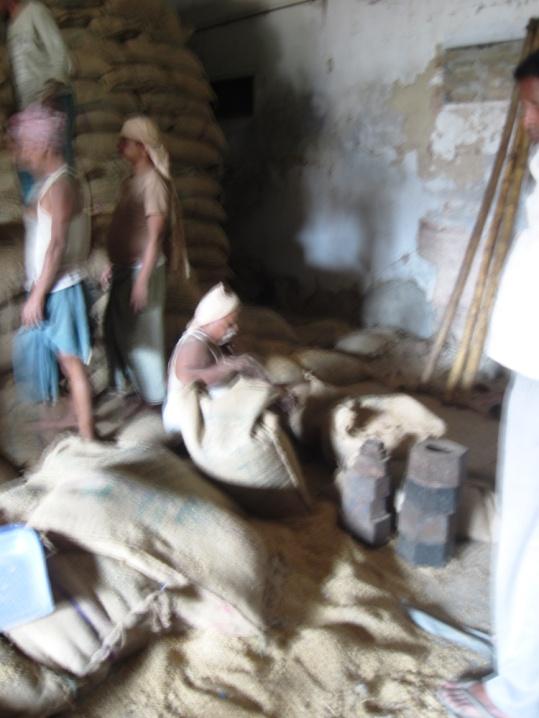
A labourer sews together a gunny bag in a block godown of the Bihar SFC. February 2013. (Disclaimer: the concern for quality of some of the photographs, such as in this godown where photography was not permitted, was secondary to the effort to depict/document what was going on.)

3. Transportation of grains to school

States have devised different means for the actual lifting and delivery of grains to schools. In Uttar Pradesh, the TPDS dealer or kotedar has to lift grains from the godown and then headmaster (HM) or Gram Panchayat Sarpanch collect grains for the school. Since 2012-13 in Bihar, a contractor has been employed in each block to lift grains from block godowns and deliver them to schools. While there remain several problems in grain delivery, HM’s believe that the plugging in of contractors has significantly decreased their burden and time away from school, and regularized grain delivery to some extent. See our earlier blog postt for a more detailed discussion of bottlenecks that arise during delivery of grains from district to block to schools.


Labourers load grain onto tractors at an SFC block godown in Bihar. February 2013.

Once grains have been delivered to schools, a whole other set of problems arise, from inadequate cooking cost funds to poor storage and cooking facilities to delays in payment of salaries to cook-cum-helpers (CCH). Here I touch upon the latter two problems.

4. Lack of storage facilities and cooking infrastructure in schools


The HM of this primary school (1-5) put a drum after the storage room became infested with rats, which had burrowed through the kitchen as seen in the foreground in the picture on the left. The gunny sacks had also been eaten through, spoiling the grain. Till February 2013, the Bihar Government had not provided storage drums to primary schools, prioritizing middle (6-8) or elementary schools (1-8), where enrollment is usually higher.


Firewood,
uple (cow-dung cakes) and other sources of fuel lie discarded in this kitchen, which was situated right beside the classrooms and the open courtyard in a Bihar primary school. Such poor storage practices raise the risk of fires and other accidents in schools. February 2013.


This building-less primary school in Bihar was operating on the outskirts of a village, where all students of classes 1-5 sat together in this tight space next to a house. The two cooks managed the cooking right outside this makeshift “classroom” but kept the cooking area quite clean. July 2013.

5. Issues related to cook-cum-helpers

Each CCH is supposed to undergo training on how to prepare MDM, its nutrition status, and how to maintain a hygienic cooking environment. They are also given a cap and an apron to use while cooking.


Until July 2013, I’d never seen any visible signs that these had been received by cooks; but even when I finally saw these chequered yellow-and-black caps and aprons in this particular school, they were not being used as the cooks didn’t feel the need. Bihar, July 2013.


During a village visit in Bihar, these CCHs (seated centre in blue and pink saris) had not been paid their salaries for over three months. Male members of their families had approached the HM and the Block Education Officer, only to be told that they would just have to wait. The HM was viewed as largely uncooperative and would not approach the block administration on their behalf. Storage facilities had not been optimum in the school and grain had got spoilt on two separate occasions in the past. Once, the son of one of the CCH cleaned the grain using his machine and tools for no charge; the second time, however, the grain had to be thrown away without any replacement. February 2013.

6. Provision of MDM to students


Bharat (name changed) eats his meal of plain boiled rice and a piece of pickle in Bihar two days after the tragedy occurred in Saran district (July 2013). The rice was filled with husk and insects, which he removed by the side of his plate. Students at this school, and their parents, had complained to the HM time and again about the poor quality of food to no avail.

All of the issues mentioned above lead to the end-result of children either not being served MDM according to norm or eating poor-quality food. Events such as Saran’s and elsewhere could be avoided in the future if the existing information flows, and monitoring and grievance redress systems are strengthened. As Ambrish and Mehjabeen have discussed earlier, empowering parents and other community members to play an active role in implementing the scheme would be key to ensuring that the goal of feeding school-children a nutritious meal each day is achieved.

Disclaimer: These pictures were taken during field visits between February and July 2013 in Bihar by the author. Please contact the author at stucker[at]accountabilityindia[dot]org or shaileytucker[at]gmail[dot]com for use of these pictures. The particular incidents mentioned here are not meant to be representative. 
 

Raghubytes: Too right to be left, too left to be right

(In the first blog of a series titled “Raghubytes”, T.R. Raghunandan offers readers a look at the functioning of the Government Machinery through the eyes of a former bureaucrat.)

In 2010, after nearly twenty seven years in the government, I retired voluntarily to plunge into the interesting life of being a wanderer, connector, upscaler and story-teller in the governance space. This news was greeted with trepidation and guarded optimism by former colleagues, close friends and family. However, my friends in the NGO sector were very enthusiastic. You must come and work with us, they said, and I readily accepted their offers.  I chose two highly motivated, high quality groups for my first forays into fending for myself in the governance space.

It was a few months later that I discovered that trouble was afoot. “You are still behaving like a bureaucrat”. This was a friend I admired, someone who had done tremendous work in the empowerment of children, an individual with whom I was working closely on Panchayat related issues. She was a staunch socialist and disliked globalization, GM seeds, big business and public private partnerships. Her enemies were predictable.

“You are not an activist, Raghu, you must become one”. She was warming to the theme.

What’s an activist? I asked. How are they supposed to behave? I like precision.

“You must join in our agitations and protests,” I was told. The conversation ended there, but a niggling doubt whether I belonged here was sown.

Niggling doubts, once sown, grow energetically. So it was not a surprise when I noticed that another NGO figure, a respected individual in national circles, commented during a meeting populated by elegant men and women in Khadi, that I was wearing a suit. “Just like a bureaucrat”, he said.  So I was an inappropriate dresser as well.

It was clear that I did not fully belong here, amongst a crowd of passionate anti-globalising pro-environment, pro-direct democracy supporters, who believed that all decisions had to be taken in Gram Sabhas and all these would be invariably the right ones.

NGOs come in all sizes and shapes and there are the ones aligned in the opposite direction, who speak with passion about urban growth and the middle class holding out hope for India. I have friends there too and led a double life working with these champions of free enterprise.

It was only a matter of time before trouble erupted here too. “The power of the market is what should drive policy”, said my friends. “Urban India holds the key to development”, they said. I nodded my head silently; I did not have the energy to argue with them; to say that I did not entirely agree.

Six months down the line, I realized that not only am I an inappropriate dresser, but also ideologically wishy washy. I wished fervently that enlightenment would descend one night and I would wake up either a committed right or a left winger, but that did not happen. I was too right to be left, too left to be right.

Then one evening, as I glumly contemplated a future of unending ideological confusion, the solution to my quandary surfaced. I would specialize in tracking government money. Both the left and the right would eat from my hand, because both need to know how the government rupee is collected and how it is spent.

Being a fiscal detective offers all the perks that bring smirks of satisfaction to an incurable bureaucrat who likes to wear suits. To the inevitable question I face when in polite company, ‘What do you do now?’ I say that I track public expenditure. That answer has the appropriate mix of mysteriousness and gravitas. I am inevitably greeted with the respect that is born out of half-understanding. It is easy to masquerade as one steeped in profundity, if one is specializing in public finance.

However, public finance is dead boring stuff. In particular, holding forth on various facets of this matter should not be attempted at home, unless one wishes to become a social recluse as well. Explaining over dinner how governments collect taxes and spend money on public services does not lend itself to a gay and witty style. Joyful banter is not a predictable outcome of such overtures. Kith and kin who have to spend three hours daily in the commute to office and back often express a desire to see the government take its money and stuff it into certain inappropriate orifices. The fact that I work from home tends to exacerbate the family disquiet over public finance, I know not why.

The fact that I will be writing a blog largely on questions of public finance has been greeted with relief by near and dear ones. Somehow there is an assumption that having been presented with this outlet, I would find no need to inject insights on government expenditure into after-dinner conversations. There is also the feeling that (why do bureaucrats always write in the passive voice? I must rid myself of this tendency) the unsuspecting public must now share the burden of enlightenment being stuffed down their throat.

I am piqued by these attitudes and have set some lofty goals. I am going to make India’s public finance story as interesting as a Rohit Shetty plot. There will be romance, action and suspense. Promises will be made and broken. Sometimes the left will win, sometimes the right. You will not know who did it, till the very last paragraph.

So please join me on this guided tour through the maze of government actions and processes. I promise it will be an interesting journey.


About the writer

T.R. Raghunandan is Advisor to the Accountability Initiative and our resident public finance expert.

A former Joint Secretary Government of India, Ministry of Panchayati Raj (Rural local governments),(2004-2009), Secretary Rural Development and Panchayat Raj, Karnataka State (2001-2004), he works in several States directly with Panchayats, their advocacy associations and a wide range of NGOs in the governance space. He has been an Advisor to the UNDP- India office on its democratic governance programme and with the Swiss Development Corporation for its local governance programme in South Asia,

Till recently, he was a member of the State Planning Board of Karnataka and Principal Consultant to the Expert Committee constituted by the Government of India, on Centrally Sponsored Schemes.

Mr. Raghunandan is also an anti-corruption expert and was the programme coordinator for the ipaidabribe.com initiative (2010-2011), which crowd-sources reports on corruption from citizens.

In his spare time, he is a model maker, steam railway enthusiast and classic automobile restorer. He is setting up a rural museum for children, named the Museum of Movement, to celebrate the romance of transportation in India through a not for profit, Avantika Foundation, which he has co-founded.

Private learning landscape in India: A brief review of the literature and available data

In 2012, the Annual Status of Education Report (ASER) found that, in rural India, the number of children in the age group of 6-14 years attending private schools was 28%. In fact, the percentage of children attending private schools has been on the rise over the past few years, and between 2009 and 2012, this number increased by 6 percentage points.[1] This shift in the form of schooling was visible while conducting the second round of the PAISA District Studies surveys in Rajasthan recently. In many of the government schools that I visited, the enrollment of children was dropping significantly, particularly if the school was close to an urban area. For example, in Jaipur, I came across some schools where the enrollment had reduced by more than half in the past two years. The teachers at one such school felt that a lot of the parents are choosing to send their children to private schools as they believe these schools can provide better education. Some of the government school teachers even agreed with the parents and said that public school teachers are so bound by meetings and accounting for funds that the learning process is being left behind. So what does the literature say about private schooling in India? Are there discernible differences between public and private schools and the learning they can impart? Also, are the students supplementing their schooling in any way, and if they are, what are the benefits?

The literature on private schooling in India provides us with some insights into the differences between public and private schools. One of the pioneering studies on this subject was undertaken by James Tooley in Hyderabad (Andhra Pradesh) between 2003 and 2005.[2] The schools studied were found to be providing good quality education in the English medium, at costs which were affordable to the poorest of families. These schools were run with minimum resources and teachers were hired on contracts which paid them a much lower salary compared to government school teachers. This helped the private schools reduce their input cost greatly, thereby keeping the fees low. Karthik Muralidharan and Michael Kremer (2008)[3] in a survey on rural schools in India find that, on average, private school teachers are present in schools more often and are more likely to be engaged in teaching activities. They also find that children in private schools have higher attendance and better test scores, and the latter holds even after keeping village and household characteristics constant. Similar results are also reflected in works by French and Kingdon (2010),[4] and Goyal and Pandey (2009).[5] There are a number of studies which have tried to dissociate this private effect from inherent selection biases that may exist for these schools. Tabarrok (2012)[6] introduces a test of ‘Cream Skimming’ to be able to control for whether better students are going to private schools, thereby causing the private effect. ‘Cream skimming’ is a phenomenon where the private schools are able to attract better students out of the population. Using district wise estimates, he finds that the effect of private schooling does not reduce greatly even when 70% of students are in private schools. He also finds that mean scores over the whole population increase with increase in proportion of private schools. Both these results suggest that there is a positive effect associated with private schools, over and above the “Cream Skimming”.

Despite these apparent advantages, private schooling also has its fair share of problems. Goyal and Pandey (2009) find that the overall quality of education is low in both private and public schools, and learning gains are limited from one grade to the next. Furthermore, there are some studies which suggest that this private school effect may still be driven by selection factors. Chugdar (2009)[7] finds that the private school advantage varies based on the village context and that private schools are more likely to be present in those villages which have a strong government setup. However the advantage offered by these schools in such villages tends to be lower. The author speculates that this is because the government schools in these villages tend to perform better either due to competition from the private schools or by leveraging better the government setup. In another paper, Chugdar and Quin (2011)[8] use a technique called propensity score matching to equate children and then gauge whether there is a difference in test scores between those going to private schools and those going to public schools. They find this difference to be statistically insignificant; they also formulate “low-fee” private schools based on the data and suggest that there may be no difference in the test scores of those going to the low fee private schools and those going to public schools.

From the above, it can be gauged that the literature on private schooling seems to be mixed: there is general agreement that private school students perform better in terms of learning, though even this learning does not appear to be ideal. However, whether these scores suffer from an inherent selection bias and whether we see a private effect if all other factors were equal remains up for debate.

Another way in which these children are interacting with the private market is through private tuitions (external help beyond the classroom). According to ASER data, the percentage of children in rural India taking paid tuition classes has remained around 23-24% between 2009 and 2012. Interestingly, if we look at table given in Wadhwa and Banerjee (2012)[9] (reproduced in Table 1 below) and compare students who attend government schools and take tuition with those who attend private schools and don’t take tuition, we find that the percentage of children in class 5 who can read a class 2 level text is very similar. Could it be that tuitions are making up for the learning which is being missed out in government schools but available in private schools? Exploring this question is outside the scope of this blog, but it takes me back to the point made by teachers in Rajasthan about the lack of teaching in government schools: is it possible that the learning aspect which is being lost in government schools is being supplemented by tuitions, thereby making it equivalent to private school learning?


Table 1: Class V Children who can Read Class II level text (in per cent)

Private School Enrollment + Tuition, 2010 Private School Enrollment + No Tuition, 2010 Government School Enrollment +  Tuition, 2010 Government School Enrollment + No Tuition, 2010
All India (Rural) 71 62.3 60.7 48.2


Another interesting and related point is that the India Human Development Survey (IHDS) data gives us the private expenditure for these two set of students: the expenditure on children who go to private schools and don’t take tuition and those who go to government schools and also take tuition. As we can see from the table below, the costs for the government school students (with tuition) are much lower compared those in private schools (without tuition), even though these two sets have similar learning outcomes. Of course, there can be inherent selection biases regarding tuition as well but it would be interesting to explore what effect tuition has on private and public school students, what are the characteristics of the children and households which access this tuition and what is the structure of these tuition classes which facilitate learning.

Table 2: Private expenditure on Education (in Rs.) (According to IHDS 2004-05 dataset)[10]

Private Govt
Tuition No tuition Tuition No tuition
Total Private expenditure on Education (in Rs.) Ages 8 to 11 4418 2399 1163 430
Total Private expenditure on Education (in Rs.) Ages 6 to 14 4618 2520 1455 494


[1] ASER 2009 and ASER 2012 reports available at http://www.asercentre.org/p/51.html?p=61

[2] Tooley, J. 2009. The Beautiful Tree: A Personal Journey into how the World’s Poorest People are Educating Themselves. New Delhi: Penguin.

[3] Muralidharan, K., and M. Kremer.  2008.“Public and Private Schools in Rural India,” available at http://econ.ucsd.edu/~kamurali/papers/Published%20Edited%20Volume%20Chapters/Public%20and%20private%20schools%20in%20rural%20india%20%28Final%20Pre-Publication%29.pdf

[4] French, R., and G. Kingdon.  2010. “The relative effectiveness of Private and Government schools in Rural India: Evidence from ASER data”. Available at http://repec.ioe.ac.uk/REPEc/pdf/qsswp1003.pdf

[5] Goyal,  S.,  &  Pandey,  P.  2009.  How do  government  and  private  schools  differ? Findings  from  two  large  Indian  states.  Report  No.  30,  South  Asia  Human Development  Sector.  Washington.  DC:  The  World  Bank. Available at http://ddp-ext.worldbank.org/EdStats/INDwp09b.pdf

[6] Tabbarrok, A.  2011. Private education in India: A novel test of cream skimming. Available at http://onlinelibrary.wiley.com/doi/10.1111/j.1465-7287.2011.00286.x/abstract

[7] Chudgar, A. 2012. “Variation in Private School Performance: The importance of Village context”, Economic and Political Weekly. 12 March, XLVII

[8] Chudgar, A., & E. Quin. 2012. “Relationship  between  private  schooling  and  achievement:  Results

from  rural  and  urban  India”, Economics  of  Education  Review  31 (2012)

[9] Banerji, R, & W. Wadhwa. “Every Child in School and Learning Well in India”. Available at www.idfc.com/pdf/report/2012/Chapter_5.pdf

[10] In this table, private schools are defined as Private unaided schools. Even when we look at the learning levels in the IHDS dataset (which are measured for Children between ages 8 and 11 years), we find that the uncontrolled mean level of learning for those in government schools who take tuition and those in private schools who don’t are nearly equal.

Per Student Allocations of Elementary Education Budget (2011-12 & 2012-13) and Learning Outcomes (2012)

The following table presents the per student allocation on elementary education across India[1] and the associated learning levels in these states, according to ASER 2012 report. A more detailed analysis of these allocations can be found in the PAISA 2012 report.

States Per Student Allocation (Rs. 2011-12 RE)[2] Per Student Allocation (Rs. 2012-13 BE) % children Std I-II who can read letters, words or more % children Std I-II who can recognise numbers (1-9) or more
Andhra Pradesh 14615 15150 83.9 88.9
Arunachal Pradesh Data NA Data NA 86.6 88.6
Assam 13584 14091 71 75.6
Bihar 4332 5516 55.9 61.7
Chhattisgarh 12025 12609 73 75.3
Goa 44654 45867 95.3 97
Gujarat 13562 14607 73.1 71.7
Haryana 18798 24390 79.6 84.8
Himachal Pradesh 28344 29785 89.6 94
Jammu & Kashmir 17640 19934 89.5 91.1
Jharkhand 6675 5669 66.1 68.3
Karnataka 14268 15727 82.8 81.9
Kerala 35721 37667 96.3 96.4
Madhya Pradesh 8601 8255 65 63.5
Maharashtra 20838 21226 77.4 79.8
Manipur 17032 26628 96 96.4
Meghalaya 17709 18520 92.4 91
Mizoram 22495 20212 96.2 96.8
Nagaland 24683 25772 97 96.9
Odisha 8804 8794 64.3 63
Punjab 10761 9902 86.3 88.7
Rajasthan 11746 11617 59.2 64.5
Sikkim 19060 14888 98.5 97.4
Tamil Nadu 16435 17475 58.6 68
Tripura 10270 9982 86.2 92.3
Uttar Pradesh 10997 11377 57.5 62.9
Uttarakhand 16830 22050 74.5 77.6
West Bengal 6940 6954 77.4 84.1
India 10946 11509 67.5 71.4


[1] Total allocation for elementary education (Centre and State) includes Mid-day Meals

[2] Allocations in 2011-12 are based on Revised estimates; Allocations in 2012-13 are based on Budget Estimates. Per student allocations were calculated by dividing total allocation by enrollment in Government School (I-VIII) (Source: DISE State Report Cards 2011-12)

How many officials does it take to procure a government document?

The first step when conducting a Public Expenditure Tracking Survey (PETS) at Accountability Initiative is to procure a permission letter from the relevant department of that State to be able to carry out our research. A permission letter is a signed, authorised, official-nod that is passed on to district and block administrators, and later, photocopied and distributed to all our volunteers. The volunteers carry this letter with them to the government schools they visit. It authenticates our intent and simplifies the data collection process. The permission letter is often the very first obstacle in the data collection process.

Our experience in six states has taught us that the time taken to procure this letter varies significantly. In some states, it takes a little less than a week, and in some over a month. In one particular instance, a request for the permission letter had to be faxed, emailed and delivered personally to the department, before an acknowledgement of the correspondence was received. In such cases, sending multiple copies helped, as faxes can be misplaced, emails deleted and deliveries unaccounted for.

Once the draft goes through, there is no way to predict how long it will take to receive the final document. Corrections can be made and new drafts can be requested for. Once the final draft is okayed by the first official, another official is responsible for typing the letter and printing it out on an official document. Once this document is printed, the official responsible for the printing passes it back to the first official to sign the letter. In the case of one permission letter, no less than three officials were expected to sign a letter thus tripling the time taken to process the document.

After the letter is signed, it is ready to be faxed/emailed/delivered to the subsequent (district/block) level. The official responsible for passing this letter down may be the same person with whom the signed copy rests, or it may be someone else entirely. Here too, there is no way to predict who the concerned authorities are and how long each subsequent step will take. With every new round of surveys, we lather-rinse-repeat (the first survey was conducted in the year 2011 and we are presently in the next round this year). We have come to approach this routine with some amount of caution as officials change and the process and their willingness to share documents, be it permission letters or data changes alongside. Oftentimes, old files serve as institutional memory and come to our rescue; other times, we have to start the application process from scratch.

Gupta (2012) explains the importance of recording all transactions down to a paper and storing them away in files in an administrative system wrought with frequent transfers. Written records testify how earlier decisions were made, aiding new officers to make an informed decision without prior knowledge of the issue. However, disappearing files often mean that the issue also disappears with it.  As Gupta (ibid) records an officer during fieldwork saying, “If it is not in the file, it does not exist.”

Jha (1987), the eighth Governor of the Reserve Bank of India, wrote, “The most important reform to tone up the efficiency of administration would be to take steps to ensure that the files do not have to move horizontally, between one department and another or vertically, within each department from the bottom to the top, before they reach the point where decision is taken.[1].

Having recently spent a week chasing one such permission letter I realised that files continue to move horizontally and vertically, in public offices. I shared my concern with the assistant in charge of getting the necessary signatures. I told him that we were drawing close to the commencement of our survey and we would have to stall the entire process if the letter did not come through. He told me that if I would just have to let things take their course, irrespective of the looming survey deadline.

Bozeman & Scott (1996) qualify red tape as rules that have gone wrong. Their definition of red tape includes both the cause and effect of red tape: “Organizational rules, regulations, and procedures that serve no appreciable social or organizational function but that nonetheless remain in force and result in inefficiency, unnecessary delays, frustration, and vexation.

Literature on red tape often tries to distinguish ‘good’ rules that uphold accountability and transparency, and guard one against arbitrary decisions and decision-makers from bad rules or red tape. The criticism being that red tape turns rules into an end in itself, rather than a means to an end (Bozeman & Scott, 1996, A, Gupta 2012)[2][3].

However, rules work only if everyone involved in the process is aware about them. During frequent visits to the government office, I learned that there would always be a new step, a new signature, and a new procedure that stood in between us and the final letter. When I asked the assistant to explain the whole process to me, so I could anticipate what would come next, he said that the process was too complicated to explain or understand. The information asymmetry between the public official and I, kept him in control and me in a constant state of suspense.

At the end of month, when we had received no letter from the department, we changed our strategy, reapplied for permission through another department and received our letter within four working days. This time around, the process worked in our favour, documents were typed, signed, stamped and sent with very little effort required on our part. Once again, if there had been a way to predict that this process would have worked far more efficiently than the last, we would have assumed this route much earlier.

In the case of the letter, the delay appeared to have been caused due to a complex protocol that had to be followed, without a specific time limit within which it ought to have been completed. In the absence of provisions like those placed under the RTI Act where an applicant is entitled to information within 30 days from the receipt of the application, there is a greater probability for ‘good’ rules to regress to red tape. In the words of Jha (1987), “Mr Red Tape is a creature of somewhat strange habits. He moves in grooves, he sits on files, he sleeps over reminders and occasionally, he has been known to eat his own words.

Maybe the next round of surveys will bring us more luck.


[1] L K, Jha. 1987, Mr Red Tape, Allied Publishers Pvt. Limited

[2] B, Bozeman & P, Scott. 1996, Bureaucratic Red Tape and Formalization: Untangling Conceptual Knots, The American Review of Public Administration

[3] A, Gupta. 2012, Red Tape: Bureaucracy, Structural Violence, and Poverty in India

Whistleblowers: Whose Protection?

As the debate rages on about whether or not US whistleblower Edward Snowden should be extradited from Russia to the USA and about the protection he deserves (or not) for leaking sensitive data on the National Security Agency (NSA)’s surveillance activities, questions have arisen in my mind these past few weeks about the kinds of legal provisions that exist in different countries for the protection of whistleblowers. Recent articles and debates centre more on whether Snowden even qualifies as a whistleblower (see here and here). Questions remain as to why countries such as Russia, Nicaragua and Venezuela have offered Snowden protection, especially with the threat of US sanctions. This blog, however, offers a quick comparison of the legislation enacted or proposed in select countries to encourage and protect public interest disclosure.

“Whistleblowing” or “public interest disclosure” entails disclosure made in good faith that the information revealed is true, serves the interest of the public at large, and increases accountability within Government (and/or the private sector, depending on the legislation). Most countries vary on the types and scope of subject matter that are covered, with some countries clearly defining the scope and others, such as India, leaving it more vague. Coverage for protection also ranges from only Central Government employees, to both State and Central Government employees, to Government contractors and the private sector.

While countries such as the USA and the UK had enacted laws to ensure whistleblower protection in the late 1980s and late 1990s (respectively), the early 2000s saw a surge in such legislation around the world, such as in South Africa (2000) and Japan (2004). At the same time, the Right to Information and anti-corruption movements gathered speed around the world. The United Nations’ Convention against Corruption (UNCAC) was also set up in 2005 and part of the Group of 20 (G20)’s Anti-Corruption Action Plan drafted in Seoul in 2010 specifically focused on whistleblower protection.

There are still several countries, however, including India and Russia, which have yet to enact such legislation. In India, for example, while the proposed Public Interest Disclosure and Protection to Persons Making the Disclosure Bill, 2010 (PID Bill, 2010), was passed by the Lok Sabha (Lower House) in 2010, it has not yet been ratified by the Rajya Sabha (Upper House) of Parliament. The following table compares Indian and US whistleblower protection legislation with that in the UK, Japan, and South Africa, which are considered to be more comprehensive laws.[1] The comparison includes a separate Act in the USA for the Intelligence Community in particular.

International Comparison of Legislation on Public Interest Disclosure and Whistleblower Protection

India USA (1) USA (2) UK Japan South Africa
Title of Legislation
Public Interest Disclosure and Protection to Persons Making the Disclosure Bill, 2010 (PID Bill 2010) Whistleblower Protection Act of1989 (WPA 1989) Intelligence Community Whistleblower Protection Act of 1998 Public Interest Disclosure Act, 1998 (PIDA 1998) Whistleblower Protection Act, Act No. 122 of 2004 (WPA 2004) Protected Disclosures Act , 2000 (PDA 2000)
Definition & Scope of Whistleblowing / Public Interest Disclosure
–   “in good faith”

–   by a public servant or any other person, including a non-governmental organisation, “on any allegation of

corruption or wilful misuse of power or wilful misuse of discretion against any public

servant” relating to the subject matters listed below

–  “to serve the public interest”

–  by federal employees to serve the public interest by assisting in the elimination of fraud, waste, abuse and unnecessary Government expenditures

–    by employees or contractors of  intelligence agencies (mentioned below) of wrongdoing within the Intelligence Community with respect to an “urgent concern” as listed below –  by a worker in the reasonable belief that information concerned  shows or tends to show violations concerning any of the subject matters listed below –     by workers without the intention of causing damage to others or obtaining wrongful gain or any other wrongful purpose –     by any employee or employer who has reason to believe that the information concerned shows or tends to show misconduct of any employee or employer concerning the subject matters listed below
Definition & Scope of Subject Matter of Public Interest Disclosure
Complaints against a public servant about: (i) violation of the Prevention of Corruption Act of 1988; (ii) deliberate misuse of power or of discretion leading to “demonstrable loss” to the Government or “demonstrable gain” to the public servant; and (iii) attempt to commit or commission of a criminal offence by a public servant.


Disclosures on matters covered by the Official Secrets Act, 1923, or relating to the Armed Forces, to intelligence or counter-intelligence, or telecommunications are not covered.

Disclosures of: (i) violations of ay law, rule or regulation; (ii) gross mismanagement or gross waste of funds; (iii) abuse of authority; (iv) or a substantial and specific danger to public health or safety.

These disclosures would only be considered if they are not specifically prohibited by law or if the information disclosed is “not specifically required by Executive order to be kept secret in the interest of national defense or the conduct of foreign affairs.”

“Urgent concern” about: (i) a serious or flagrant problem, abuse, violation of law or Executive order; (ii) a deficiency relating to funding, administration or operations of intelligence activity involving classified information; (ii) false statement or deliberate withholding from Congress on issues relating to(ii) above.


Does not include differences of opinions concerning public policy matters.

Information on: (i) criminal offence; (ii) failure to comply with legal obligations; (iii) miscarriage of justice; (iv) endangering of health or safety of individual(s); (v) environmental damage; and (vi) deliberate suppression of information revealing any of the above. Relating to violations of laws or dispositions concerning (i) agricultural & forestry product standardization; (ii) environment conservation, (iii) consumer protection; (iv) fair market competition; and (v) individual citizens’ health, safety, property & other interests Information concerning an employee or employer committing any one of the following: (i) criminal offences, (ii) failing to comply with legal obligations; (iii) miscarriage of justice; (iv) endangering health & safety of individuals; (v) damaging environment; or (iv) discriminating

unfairly

Coverage for Protection
Employees of Central and State Governments “or any other persons” including NGOs.


Disclosures must be made in writing or via e-mail.

Anonymous disclosures not to be considered.

Employees, former employees, or prospective employees (applicants) of Federal government agencies. Intelligence Community members (see adjacent column) not covered. Employees of or contractors employed by the following agencies (collectively known as the “Intelligence Community”): National Security Agency (NSA), Federal Bureau of Investigation (FBI), Central Intelligence Agency (CIA), Defense Intelligence Agency, National Imagery and Mapping Agency, and through Presidential determination, any other executive agency with the primary function of foreign intelligence or counter-intelligence Public and private sector employees.


Independent contractors also covered

Public and private sector employees, including temporary (“dispatch”) employees Public and private sector employees.


Independent contractors  not covered

Reporting and/or Enforcement Authority
Central Vigilance Commission, State Vigilance Commissioner, or any public servant from the Central or State Governments deemed “Competent Authority” to deal with these matters Office of Special Counsel (OSC) Inspector General of the Department of Defense or Justice, or his designee; Director of agency; Permanent Select Committee on Intelligence of the House of Representatives; Select Committee on Intelligence of the Senate. Those intending to disclose information to Congress directly must first notify the Inspector General/Director/ designee their intention to do so. Employer or another responsible person in organization; legal adviser; Minister of the Crown; any other prescribed person; police; Members of Parliament; media. Employer, Cabinet Office, the Imperial Household Agency, related institutional entities established under various laws to exercise such authority; or organs of local public entities (excluding assemblies) Legal adviser, employer, Cabinet or Executive Council, Public Protector, Auditor-General, or any other person or body prescribed to examine such matters
Types of Protection
No person or public servant making a public interest disclosure is to be “victimised” because of this.


Competent Authority must not reveal identity of whistleblower unless he/she has already revealed it. During investigations, the Head of the concerned Department/ organisation must not reveal identity either.


Any person who deliberately (“mala fidely”) reveals whistleblower’s identity would be punishable by law.

Protection from “prohibited personnel practices” (not defined in the Act but separately) and from “adverse consequences” as a result of such practices; prevention of reprisals. Also provides for protection of witness or other individuals from harassment during investigations. None mentioned Right not to suffer from “detriment,” including unfair dismissal; can complain to employment tribunal and receive compensation (i) Annulment of dismissal; (ii) reversal of  cancellation of temporary employment contract; (iii) prohibition of any “disadvantageous treatment,” such as demotion, pay cut, discrimination, etc. Whistleblower not to be threatened with or subjected to the following “occupational detriments”: (i) disciplinary action; (ii) dismissal, suspension, demotion, harassment or intimidation; (iii) transfer against will or refusal of transfer; (iv) refusal of promotion; (v) refusal of reference or provision of less favourable reference; (vi) given disadvantageous term/conditions of employment or retirement; (vii) denial of appointment to employment/ profession/ office; (viii) any other adverse effects related to employment, profession or office, including employment opportunities and work security
Specific Provisions for Public Sector Whistleblower Protection
None mentioned All government bodies must provide information on the Act to their employees All agencies must provide information on the Act to their employees None mentioned Provisions from existing public sector legislation would be applied as necessary to prevent dismissal of public sector employees and members of national legislature (known as Diet Officers) All public sector institutions must provide a copy of the Act’s guidelines to their employees
Specific Provisions for Private Sector Whistleblower Protection
None mentioned None mentioned. Covered by other laws (such as Dodd-Frank Wall Street Reform and Consumer Protection Act of 2010, and Amendments to the Securities Exchange Act of 1934) None mentioned None mentioned None mentioned None mentioned


As can be seen from the table above, countries such as South Africa, Japan and the UK are more comprehensive in their scope, coverage, and types of protection for whistleblowers, with clearly outlined definitions. For instance, the proposed PID Bill, 2010, in India actually does not define the types of victimization that it would provide protection against; on the other hand, the South African PDA, 2000, explicitly states the kinds of “occupational detriments” it provides protection against.

What is of most interest here is that the US has not one but two legislations on public sector whistleblower protection, including one which specifically covers employees and contractors from the intelligence agencies. Yet, in the eyes of the US Government, these laws are not the key ones that are to be upheld in Snowden’s case. The case is complicated by the classified nature of the information he has revealed, making it not merely a legal issue, but also a political one; and the repercussions are already being felt across the globe. Whether Snowden will be considered a whistleblower or a traitor, only time will tell, but for now the issue of whistleblower protection has again been brought to the forefront. Who qualifies as a whistleblower? To what extent can a State impose restrictions on disclosure? What are the implications for civil liberties and citizens’ right to reveal information that they consider is in public interest but is also classified? What kind of protection can such people expect? How can the fear of reprisals be minimized? At the same time, how can the misuse of such laws be prevented? These are just some of the questions that would need to be answered to ground sound policies for whistleblower protection and keep governments and corporations accountable to the general public. Clearly, the work is cut out for our policymakers.


References

Government of India, 2010, The Public Interest Disclosure and Protection to Persons Making the Disclosure Bill, 2010.

G20 Anti-Corruption Action Plan. Action Point 7: Protection of Whistleblowers. Available here: <www.g20.org/load/781360580‎>.

Newcomb, T., 2001, “In from the Cold: The Intelligence Community Whistleblower Protection Act of 1998,” Administrative Law Review, Vol. 53, No. 4, pp. 1235-1272.

Public Interest Disclosure Act, 1998. United Kingdom.

Protected Disclosures Act, 2000. Act No. 26 of 2000, Republic of South Africa.

Sanyal, K., 2011, “The Public Interest Disclosure and Protection to Persons Making the Disclosure Bill, 2010,” PRS Legislative Brief, New Delhi: PRS.

Transparency International-Russian (2013), “Russian implementation of UNCAC,” Accessed from: <http://www.transparency.org/news/pressrelease/transparency_international_russia_recommends_improvements_to_the_implementa>.

US Intelligence Community Whistleblower Protection Act of 1998.

US Whistleblower Protection Act of 1989

US Whistleblower Protection Enhancement Act of 2010.

Whistleblower Protection Act, 2004. Act No. 122 of 2004, Japan. English translation effective April 1, 2006, accessed here.


[1] G20 Anti-Corruption Action Plan. Action Point 7: Protection of Whistleblowers. Available here: <www.g20.org/load/781360580‎>.

Changing the face of development… One SMS at a time

At the turn of the millennium, Manuel Castells had come out with an argument in his ‘Theory of the Network Society’[1] that Information and Communication Technology (ICT) will have strengthened the flow of information- so much so, that it would alter the intensity, velocity and scale of the structural processes in society.  Today, the explosion of ICT for Development (ICT4D) mobile technology, network hardware and software, and the various services that accompany them, have led to a variety of exploratory approaches to bridge the development[2] gap.  At the heart of this ICT4D concept, the dominant debate is focused on whether it can lead to concrete development goals or whether it, in fact intensifies the digital divide. This blog will look at the ICT4D paradigm in India and the challenges that it faces in its current form.

Four years ago, an event called the ‘Random Hacks of Kindness’ (RHoK) was organized   to build open technology based innovative solutions that can in turn revolutionize social development. Its most recent event, held in Gambia, concluded with solutions ranging from bribe alerts and on-field volunteer tracking to mapping the location of water trucks and making data reporting easier. From the late 1990’s, the rhetoric of ICT4D was seen as a standard flow of information from the ‘technologically-strong’ North towards the ‘developing and poor’ South. It seems that in the last few years there has been a movement towards e/m-solutions that include web/mobile based information collection, monitoring and data visualizations to enhance tracking of development schemes. These are built taking social, economic and political structures in mind, steering away from the one-size-fits-all form of solutioneering.

Over the last few years, this movement seems to be picking up in India as well. In April 2013, the Planning Commission held a ‘Hack the Plan’ event which brought together young innovators to create visualizations for generating solutions across sectors such as Agriculture, Rural Development, Health, Water, Energy, Education and Urban Development. In a similar vein to the international context, there is a general trend propagated by international agencies as well as the government towards a ‘rights-based’ approach in bringing mobile and internet based technologies to the local tiers. This approach brings in participation, empowerment, accountability and transparency at the core of its framework and tries to make it a bottom up process. This is loosely based on the concept that open data and, increased access to ICT will expand the means through which people can access various services. As mentioned in previous blogs (see here, here, and here), drawbacks aside, there are several positive forms of impact that ICT has had so far. In 2012, the Indian Ministry of Communications and IT announced that public services will now be available through mobile devices (see link). This came in addition to several m-governance based schemes such as SMS alerts for government officials, monitoring through GPS, IVRS to track teachers and to get overall feedback. Early this year, 200 mobile applications were made available/approved by the government to apply or track the status of particular government services (see here).

Despite the obvious benefits of showcasing a growing ‘modern’ public sector and providing conveniences at a low cost, there are still several challenges being faced under the ICT model of service delivery:

Provision of basic infrastructure

First and foremost, unaffordable or inconsistent electricity can be the greatest challenge in not just implementing but creating any mobile or computer-based services for the masses. It is one of the most basic problems faced by both the service provider and the beneficiary. This problem is enhanced by the unavailability or the lack of high speed internet connectivity. The incorporation of various channels like voice, text, GPRS, USSD, SIM Tooklit, and MMS are great to the extent that they may not need to be reliable solely on internet-based platforms. Despite this, while ICT platforms are beneficial across various measures, they fall flat in the face of low infrastructural provisions. A way to overcome this was implemented through the National Optical Fibre Network which aims to provide broadband connectivity at the village (Distrit and Sub-district) level across 2.5 lakh panchayats across the country.

Creating enough awareness, visibility and accessibility

This year, the total number of mobile subscribers grew to 871 million in February (TRAI). However, while the numbers increased in the urban context, the numbers actually decreased for the rural subscriber base. The key benefit of using ICT is that it brings participation to the citizen directly. With the objective of delivering services in an efficient, transparent manner through customized technology, there is great opportunity for growth. In 2009, the Rajkot Municipal Corporation assessed the potential scope of service delivery through mobile phones, and designed an information-sharing initiative that incorporated more than 100 municipal services as well as enable registration of grievances through SMS. A major benefit of their services was that their 1 call centre integrated 15 complaint offices. This form of service delivery is now being rolled out at the national level under the World Bank supported e-Bharat program. However, both programs face difficulty in popularizing the services amongst a wide range of citizens[3]. Print media, advertisements, face-to-face encouragement and developing language-based applications are only some of the means to create visibility. However, a push towards creating more awareness among the masses on the different ways in which they can now use their mobiles, or how they can actually utilize these services for their benefit, is necessary.

Generating a demand-supply base through training and technical support

Andhra Pradesh enabled a mobile based Garbage Monitoring System, through a GPS enabled phone where reports on the collection of waste and the daily photographic documentation of each bin is sent to the administrator in the municipality office for monitoring. At each level, enough training is given to the supervisors and the individuals involved, making sure that the manual entering of information is correct. The widespread reach of mobile technology assumes that the adoption of services will be quicker and easier. This sort of thinking rests only on the supply aspect of a service. It does not account for the skills that the citizens should possess to operate any type of m-governance or e-governance platforms. The development of these structures rests on the competency of skilled manpower (government officials, panchayats and ward members) in implementing capacity building for these government services (or a simple How-to program would suffice). It is through this manpower that awareness for using these mobile services can be effectively spread.


Provision for checks and balance

It is indeed a great feat that ICT platforms provide for strengthening monitoring processes at the ground level. Citizens as well as decision makers need the right information and a continuous tracking of governing institutions & officers, in addition to knowing that e-services have the potential to reduce redtapism, may mean greater accountability of government programs. However, the focus on the end result should be as important as the focus on providing safe, secure and complete information. A continuous feedback loop needs to be created, ensuring there are mechanisms to monitor the software and maintain information accuracy, should be seen as analogous to the proliferation of mobile governance. How can the citizens be ensured that the services that they have asked for will be delivered? It is indispensable to the process of e-governance/m-governance, that the information being given is correct and complete, while also making sure that there is a continuous feedback loop in case of any oversight.

When we look at m-governance or even e-governance from the outside, there is a somewhat concrete design in terms of its goal – to deliver quality services at the citizen’s doorstep. We need to, however, keep our eyes on the ball. Structural inefficiencies in the horizontal and vertical systems of governance often surpass the use of great, simple solutions. This disjuncture between the problem and the solution should force us to think of the use of mobile or internet technology not as an end by themselves, but as means to the end, to enhance state capacity in delivering quality public services.


[1] Castells, M. (2000) Materials for an exploratory theory of the network society, British Journal of Sociology 51, 1, 5-24

[2] Development here, is defined under the UN MDGs definition which understands it through the incorporation of poverty and hunger reduction, provision of primary education, gender equality, health issues, and environmental sustainability

[3] http://indiagovernance.gov.in/files/GKC_mgovernance_Final.pdf

A house for the homeless

This article was published in One India One People magazine, June 2013 issue, available at: http://www.oneindiaonepeople.com/

After the Right to Education and the Right to Food, a new right is being sought to be tabled in Parliament – the Right to Housing.  The Draft Homestead Bill 2013 aims at providing a homestead[1] of not less than 10 cents (0.1 acres or 4,356 sq. ft) to every landless and homeless poor family in rural areas.

Given that India is home to close to 8 million homeless rural families the demand for the right to housing is not surprising. In fact, the Twelfth Plan working group on rural housing estimates the shortage in the Plan period (2012-17) at around 40 million.

However, the main question arises is – how will this “right” differ in its implementation from the existing scheme on rural housing – the Indira Awas Yojana (IAY).

Background

Launched in 1985, IAY is Government of India’s (GOI) flagship programme on rural housing. The objective of the scheme is to provide funds to  for the construction of dwelling units for members of Scheduled Castes (SCs)/Scheduled Tribes (STs), free bonded labourers, and non SC/ST rural below poverty line (BPL) households.

With effect from 2013, Rs. 70,000 is provided per dwelling unit for plain areas (up from 45,000 in 2009) and Rs. 75,000 for hilly/difficult areas (up from Rs. 48,500)[2]. IAY funds can also be utilized for up gradation of a kutcha house for which a subsidy of Rs. 15,000 per unit is provided. Further, IAY beneficiaries can also avail of a top-up loan of up to Rs. 20,000.[3] In 2009, to assist those rural BPL households who have neither agricultural land nor a house-site, IAY also launched a scheme for providing homestead sites.

Over the years, allocations for IAY have increased over 2-fold from Rs. 3,885 crores in 2007-08 to Rs. 8,121 crores in 2012-13. The scheme received a significant boost in allocations in 2013-14, when GOI allocated 15,184 crores- nearly doubling the allocations for the previous year.

During the 11th Five Year Plan, against a target of 140 lakh houses, 126.98 lakh houses were constructed at a cost of Rs. 53497 crores. (See Table below for performance in the last 10 years)[4].

Performance of IAY over the last 10 years

in lakhs

Year GOI Allocation GOI  Release Utilization Target (No.of houses) No.of houses constructed
2002-03 165640 162852.86 279496.46 13.14 15.49
2003-04 187050 187107.78 258009.69 14.84 13.61
2004-05 246067 288310.02 326208.64 15.62 15.21
2005-06 273240 273822.58 365409.05 14.41 15.52
2006-07 290753 290753.06 425342.45 15.33 14.98
2007-08 403270 388237.01 546454.3 21.27 19.92
2008-09 564577 879579.39 834834.33 21.27 21.34
2009-10 849470 863573.99 1329236.4 40.52 33.86
2010-11 1005370 1013945.4 1346572.75 29.08 27.15
2011-12 949120 986477.8 1292632.74 27.26 24.71

Source: Ministry of Rural Development, Annual Report 2012-13


While these numbers suggest a relatively well functioning scheme – most of GOI allocations are released, funds are utilised and houses are being constructed – there are wide state variations in performance and numerous issues with respect to implementation. Some of these are highlighted below:-

Implementation Highlights

1) Delays in Fund Flows and Construction

In 2012-13, till January (more than 3 quarters of the financial year completed), out of the total funds available[5] for IAY, only 63% of the funds were utilised. Moreover, only 46% percent of the annual target for construction was completed. These delays are particularly acute in some states. While Rajasthan and Chhattisgarh had utilised nearly 100 percent of their funds available during this period, Jammu and Kashmir had utilised only 21%, Punjab 36% and Tamil Nadu 45%. Other states such as Karnataka, Uttar Pradesh, Gujarat, West Bengal and Maharashtra had utilised only between 50-60% of funds available.[6] According to reports, part of the problem lies with delayed release of funds. In 2012-13 itself, out of the total allocation of Rs. 10513.20 crores only 54% (Rs. 5655.37 crores) was released by January 2013.

Pace of construction is also slow. Till January 2013, Tamil Nadu and Uttar Pradesh had only completed 10% and 13% of their annual target for the year, respectively. Most other states also ranged between 20-50 percent completion rates including Maharashtra (20%), Odisha (32%), Gujarat (33%), Chhattisgarh (36%) and Kerala (46%).[7]

2) Quality of houses

An important concern over the years has been with respect to the quality of houses. According to the IAY guidelines, the construction of an IAY house is the responsibility of the beneficiary. While no specific design type has been stipulated for an IAY house, sanitary latrine and smokeless chullah’s are required to be constructed along with each IAY house.

The Planning Commission’s mid-term review of the XIth Plan noted many instances of “poor quality construction, sagging foundation, use of temporary materials for roofing or leaving the construction incomplete because of inadequate finance”[8]

Four years later, similar findings were reported by the Ministry’s National Level Monitors (NLMs). During their visit to 3083 villages across 478 districts, only 15.2% of the houses were found ‘Excellent’ in terms of quality of construction, 52.2 % were rated ‘Good’, and the remaining 32.6% were ranked poor or average condition. [9]

The NLMs further found that 16% of houses which have been sanctioned for more than 2 years were still incomplete. Moreover only, 8% of the verified houses visited had smokeless chullahs and only 39% had sanitary latrines provided.

3) Beneficiary selection and allotment of houses

Selection of beneficiaries was originally the responsibility of Gram Panchayats (GP). However, due to rampant irregularities and biased selection[10], the revised guidelines stipulate that beneficiaries be identified through a Permanent IAY Waiting lists prepared on the BPL list of 2002.  In order to increase transparency these lists are supposed to be displayed in all GPs.

The NLM reports however found that out of 2780 villages where permanent IAY lists were finalised, only 53% villages these were displayed on the walls. Moreover in nearly 10% of the villages the selection of beneficiaries was still not based on these lists.

While guidelines specify that 60% of IAY allocation is meant for SC/ST families and IAY houses are to be allotted (in this order of preference) in the name of the woman or jointly between the husband and the wife, audit reports by the Comptroller and Auditor General (CAG) have found many instances of houses being allotted to  “fake persons” or male members.[11]

5) Land availability

Finally, the biggest constraint faced is often with respect to land availability. Land costs tend to be high and in the absence of land, houses tend to be incomplete or in a worse case not be constructed despite being sanctioned.

These findings suggest that despite nearly 30 year of the scheme in operation, there are a number of hurdles with respect to the implementation of IAY. While GOI has taken some steps in addressing these (particularly with respect to increasing the unit costs of dwelling units. providing additional assistance for construction of toilets and increasing transparency in selection of beneficiaries), there still appears to be genuine constrains with respect to delays, lack of monitoring, technical capacity, lack awareness amongst beneficiaries and even unavailability of land. Until these implementation issues are resolved the “right to housing” is unlikely to go too far.


(The author is grateful to Ms. Saamia Ibrahim for her research assistance)


[1] Homestead is defined as a dwelling with adequate housing facilities including access to basic services (drinking water, electricity,  roads and public transport), appropriate location, accessibility and cultural adequacy.

[2] Ministry of Rural Development, Annual Report 2012-13.

[3] This is a part of the Differential Rate of Interest (DRI scheme) wherein beneficiaries can apply for a loan from any Nationalised bank at an interest rate of 4% per annum

[4] Ministry of Rural Development, Annual Report 2012-13.

[5] Funding for IAY is shared between GOI and states in a 75:25 ratio (for UTs it is completely centrally funded)[5]. Total funds available would include releases by GOI and States as well as opening balances at the start of the year.

[6] Indira Awas Yojana Portal, PRC Meeting 1 and 2

[7] Ibid

[8] Planning Commission, Mid Term Appraisal for Eleventh Five Year Plan. Available online at: http://planningcommission.nic.in/plans/mta/11th_mta/MTA.html

[9] Details of the criterias for different categories are available at: http://www.ruralmonitor.in/nlmreport/RM_12-13_Phase-I_All%20India.pdf

[10] The 11th Five Year Plan document had found that “25 to 50 percent of beneficiaries were not being selected to Gram Sabhas’s. Alloaction among Panchayats were influenced by PRI/MLAs.

[11] For instance, CAG found that in one district in Maharashtra, in 685 out of 2426 cases allotment of houses at a cos of Rs.4.69 crores were to male members in 2010-11. A recent report on Odisha found Rs. 1.15 crore in allotment of houses to 1144 non-BPL families in 4 districts and irregular payments to 321 “fake” BPL beneficiaries
Trends in Maternal Mortality

India has been one of the worst performers as far as maternal mortality is concerned. The Maternal Mortality Ratio (MMR), which measures the number of female deaths between ages 15-49 years , due to maternal causes per 1,00,000 live births, stood at 398 in 1997-98[1]. This figure came down to 212 for the period 2007-09, as per the latest Sample Registration System (SRS Bulletin, June 2011)[2]. Yet, this is nowhere close to the Millennium Development Goals (MDGs), which had set the target of MMR of 200 by 2007 and 109 by 2015. Unfortunately, the next round of SRS results has not yet been published and the latest MMR figures are not known[3].

This blog attempts to understand the trends in maternal mortality across the low and high performing States from 1997-98 to 2007-09 and assess whether the gap between the low and the high performing States has narrowed down during this period[4]. This is especially important given that the National Rural Health Mission (NRHM) has focused more on the low performing States.

Trends

These national numbers hide tremendous state-wide variation. MMR for the low performing States is much higher than the high performing States, and stood at 308 for the period 2007-09. The following table indicates state-wise MMRs for the low performing States.

Table 1: MMR in the Low Performing States (1997-98 to 2007-09)

State 1997-98 2007-09
Assam 568 390
Bihar & Jharkhand 531 261
Madhya Pradesh  & Chhattisgarh 441 269
Orissa 346 258
Rajasthan 508 318
Uttar Pradesh & Uttarakhand 606 359

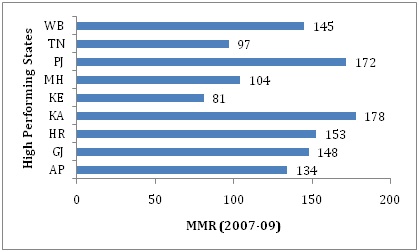
The table shows that even though the low performing States have seen a significant decline in MMR, their current levels indicate that they are unlikely to achieve MDG targets anytime soon. As far as the high performing States are concerned, only 3 States, Kerala, Maharashtra and Tamil Nadu have achieved the MDGs.

Figure 1: MMR in the High Performing States (2007-09)

Now, let’s see whether the gap between the low and high performing States has narrowed down in these 10 years.

Methodology

Consider the following regression:

Yit = β0 + β1 * LPSi + β2 * Yeart + β3 * (LPSi*Yeart) + εit

Where Yit = maternal mortality in State i in year t,

LPSi = dummy which takes value of 1 if the State belongs to the category of low performing States,

Yeart = indicates time-period. The baseline is 1997-98.

(LPSi*Yeart) = This is our variable of interest. A negative sign on the coefficient of this variable will indicate that the gap between the low and high performing States is narrowing.

Results

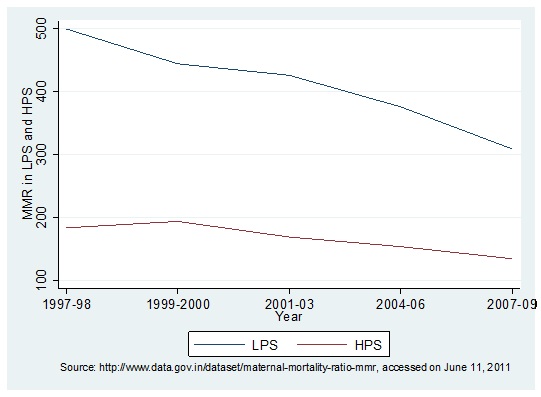
The following figure, based on the above regression, summarizes the results quite neatly. The top line is MMR for the low performing States, while the bottom line is MMR for the high performing States. The distance between the two lines represents the gap between these two groups.

The figure shows that, over a period of time, the gap between the two has declined. From more than 300 in 1997-98, it has come down to around 175. Can we say anything about the speed of decline in the gap? The figure indicates that the speed of decline has gathered momentum in the later years, more specifically, 2004-06 onward.

Figure 2: MMR in the Low and the High Performing States

What might explain this trend?

One explanation is the Janani Suraksha Yojana (JSY), which pays monetary incentives to women if they deliver in medical facilities. Assuming that better care is available in medical institutions compared to home, higher institutional deliveries should drive the maternal mortality down. There is an increasing evidence that the JSY has led to substantial increase in institutional deliveries (see here, here, and references therein). And hence, this is a plausible explanation[5].

Whether the JSY alone would help in achieving the MDGs, in the absence of adequate number of medical facilities, lack of infrastructure in these facilities, human resource deficit, absenteeism and abysmal quality of care remains to be seen[6].


[1] Deaths of women on account of pregnancy, childbirth or within 43 days of childbirth are regarded as ‘maternal’ deaths (SRS Bulletin, April 2000).

[2] All the figures used in this blog are sourced from various SRS bulletins available at http://censusindia.gov.in/vital_statistics/SRS_Bulletins/Bulletins.html

[3] This itself is quite surprising since the 2007-09 numbers were out in June 2011, exactly two years ago.

[4] As per the National Rural Health Mission (NRHM), the low performing States are Bihar, Jharkhand, Madhya Pradesh, Chhattisgarh, Orissa, Rajasthan, Uttar Pradesh, Uttarakhand, Assam and the states in the North-East India.

[5] Other potential explanations are rising incomes, better access to medical facilities, and increasing awareness levels about the benefits of institutional deliveries.

[6] Rural Health Statistics (2011), Concurrent Evaluation of NRHM (2009), Banerjee, A & E Duflo (2006), “Addressing Absence”, Journal of Economic Perspectives, 20(1): 117-132;Das, J & J Hammer (2007), “Money for nothing: The dire straits of medical practice in Delhi, India”, Journal of Development Economics, 83(1): 1-36