Transparency, Accountability, and the Indian Government

A BIARI 2016 Presentation

“The narrative of [government] transparency and accountability in India is … the aspiration, regardless of political leanings,” said Yamini Aiyar, senior fellow at the Centre for Policy Research in India, and director of the Centre’s Accountability Initiative. Speaking yesterday at the Watson Institute’s annual global conference, the Brown International Advanced Research Institutes (BIARI), Aiyar discussed the challenges facing India’s emerging welfare state. Because state services, including education, access to water, road building, healthcare and security are so abysmal, India’s middle class and elite class rarely, if ever, use them.

“Being an ordinary citizen in India can be the equivalent of hell on earth,” despite having state-sanctioned rights to work, food security, sleep and access to information, said Aiyar, a TED fellow and member of the World Economic Forum’s global council on good governance.

Aiyar has done more important research on the question – How do you go from the center [of government] to the infamous last mile? –  than anyone else I can think of, said Patrick Heller, director of the Graduate Program in Development at Watson and professor of sociology and international and public affairs.

“She’s one of the more renowned research scholars affiliated with the Centre – one of India’s most vibrant independent think tanks,” Heller said. By monitoring government planning, budgeting, and decision-making in key social sectors, Accountability Initiative researchers bridge the divide between evidence and action and convene groups of citizens, policy makers, and government officials to act for the greater good. “What I found so amazing about the research being done in the Accountability Initiative [is that it] actually takes you through the chain of accountability and identifies some of the problems,” said Heller.

Aiyar and her Accountability Initiative colleagues collect, scrutinize, and analyze massive quantities of original data on social service government programs. “A program [like education] in India, a country of more than 1.3 billion people, has to travel through all the states and villages of India after starting in the capital, Delhi,” said Heller, a co-convener of the Governance and Development in the Age of Globalization Institute during BIARI.  “What happens when the ‘rubber meets the road?’ Aiyar’s Accountability Initiative is unearthing data to answer this question.”

What happens is troubling, at best: Vast numbers of India’s teachers don’t show up for work; when they do, there’s no guarantee they come to the classroom and actually teach. One independent study from 2010 found that many fifth graders couldn’t decipher a second-grade text, despite significant increases in government investments in education. Inflexibility reveals local bureaucrats’ refusal or inability to think and act creatively: When orders came down from a higher government entity to purchase fire extinguishers for every school, some local officials did so, despite having no physical building for the school.

Efforts within India to regularize accountability and transparency within the government of India, the world’s largest democracy haven’t led to systemic change. Local bureaucrats view their responsibilities as responding upward – to a bigger government entity – rather than to citizen complaints or concerns. Accountability requires a bureaucrat see himself not as a cog in the wheel and as separate from the government, but as an agent of change who responds to people, said Aiyar. Systems need a certain amount of accountability, yet must empower bureaucrats with enough discretion and authority to be responsive and engage with citizens. “It requires a nimble approach; a lot of our work [at the Accountability Initiative] is about that.”  

This blog is written by Nancy Kirsch and has been taken from Brown International Advanced Research Institutes (BIARI) 2016 organised by Watson Intstitute at Brown University.   

Tales from the Panchayats

The last few weeks has been spent yo-yoing from interactions with policy makers and academia, to visiting local governments and interacting with elected representatives. The latter has been infinitely more interesting, needless to say. Watching democratic decentralisation in practice never tires me. Never is there a sense of Déjà vu, every turn is unexpected and throws new light on something one thought one knew well.

As we careened through the crowded roads north of Thiruvananthapuram town – Kerala drivers are speed fiends – I was filled with keen anticipation. I had always wanted to visit Manickal Grama Panchayat, having heard so much about its innovative activities. Earlier in the day, I had met the Finance Minister of the State along with a foreign delegation that I was accompanying. Professor Thomas Isaac, an academic turned activist turned politician, had, in the course of his interaction, estimated that about one third of Kerala’s Grama Panchayats were outstanding performers. Certainly, Manickal ranked amongst the best.

At the Panchayat office, Sujatha, the Panchayat President, welcomed us. The body had only recently been elected and it comprised of 21 members, of whom 13 were women. Just prior to this election to the local governments, Kerala State had legislated to increase the seats reserved for women to fifty percent, from the earlier 33 percent. Accordingly, 11 seats in the Panchayat were reserved for women. Two women members were elected to unreserved seats, something that is now a growing phenomenon across India.

As we went on a short tour of the office, I noticed why this Panchayat was different. Indian offices loathe signage, but Manickal was different. Every activity of the Panchayat was described in clear signs. There was a Front Office where citizens could submit applications to the office. Staff sat in airy cubicles; there was hardly a file – so characteristic of Indian offices – in sight.

We settled down to our discussions with the Panchayat elected representatives and officials. Shiji, the senior clerk in the Panchayat described to us what we had come here to learn – how the Panchayat obtained an international certification for its internal processes; an ISO certification.

Obtaining the ISO certification was prompted entirely by the elected Panchayat. No senior officers were consulted or considered important to the decision. Since Kerala allows Panchayats a relatively untied fund that it may use for local projects, a consultant was engaged to guide the Panchayat through the process of meeting prescribed standards, at a price below the government indicated upper limit.

The first improvement undertaken in the Panchayat was to revamp the document management system. Through improvements in the records storage facility, the Panchayat achieved its target of recovering historical data within specified time limits; As Riji Joseph, the Assistant Secretary of the Panchayat informed us, a birth record of 1953 – the year in which the Panchayat was formed – could be retrieved in 2 minutes after these changes.  The next change was to ensure that all workflows for various services were routed through a Front Office. Improved Front Office services included the receiving of all applications, complaints and cash at the front office alone. Receipts for acknowledgement were issued for all such communications by the front office, containing the date on which the service would be delivered. It was also the responsibility of the front office to scan all documents submitted to it using a high speed scanner and instantly sending it to the section responsible, using the ‘Soochika’ software specially designed for Panchayats by the Information Kerala Mission. Fine transactions between sections were also handled by Soochika, which explained the absence of cumbersome files and the typical clutter that goes with it.

For each of the services delivered by the Panchayat, a service process manual was introduced. This enabled the Panchayat to meet the assurances given through its citizens charter, of providing services of the right quality within the assured period of time. The service manual has since been further detailed, based upon the Kerala Right to Services Act. In order to ensure that quality assurances does not drop, the staff of the Panchayat are organized into a ‘Quality Circle’, which keeps a watchful eye to ensure that service standards do not drop.

But all this is the easy part.

Service delivery is not merely the following of a prescribed process, but to be responsive to the nuanced needs of people. Sometimes, ensuring that citizens come first, might mean riding out to battle. More of that, in my next blog.

Image: (from the left) Jayan, vice- President of Manickal Grama Panchayat, Sujatha, President and Riji, Assistant Secretary, explaining the activities of the Panchayat.

ACCOUNTABILITY INITIATIVE (AI) AND SCHOOL MANAGEMENT COMMITTEES (SMC)

AI’s determination to work with SMCs follows from its foundational beliefs on what accountability is and what is required to make it work. Our understanding of this is a mature environment for accountability when decision makers are informed, service providers are responsive and citizens are empowered. Hence any recommendations made by us are always going to be about how to repair them where they are broken, create them where they do not exist. Additionally, to find out what is working where they exist and how to strengthen them. The model that we are building to work with SMCs today, addresses all three nodes and the links between them.

The 2006, Jaunpur study (Pratham) found that development outcomes could not be improved by just putting local participatory bodies in place. Variables like the preparedness of Village Education Committees, apathy of the public on the state of education remained variables that needed addressing for participation to become effective.

This reinforced the approach that AI was thinking of taking, and our interventions became focused on the ongoing and enduring lag between planning and local implementation. Our idea is to empower communities such that their participation could restructure the planning process and increase accountability. With this in mind, we tried to generate demand in Parent Teacher Associations and Panchayats in Madhya Pradesh in 2009-10 and learnt three things.

Two reinforced what others had learnt:

PTAs needed support to participate and the local administration needed support to accept this participation. We also found that even if both parties were enabled and empowered to participate, they could not possibly do so as the primary role of the SMC – which is to monitor quality is tied to its role as a fiscal monitor. However, the money that they needed to monitor did not arrive on time. On further investigation, we found it was not being disbursed on time.

This started our PAISA studies through which we explored how funds flowed through the system, what the communities and schools had to work with and how and to what extent planning could be effective despite these constraints. In 2010-11, with Pratham in Hyderabad, we developed simple, almost language-free tools that empowered SMCs to become aware of their fiscal responsibilities, to assess and prioritise school needs, trace spent and unspent grants, formulate an effective School Development Plan and monitor it. The SMC manuals of Madhya Pradesh, Himachal Pradesh and Maharashtra have borrowed from these.

Since 2014 we have been taking our understanding back to SMCs – to hopefully close the gap we found in 2009-10. Through our program: Hamara Paisa Hamara School, we share the results of the PAISA studies in the schools covered by the survey:

  1. What money was allocated and received?
  2. Periods of allocation
  3. Were the schools needs and priorities met?
  4. What were the related outcomes of the school?

We found repeatedly that there was a lack of sustained interest in education in the SMC members. They lack the capacity to mobilise and plan school development. They needed support to participate and learn the importance to create institutional linkages with district administration and the government training mechanism. We found that the system does not have the preparation to listen, even as it is legally required to, propelling us to build a strategy to sustain these linkages.

Moreover, the system does not support the role of the SMCs as the fund-flow which is central to their functioning face systemic difficulties.

Less than 1% of the Elementary Education budget actually reaches schools in the form of school grants. In themselves the grants have a limited usefulness, because they are tied to specific instructions on how they can be spent.

They are also consistently late, making it difficult for stakeholders to spend them.

In India, in both 2012 and 2014, less than 50% of Maintenance and School Development Grants were received by schools after half the financial year was over. In 2014, this was less than 50% of a reduced total (total being 80% of the Maintenance Grantand 68% of the School Development Grant).

In Nalanda, in 2012-13, till the month of July, schools received 5-6% of the three grants to schools. A larger chunk was released in September and then most in November – more than half way after the financial year was over. Thus making 20% of the Teaching Learning Material Grant, 15% of the School Development Grant and 29% of the SMG grant withdraw after the financial year.

This is something to think about as the money that we are speaking of funds basic classroom implements like chalk, dusters, electricity and drinking water.

From 2009-13, Nalanda received most of its funds for civil works between October and December leaving little to do thereafter. It takes approximately 15 months to build a classroom, not to mention the 3 months it takes to start work on that building.

This, (money not being received, being delayed, the unpredictability and lack of control) makes the idea of an active local participation in planning, allocation and monitoring moot. So while, for instance, in Nalanda in 2013, only 30% of the 99% SMCs in schools prepared an SDP; only in 67% of those 30% were SMC members involved in creating the SDP. You cannot help thinking, what the point might be?

Read more about our work with SMCs and the challenges in taking this foward in Part 2 of our blog – click here. 

Pritha Ghosh is Programme Lead: Strategy and Implementation, at Accountability Initiative. Her role is to develop a strategic implementation vision and plan for Accountability Initiative’s work at the state and district level with a view to ensure that Accountability Initiative’s research translates in to a reform agenda on the ground.


PART II: FIELD EXPERIENCE – NOT JUST ABOUT DATA

This blog is a continuation from Part 1: Engaging with PAISA 2015. It starts off with a recap of PAISA followed by my experiences on the field.

The PAISA 2015 survey at Accountability Initiative informed key research conducted on three prominent Centrally Sponsored Schemes (CSSs), Sarva Shiksha Abhiyan (SSA), Swachh Bharat Mission – Gramin (SBM) and the Integrated Child Development Services (ICDS). The survey is taken forward by our field staff, guided by learnings from the PAISA Course. Through this exercise, our research connects with not only data collected at the ground level, but also gaining significant insight on unquantifiable factors that facilitate or challenges our capacity in getting this information.   

As a part of the survey, I travelled to Madhya Pradesh in December 2015. My week in Bhopal began by collaborating with our team member, Swapna Ji, who was part of the field team and worked out of our Bhopal office as a Senior Paisa Associate. This provided me a great opportunity to learn several elements of our work being performed by our team of field associates on ground; an experience otherwise precluded by the nature of my work back in New Delhi. Since the field team is continuously engaged with different government officials at the lower levels of government, my conversations with Swapna ji revealed much about the day-to-day functioning of the frontline service facilities and various block and district level departments.

The volunteer training sessions were followed by the teams moving out in different directions to the sample list of villages in Sagar district allotted to them during the training. I, along with Swapna ji, also headed out to 2 villages to assist the teams in their initial data collection. My on-ground field experience was invaluable; it revealed the actualities of the functioning of the public service delivery mechanism which can’t ever be quantified in the data that I usually worked with on a daily basis. For instance, my interaction with the headmaster of a primary school consisted of him lamenting about the continued absence of several of the teachers in his school for months on grounds of election duty. A cursory look at the attendance register revealed how he had to send his teachers to village households to distribute the student entitlements owing to high levels of student absenteeism. Another conversation over chai with an Amma (generously offered and affectionately insisted upon by her) made me privy to the perils she had to face each day to defecate in the absence of a toilet facility in her house. In another village, I came across a community sanitary complex which explicitly prohibited certain castes of the community from using it. In another instance, an Anganwadi worker talked dejectedly on how the village households had to pitch in their own grains to feed the children in the centre as grains generally arrived with a month or two’s time lag. Walking through the lanes of these villages not only provided valuable context to the work I performed at my desk but also forced me to reassess several of my personal priorities and my general outlook of life.

While the volunteer teams conducted the surveys each day, Swapna ji and I looked at the data coming in to ensure that the data was accurate. The high dependence on the verbal responses from the frontline service providers and households on financial matters necessitated close monitoring of the data that was being collected. The use of tablet questionnaires greatly facilitated this process as we could look at the raw data coming, in real time. This enabled the team to continuously monitor the implementation of the survey and account for rechecks through manual logical checks or if needed, a revisit to the respondent.

I had embarked upon my first ever field experience of my professional life with the purpose to assist and provide support to the field team in Bhopal with training and conducting a primary survey. However, I returned with innumerable learning experiences which undoubtedly surpasses my contributions. AI’s foray into the sphere of conducting large scale PETS in the country to track fund flows contributes a unique perspective on the ground realities in the implementation of some of the flagship Centrally Sponsored Schemes (CSS) which are the means through which the government seeks to improve the status quo in the most important national priorities in the social sector. PAISA 2015 has been another successful venture by AI in its efforts to bring out interesting findings and contribute to the bigger policy debates surrounding the functioning of the key social sector programmes. The hard work by the team bore fruits in the form of published briefs which put together the findings from the survey with our research work. Personally, the entire experience of working for PAISA 2015 has been nothing short of overwhelming.

Priyanka Roy Choudhury is a Research Associate at Accountability Initiative. She works primarily with tracking fund-flows of Centrally Sponsored Schemes (CSS) on education, health and sanitation.


PART I – Engaging with PAISA 2015

On a relatively warm day with the sun surprisingly making its presence felt considering the last month of the year was upon us, I landed at the Bhopal Junction with a backpack,  my laptop and a book which had given me company during last night train’s journey from New Delhi. As I waited for my cab driver to arrive, I realised that the coming week would be an experience I was excitedly looking forward to ever since I joined Accountability Initiative (AI) 4 months back.

As part of its PAISA project, AI conducts extensive Public Expenditure Tracking Surveys (PETS) concentrating on understanding governance and fund flows in key social sector schemes. The overarching goal of this project is to use this social accountability tool to assess the manner, quantity and timing of releases of funds from the highest levels of the government to the frontline public service providers and beneficiaries. In the past, large scale PAISA surveys were concentrated on tracking fund flows in the flagship programme -Sarva Shiksha Abhiyan (SSA). However, this year the project encompassed 3 schemes within its ambit- Sarva Shiksha Abhiyan (SSA), Integrated Child Development Scheme (ICDS) and Swachh Bharat Abhiyan- Gramin (SBM-G). Geographically, the survey covered 300 villages in 10 districts spread across 5 states.

The sheer scale of the survey necessitated that both the Delhi team and field associates work together much in advance to prepare for the survey’s implementation. Thus, in the run up to the PAISA 2015 survey, the team was involved in varied activities ranging from preparing the questionnaire tools to selecting the sample villages to running extensive pilot surveys to test the tools. As a new member of the AI team and my first professional experience, I had much to learn. I dived into the deep end of the pool of work only to find support and guidance at every end. The decision to conduct the survey using tablets instead of the traditional paper based questionnaires meant that we were treading unchartered territories which brought along its own share of challenges and opportunities; PAISA 2015 was indeed going to be a new experience for the entire team at AI.

The survey was scheduled to be conducted simultaneously in all 5 states which was to be preceded by a 5 day volunteer training session in each of the states. The PAISA surveys see the participation of volunteers recruited from the states who are then given the context of the survey through foundational knowledge of public finance and trained on the nuances of conducting a survey. These training sessions also involved mock field visits to acclimatise the volunteers to the on-ground survey experience as well as the opportunity to try their hands with tablet enabled questionnaires.

Read Part 2 – Field Experience: Not Just About Data to learn more about the PAISA experience.

Priyanka Roychoudhury is a Research Associate at Accountability Initiative. She works primarily with tracking fund-flows of Centrally Sponsored Schemes (CSS) on education, health and sanitation.

Reforms in the Education Bureaucracy

The issue of quality in education has caught the attention of the nation like never before. Politicians and lay persons alike are raising questions around classroom transactions, learning levels of students and learning outcomes. In his most recent national address, the Prime Minister also emphasised the importance of shifting the governments’ attention from schooling to learning.[1] But while the policy level rhetoric seems to be pointing in the right direction, translating words into actions is an altogether different ball game.   

Our research in unpacking the functioning of the education bureaucracy has taught us some big lessons about the way the “education system” works.[2] If improving learning outcomes is a key objective of the Education Department, then the following factors should be viewed as obstacles on the path of creating an optimum institutional environment to achieve this goal.     

Obstacles

  • “Status quo-ism”: Looking at the education bureaucracy we learnt that the work culture is geared towards maintaining the status quo, no matter how dysfunctional or detrimental the status quo may be. Priority is given to keeping files and formats in order and rule compliance over substantive matters like assessing and improving teachers’ teaching abilities. Moreover, there is negligible reflection on the wealth of data being collected around learning outcomes.
  • Degrees over aptitude: Professional degrees rather than the lived experience of individuals appear to carry more weight in the system. This is reflected in the recruitment processes that sort candidates primarily on the basis of their educational qualifications rather than aptitude or problem solving skills in their field of work.
  • Approach towards capacity building: No one is more sensitive to the issues of capacity and unresponsiveness in the bureaucracy than the administrators themselves. Thus calls for capacity building and increased monitoring are frequently made by officials posted at different levels (note that the calls for capacity building and increased monitoring are almost always directed towards subordinates). These are stock responses of the administration. Moreover, when it comes to implementing the training sessions and conducting monitoring, it is not uncommon to see administrators work the same way they perform paperwork i.e. mechanically. The objective of a training session is to improve the functional capacity of those partaking in it. But this gets diluted in the system wherein people are held accountable for the minimum criteria of making sure a training session is conducted rather than the quality of the session or following up with participants. Monitoring is also equated primarily with the idea that an external person’s presence would create fear in the worker leading to better performance.

One could interpret the approach of monitoring, capacity building, and the mechanical prioritisation of degrees as symptoms of the “status quo-ist” nature of the education bureaucracy. To continue this story, my next blog will discuss some of the lessons learnt from our observations and interactions with bureaucrats themselves which carry the seeds of solutions that could break this detrimental equilibrium.  

A good starting point is to learn from the bureaucracy itself. Outliers are not as rare as we might think. Occasionally we come across teachers and administrators at different levels who are managing to do their job in both letter and spirit in this very environment. How are they able to do what they do in a system that seems to resist breaks in the status quo? 

  • Aligning goals and expectations: By studying the implementation process of a Bihar based government programme[3], we learnt that organisational culture plays an important role, if not more, than the design of a programme. The programme in question was aimed towards improving learning outcomes, and for a short span of time, the same people who seemed to resist change were able to gear up and deliver positive results. What happened in this case? We learnt that results are achieved when goals, actions and performance expectations of all education officials are aligned. During the programme’s active phase, improving learning outcomes was stated as the number one priority of the education administration.  
  • Leadership matters: The nature of the leadership embodied by relevant stakeholders must be “transformational” rather than “transactional.” During the programme’s active phase, leaders i.e senior officials led by example, inspired workers to look beyond their own self-interest, promoted cooperation, and allowed and enabled workers to be innovative. This was a departure from the status quo where leaders promoted rule compliance and prioritised paperwork over other factors. 
  • Involving more stakeholders in problem identification and resolution: We  learnt that including frontline education officials (who have to implement the programme) in the process of identifying and articulating problems as well as looking for solutions to the problems does wonders in creating a greater feeling of ownership and directly impacts the skills of everyone in the process.

Keeping the system going versus keeping the system growing

These lessons emerged from our study of a programme that was being implemented in “mission mode.” In the government, a programme being implemented in mission mode simply means that extra resources including human attention are diverted to achieve time-bound goals. When the pace of functioning and attention given to one programme inevitably goes down, initial gains may retract. This happens when less or no thought is put in to figure out ways to sustain the momentum, at least on few ends, once the initial flurry of activities subsides.

One way to keep the momentum going is to identify and articulate one or few clear problems, and give the authorisation to relevant people to experiment with different solutions. If capacity is an issue then capacity building could also be done in a more targeted way as a result of this approach. In other words, the implementers could get trained on the skills needed to apply the solution they have come up with (a common grouse of officials is that trainings are usually quite generic. This would address that issue). Enough time and space should be given to those involved in the problem solving to learn through hit and trial, with adequate support provided by trained resource persons, such that growth is incremental. The ‘monitors’ of those who are involved in the experiments should be empowered to give the implementers space and be tolerant of failures in the areas where they are learning.

Adopting this approach would also result in a fundamental shift in the way people perceive the system – from one that is geared towards upholding the status quo to one that takes stock of what it already knows and builds on it such that the system is geared towards growth.    


[1] PM’s national address dated 24th April 2016. http://www.newindianexpress.com/nation/Government-Should-Focus-on-Quality-Education-Modi/2016/04/24/article3397716.ece

[2] In this blog I have primarily referred to the broad lessons learnt through our analysis of Mission Gunvatta – a Bihar based programme aimed at improving teaching learning outcomes. The full working paper can be accessed here: http://accountabilityindia.in/understanddownload/1245

[3]In this blog I have primarily referred to the broad lessons learnt through our analysis of Mission Gunvatta – a Bihar based programme aimed at improving teaching learning outcomes. The full working paper can be accessed here: http://accountabilityindia.in/understanddownload/1245

Deconstructing A New Era in Fiscal Devolution in India

The Accountability Initiative (AI) at CPR has conducted extensive research on fiscal devolution in two separate studies—one that focuses on the effects of the Fourteenth Finance Commission recommendations on state finances, with a particular focus on effects on social sector investments. And a second study that focuses on understanding the fiscal devolution to rural local governments through a case study of fund flows to Gram Panchayats in one district in Karnataka.

Findings from the studies will be shared at a seminar on 3rd June with several stakeholders, including from the government of India. In the run-up, Yamini Aiyar, Avani Kapur, and Padmapriya Janakiraman from AI share their insights (below) on the importance and relevance of these studies, providing a glimpse into critical findings.

Is fiscal devolution a brave new move by the current government?

Yamini: As you know fiscal devolution means devolution of power and responsibilities from national government to sub-national governments. Constitutionally, the government is mandated to set up a Finance Commission (FC) every five years to determine the share of financial resources between the union and the state governments.

In 2013, the government constituted the Fourteenth Finance Commission (FFC). The FFC recommendations, accepted by the Government of India in February 2015, are an attempt to re-align the constitutionally mandated responsibilities of state governments’ with adequate financial resources. To do this, the FFC recommended enhancing tax devolution (of the pool of resources shared between the centre and the states) to state governments from 32 per cent (Thirteenth Finance Commission) to 42 per cent from the years running 2015 through 2020.

There is a long standing precedent that the government of the day whole-heartedly accepts the recommendations of the Finance Commission. However, it must be said that there was a dissenting note that suggested a slower approach for devolution in the FFC report submitted in February, 2015, but the government chose to overlook that.

So while in its implementation the fiscal devolution being undertaken by the current government is new, it is to be noted that this was not a move made by the government, but was recommended by the FFC.

Can you tell us more about the research undertaken by the Accountability Initiative (AI) on fiscal devolution?

Yamini: In 2015 after accepting the recommendations of the FFC, the Government of India presented its budget. In its budget presentation, in order to create the fiscal space to enhance tax devolution to state governments, it significantly cut down funds provided to states through Centrally Sponsored Schemes (CSS).

Let me explain how this works—there are different modes through which money is transferred from the Government of India to the states: i) taxes (determined by FC); ii) grants and aid (determined by FC); iii) central assistance to states (determined by the erstwhile Planning Commission, and now coordinated by the line ministries). Central assistance is essentially money tied to priorities identified by the centre, with mechanisms for implementation also largely identified by the centre. Over time, these became a critical source of financing social policy in India.

So what the government has done in the budget is to reduce the funds provided through central assistance (primarily CSS) to enhance tax devolution. While the cuts makes sense constitutionally, since the constitutional responsibility to provide services funded through CSS lies with the states, in practice over the last decade, a large number of these functions were re-appropriated by the centre. So in cutting back the CSS, the centre, in theory, gave the states the choice to prioritise funds the way they would like to in line with their constitutionally aligned responsibilities.

Yet, the move raised an important question. Key social sector services in India, are in many ways, a national responsibility, includingeducationhealth, social protection etc.  And it is the Government of India, which has signed up to the global Sustainable Development Goals to ensure these are nationally realised. So the question raised was how does one ensure that these national priorities are fulfilled if the centre is not financing these key activities (through CSS)? In addition, many state governments too began worrying if the cuts in the CSS would have a significant impact on the fiscal space available to them to invest in the social sector programmes? 

In order to answer these questions, we decided to examine state budgets so as to understand what is actually happening at the state level. It is important to say that given the vagaries of how budgeting takes place in India, the true picture of the investment pattern in this changed scenario will only come to light a few years down the line, because the Government of India and the state governments report on actual expenditure at a two-year lag . Moreover, it is important to take a long term view on such foundational changes to the country’s fiscal architecture.

Therefore the results of our study must be seen as indicative rather than definitive, and it is also important to note that the process of transition will always have teething problems. In that sense the findings are a sign of how states are beginning to adjust to the changed devolution. They also provide us a benchmark with which to track state expenditure over the remaining period of the FFC implementation, so that we have evidence with which to debate the effects of devolution four years from now.

Can you share key findings from the examination of these state budgets in light of the questions raised?

Avani: We studied state budgets from 19 states, and interestingly, despite initial reservations, here is what we found:

  • All 19 states saw an increase in funds transfer, which means that the cuts in CSS were offset by the increase in tax devolution.
  • Further, even as the centre cut back on funds through the CSS, throughout the year, the Government of India passed a number of supplementary budgets. Consequently, in effect there was no significant reduction in the amount of funds traditionally transferred through CSS; in fact most states saw an increase compared with the previous financial year.
  • At the all India level, union government transfers to states saw an increase of less than 1% of GDP between 2014-15, and the 2015-16 revised estimates. When we studied it state-wise, all states received at least 20 percent more from the union.
  • Importantly, we have not seen any drop in expenditure on social sector schemes in these states.

You also conducted a study on fiscal devolution to local governments, especially Panchayats. Can you tell us more about this?

Yamini: The devolution story in India began with the path-breaking 73rd and 74th constitutional amendments (in 1992), when the Parliament committed India to devolving significant powers and responsibilities to a third tier of the elected local government. Over the years, anyone who is familiar with the evolution of the local government system in India will be aware of the fact that the actual devolution of key powers and resources, commonly referred to as the funds, functions, and functionaries, has been limited at best, leaving Panchayats and local municipalities with very little authority and financial resources to fulfill their constitutional mandate.

Despite this, there is very little empirical data that can actually tell us what is happening at the Panchayat level as well as at the local municipality level. More importantly, the key stakeholders (the elected representatives) themselves have very little idea of what powers and resources should be devolved to them, and what actually does get devolved to them.

To address this problem, we began in 2014 a micro-level analysis of trends in fiscal decentralisation to rural local governments (Panchayats) in the state of Karnataka.

Can you share key findings of this micro-level analysis in Karnataka?

Padmapriya: Through a detailed exploration of the Karnataka state budget and an expenditure tracking exercise that focuses on 30 Gram Panchayats (GP) in Mulbagal Taluka, Kolar district, this study tracks trends in fiscal decentralisation in the state, and attempts to identify the specific quantum of monies spent in the jurisdiction of Gram Panchayats contrasted with the money that Gram Panchayats actually receive.  Here is what we found:

  • A significant proportion of money that should be devolved to Panchayats is in fact appropriated by the state government. To explain this further—the total budgetary allocation for Karnataka in the Financial Year (FY) 2014-15 was Rs 1, 50,379 crore (Budgeted Estimates). Based on an analysis of functions devolved to Panchayati Raj Institutions (PRIs), as mandated by the Karnataka Panchayati Raj Act 1993, our study estimates that approximately 33% of the total budget ought to have been devolved to PRIs. However, in actual fact, the state budgeted an allocation of only 17% of its total budget for expenditure by PRIs.
  • Consequently, Gram Panchayats are accountable for a miniscule proportion of the total monies spent in their political constituencies. Our survey found that the average expenditure (including all administrative and Panchayat activity) within a single GP in Mulbagal in FY 2014-15 was approximately Rs 6 crore. However, only 3% or Rs. 20 lakh of this amount was spent directly by a GP.
  • Worse, GPs are unaware of the nature and extent of funds spent in their own jurisdiction. This makes it impossible for GPs to track and hold authorities accountable for such expenditure.
  • Finally, even money that GPs are expected to receive directly from the centre into their accounts are being slowly re-appropriated by the state.

You then took the findings of this case study in Karnataka back to various stakeholders. Can you share their responses to it?

Padmapriya: We shared the findings with: i) policy makers at the state government level, ii) Gram Panchayat Unions in Karnataka; iii) the Ministry of Panchayati Raj at the centre. At all levels, the response was very encouraging:

  • At the state level, the planning department, finance department, and the treasury have responded proactively by taking some of our recommendations on board, including tracing all the expenditure at the location where it occurs, which will help in aggregating data to a GP.
  • The Gram Panchayat Unions had never been given information of this nature. About 16 Gram Panchayats from North Karnataka have now come forward to do a research of this kind thus enabling them to track expenditures in their jurisdictions.
  • The Ministry of Panchayati Raj was very receptive as well, and we are in conversation with them to explore if such a study can be replicated in other states.

On Backwardness and Special Status – part 2

My previous blog outlined the manner in which funds are transferred from Government of India (GOI) to states and the need for a fresh approach in transferring funds in the context of changing centre-state relations. In May 2013, GOI had set up a six-member Committee headed by Raghuram Rajan (now RBI Governor) to develop a measure of development or (under) development. The Committee released a Composite Development Index in September 2013. This blog presents a summary of the index by laying out the objectives, methodology and finally the resultant shares of fiscal transfers from GOI to respective states.

Objective

There are two main objectives of the index. First is to propose a general method for allocating funds from GOI to the states based on both a state’s development “need” as well as its performance. Second, by categorizing states into relative degrees of (under) development- “least developed,” “less developed” and “relatively developed”- the index provides a benchmark by which GOI could consider offering additional forms of financial assistance to states that are particularly underdeveloped.

Methodology

As mentioned above, the index is a combination of a number of indicators representing a state’s “need,” based on geographical, income and human development indicators as well as its performance. While a state’s need was given a 75 percent weight, performance constituted 25 percent. The step by step methodology is given below:-

Step 1: Determining a State’s “Need”

The index measures need through a composite index of 10 indicators each assigned an equal weight. These were: (i) monthly per capita consumption expenditure, (ii) education, (iii) health, (iv) household amenities, (v) poverty rate, (vi) female literacy, (vii) percent of SC-ST population, (viii) urbanization rate, (viii) financial inclusion, and (x) connectivity.

Each state is assigned points based on their relative need, such that less developed states would rank higher on the index, and thereby get a larger share of allocations. Further, in order to ensure those particularly in need get a disproportionately higher share of resources, the underdevelopment scores are “squared” (see formula below).

Step 2: Accounting for State Size

In order to allocate more to underdeveloped states with large areas but small populations, weights were assigned to a state’s share in population (80 percent weightage) as well as its share in area (20 percent weightage).

The formula for need is thus given as/by:

(0.8* state’s population share + 0.2 * state’s area share)* [(under)development index for the state]2 

Step 3: Accounting for Performance

The committee recognized that need alone is an incomplete measure. A state’s ability to absorb and spend funds is affected by its administrative capacity. In a poorly governed state, additional resources may not reach a majority of the population nor have the desired impact. Further, if underdevelopment ensures a greater share of resources, looking at need alone could create a perverse incentive for states to not develop,. The index thus added a component of performance measured as the improvement in a states development index over time (i.e. a fall in underdevelopment).

The formula for performance is thus:

points to the state based on need * change in (under)development index for the state * performance weighing parameter

Step 4: Identifying the Constant – or the Basic Minimum

Finally, recognizing that all states require a basic minimum to meet fixed expenditures such as administrative costs, the committee assigned a fixed basic allocation for all states. Given that there are 28 states included in the index – the committee determined 8.4% (or 0.3%*28) as the fixed allocation.

The formula thus is: –

% share of a state to the total GOI allocation = 0.3% (i.e., the fixed allocation) + % share of a state based on need + % share of a state based on performance.

Comparison with other methodologies

The index has a number of interesting innovations when compared with previous methodologies.

First is the use of monthly per capita consumption expenditure (MPCE) as opposed to a state’s per capita income. The rationale for using MPCE data was that the value of the underdevelopment index for a state should represent the need of an average individual in the state which may or may not be related to the state’s per capita income. For instance, the presence of a large number of registered offices of corporations in a state like Maharashtra or Karnataka, may increase the states’ per capita income but average household consumption may still be low. While the use of MPCE was debated within the committee,[1] it is an interesting attempt to measure the income actually available for an individual household.

Second, while the focus on performance is not new (the Gadgil formula includes components of a state’s fiscal performance), the index gives a higher weightage to performance than some of the previous methodologies. In fact, an important feature of the formula used is that since performance is multiplied by need – the formula rewards underdeveloped states more for an improvement in the index.

Finally, the methodology attempts to introduce a system of proportionate but non-linear share of allocations. For instance, by giving proportionate to need the formula takes into account changing trends over time such that over time a state may get a greater or lesser share of allocations over time. Moreover, by “squaring” the points a state gets on the need criteria – the methodology ensures that those in greater “need” get a higher share of resources.

Findings

As mentioned earlier, the index ranks different states based on their relative degree of (under)development.[2] Accordingly, Odisha ranks 1 in terms of underdevelopment, followed by Bihar and Madhya Pradesh. In contrast, Goa, Kerala, Tamil Nadu, Punjab, Maharashtra and Uttarakhand are amongst the states which are relative more developed. Table 1 below outlines the rank of the different states based on the underdevelopment index. (See Table 1 for more details)

Table 1: Relative Degrees of Development: Ranking of States


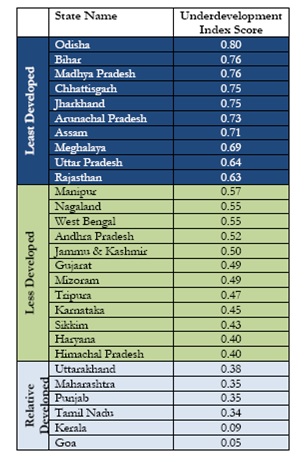
Table 2 shows the share of allocations for each state based on this index, which are then compared with allocations received through the Planning Commission and Finance Commission grants. On average, each state gets 3.6 percent of allocation of funds. However there are significant variations ranging from 0.3 percent to as high as 16.41 percent. In fact, according to this formula, 7 of the poorest states of the country—Bihar, Chhattisgarh, Jharkhand, Madhya Pradesh, Odisha, Rajasthan and Uttar Pradesh—will corner 60.56 per cent of the Central allocation under the new formula.

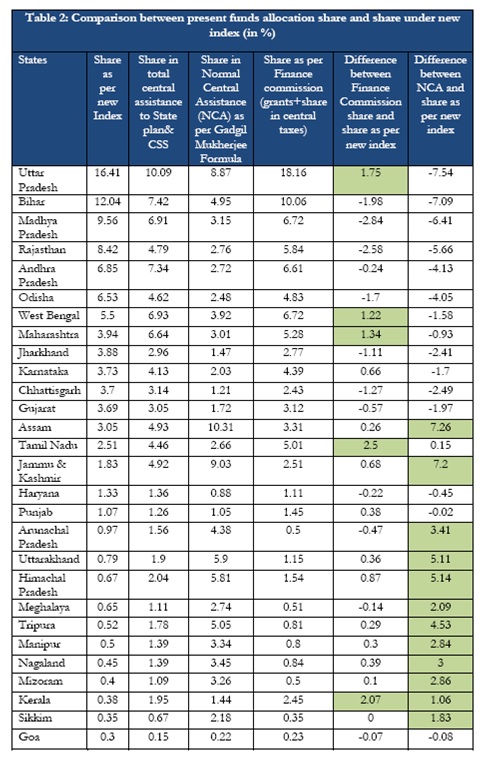
Relative to the Finance Commission formula, only five states, namely Uttar Pradesh, West Bengal, Maharashtra, Tamil Nadu and Kerala lose one percentage point or more of their share. In contrast, compared to the Gadgil Mukherjee Formula, 12 states lose more than 1 percentage point with 4 of them losing more than 5 percentage points.

As one can see, the index is based on a combination of factors – a state may do better in terms of one measure but not with respect to another. For instance, based on the index, Uttar Pradesh gets the highest share based on both need and performance, followed by Bihar in terms of need but not in terms of performance. Andhra Pradesh, on the other hand, gets a significantly high share based on performance but not as much on need. When measured in relation to population,  Arunachal Pradesh, Odisha, Chhattisgarh and Meghalaya, receive the highest based on need; whereas Rajasthan, Odisha, Jammu and Kashmir and Sikkim get the highest shares based on performance.

Conclusion

The findings of the index have raised a lot of debate. While some states stand to gain by this methodology, others such as Kerala, Goa, Sikkim and Assam, would lose in terms of a decreasing share of GOI allocations. The recommendations suggested in the Report are currently being examined by the Government.[3] The 14th Finance Commission, too, will be coming up with their report later in the year. Whether the composite development index methodology or some part of it will be used in determining the transfer of funds remains to be seen. If nothing else,the report has been successful in reigniting the debate on the need for a new criteria. 

All information on the index is available online at: http://finmin.nic.in/reports/Report_CompDevState.pdf


[1] A note of dissent by Dr. Shaibal Gupta is available in Appendix 7 of the Report..

[2] States that score 0.6 and above on the index  were categorized as “least developed” states. States that score below 0.6 and above 0.4 as “less developed” states, while states that score below 0.4 as “relatively developed” states.

[3] PIB Release, Criteria for Central Assistance, 13/12/2013

Conditionally Yours: Cash Transfers and School Attendance in Bihar

Student attendance in government schools in Bihar has been low for some time.[1] The Government of Bihar (GoB), with a view to boost attendance in its schools, decided that only those students who have at least 75% attendance in the period of April to September, would be eligible for various entitlements, such as money for uniforms, cycles and scholarship. The academic year 2012-13 was the first year in which this policy was introduced. A couple of our blog-posts last year had looked at the implementation of this policy at the school-level (see here and here). In a nutshell, there was much confusion on the ground about eligibility and distribution, with massive protests from parents and students. Overall, however, most teachers and administrators at the time claimed that such a condition on entitlements was necessary to get children to stay in school.

GoB decided to continue with this policy for academic year 2013-14 as well. All government schools were supposed to distribute cash to eligible students on the designated day, during December 16 to December 31, 2013, as decided by the District and/or Block officials. We conducted some preliminary field-work in Nalanda and Purnea to understand implementation at the school-level, given what we had seen last year. This blog post presents some of these initial findings.

Campaign Planning and Organisation

The biggest challenge faced last year was that schools did not have enough time to prepare the new beneficiary lists, communicate the new eligibility norms to parents, and hold distribution camps systematically.

In light of these problems, in 2013-14, Government Orders were issued by the State at the beginning of September 2013 to inform district and block administrations about the campaign to be held in December, as well as the preparation required for it. SSA devised specific formats in which beneficiary lists and demand for funds were to be submitted by schools to the block officials. These were given to headmasters by September, and were submitted at the block-level by early October in most cases. By November, several districts had prepared panchayat– or cluster-wise schedules for holding distribution camps. General information as well as campaign dates were published in newspapers across the state. Teachers and headmasters had also been instructed to give periodic information about norms to students and their parents.

Fund Flows

In 2012-13, there was huge rush to distribute funds in a campaign mode, and district administrations and schools had little time to prepare adequately.

This year, as with beneficiary lists, the demand for funds was submitted in the formats provided by SSA, and only the amount demanded was transferred to school bank accounts. This was crucial since last year lump-sum amounts were sent to schools according to the number of students enrolled rather than for those eligible. In cases where more money than required was sent, getting it back became an issue. District and state officials revealed that even by December 2013, not all schools had submitted their UCs or returned the money in whole. Such a problem is not expected to arise this year.

Distribution during Camps

The actual distribution of funds during camps held at schools has been much more streamlined than in the previous year. Most schools have distributed funds class-wise and at specific times, either in separate classrooms or at separate distribution counters set up within the school premises. This minimised chaos on the day of the distribution.

Monitoring

The local police was observed to be doing the rounds to maintain peace during the campaign. Block and cluster officials also came to monitor how camps were being conducted each day; however, this varied from block-to-block. The frequency of visits by district officials was much lower, close to negligible, at the time of observation in late December.

So broadly, one does see an improvement in the overall planning and management of this massive exercise. But this year also threw up quite a few challenges.

Confusion over Scholarships Norms and Data Collection

This year, until mid-December, there was much confusion over eligibility for the scholarships given by Department of Welfare. Generally, the scholarships are given to the children belonging to SC, ST, BC-1 and BC-II households. This year, however, there was some talk that more students would get the scholarships. Only in mid-November did the Bihar Cabinet pass a resolution that “General” category girls would also get scholarships. Incorrect interpretations of the Cabinet’s decisions in early December led to further chaos, as schools and parents really did not have clarity on who was eligible and who was not. Moreover, rather than the Welfare Department collecting scholarship beneficiary lists, SSA was asked to do that. All scholarship data was supposed to be submitted to the State by December 7, admittedly unrealistically. Given such delays in planning, there were clear adverse consequences on the fund flows for scholarships.

Problems in Fund Flows

Many schools reported not receiving money in time. One major reason cited for this is the staff shortage at the bank level as well as liquidity crunch at rural branches, leading to delays in transfers to schools. Additionally, given the confusion in December over scholarship norms and eligibility as mentioned earlier, funds for scholarship from the Department of Welfare have yet to reach a majority of schools.

Problems in Distribution during Camps

In almost all schools we visited, parents were observed protesting that their child should also be given the benefits. They all had prior knowledge about the 75% minimum attendance requirement, but their main bone of contention was that their child’s attendance had not been taken properly during the year. Teachers responded to this by telling parents that they should come and monitor attendance more often.

As per norm, vouchers or receipts indicating purchase of uniforms must be shown in order to receive the funds. However, this verification was not done systematically in each school and was left to the headmasters’ discretion. Our surveyors also reported that funds were distributed to children who did not have the requisite attendance rates – either to placate community members or out of fear of repercussion from influential local leaders.

The distribution of remaining funds (i.e., scholarships) would not be done via camps, but would be distributed by teachers in the school as and when funds are received.  It is not yet certain by when this distribution would be completed.

What is of most interest is that attendance registers on which this entire entitlement distribution is conducted, don’t receive much attention. District and State Officials categorically stated that there was no time to verify the registers or the beneficiary lists submitted amidst all the other tasks. Given the allegations of parents, complete lack of trust between parents and school officials, and increasing awareness levels among parents, it is imperative that the administration enforces better – and more regular – monitoring of attendance registers. Regular and open communication, through enforcing the mandatory weekly parent-teacher meetings and monthly SMC meetings, would go a long way in establishing this trust and creating confidence among parents to ensure their children come to school.


[1]It has been less than 60% these past few years according to ASER. 

New ways of conducting field surveys: Computerised data collection and responsive survey design

In November, I went for a talk at NCAER on “Computerized data collection and the management of Survey Costs and Quality” by James Wagner and Nicole Kirgis from the University of Michigan. The abstract of the talk stated that it would cover topics like responsive survey design, survey biases and ‘paradata’. Now, usually, I am quite wary of talks where I don’t understand 50% of the abstract. However, this talk turned out to be quite interesting and useful.

As most of you know, a lot of the PAISA work that AI does involves extensive surveys of schools in our PAISA districts[1]. To carry out such large scale surveys, we mobilize a team of 35-50 local volunteers who visit around 140-150 schools in each district. This process involves a number of monitoring and rechecking exercises at various levels to ensure that data collection is of the highest quality. What I learnt from the talk was that responsive survey design and ‘paradata’ can help in ensuring that this aim is achieved more efficiently.

So what exactly is responsive survey design?

A responsive survey design pre-identifies a set of design features which can affect survey costs and statistics, monitors them through the process of data collection and makes changes to features of the survey if required. The survey administrator is able to respond to the data being collected while the survey is being carried out thereby ensuring that mistakes are being rectified almost simultaneously[2]. For example, if we are doing a survey of 100 individuals between the age of 15-50 and out of this 10 people are in the age group of 15-20. However, when we conduct the survey, only 5 of these people consent to do the survey. The results of this data, would thus, suffer from a non-response bias because of a higher non-response in a specific category, which would lead to biased estimates. Similar problems could arise for specific questions as well, for example if there is a question about maternal health, certain sections of the society may not be comfortable responding to them. In a standard survey design, the survey would first have to be completed, compiled, data entered and then analysed before the administrators would see such trends emerging, which would make responding to these problems difficult. To overcome these issues, survey administrators can employ a responsive survey design through computerized collection of data.  This design would allow the administrators to skip the compilation and data entry stage, and start analyzing the data straightaway.  The main survey team can then monitor the process from a distance and check if there are certain sections which are not responding. If required, the surveyors can be instructed to conduct more follow-ups with such groups and try and correct this problem[3].

Paradata, which is the administrative data about the survey such as the time taken to survey, number of visits required to complete the survey etc., can be very useful at this stage. When we use a computerized form of data collection, we can automatically monitor the surveyors on various parameters like how many times did the surveyors follow-up with the respondents? How much time did they spend on a survey? Whether they had to go back to an earlier question while administering the survey etc. Thus, we can actually check if the surveyors are making that extra effort towards the sub sample where non response is higher. Softwares such as SurveyTrak[4] are easy to use for this purpose and they automatically generate a lot of useful paradata for the survey administrators. These softwares also allow us to record how the surveyors are introducing themselves and asking questions. This can be very handy during training as we can identify volunteers who need more support.

Along with reducing survey biases, this design can cut down on the cost of transporting the survey tools and getting the data entered. This method would further allow a centralized monitoring of the survey with the survey data and the paradata being generated in real time. Furthermore, since this process does not have to go through a data entry phase, the analysis can start almost simultaneously with the data collection. This would allow analysts to notice certain trends while the survey is still in the field and conduct any follow-up/corrections on this, if required. Finally, it allows surveyors to communicate directly with the team and leave comments which can be useful during the analysis.

However, there are some limitations to this. Firstly, the volunteers would have to be equipped with either laptops or other mobile devices to carry out the survey which would result in increased costs. Secondly, training volunteers to use this technology may also require a longer time and monetary investment. Thirdly, the low penetration of internet facilities in India would slow down the process as there would be a time lag between collection and upload of data. Finally, replicating this model in a national survey in India could be difficult as the software would have to be available in multiple languages, which may increase the costs significantly.

Any organization looking to take up such survey models will have to consider these factors and ascertain which cost model works best for them. The total sample size and the length of the survey would be the most important factors while deciding whether this investment is viable. However, looking at the benefits involved, any survey design should definitely consider this approach before proceeding.


[1] Our PAISA reports can be found here http://www.accountabilityindia.in/paisa_states The PAISA states are Andhra Pradesh, Bihar, Himachal Pradesh, Rajasthan, Madhya Pradesh, and Maharashtra.

[2] Such a design is currently being used in the National Survey of Family Growth in USA. For more details check out Wagner et al, 2012, “Use of Paradata in a Responsive Design Framework to Manage a Field Data Collection”, available at http://www.jos.nu/Articles/abstract.asp?article=284477

[3] For more such applications and a stronger theoretical framework for this survey design check out- Groves, Robert M., and Steven Heeringa. 2006. “Responsive design for household surveys: tools for actively controlling survey errors and costs.” Available at www.isr.umich.edu/src/smp/Electronic%20Copies/127.pdf

[4] You can find out more details about the software at http://www.surveytrak.com/