

Mapping for local accountability
13 October 2011
We at Transparent Chennai were looking to increase the availability of information available about the performance of individual elected representatives in office, particularly of ward councilors. But how can you best do that?
At the MP and MLA level, individual legislators are rarely associated with particular bills, and voting happens almost exclusively along party lines. As a result, when most organizations collect information about the performance of elected representatives, they look at other pieces of available information: their attendance in the legislative council or assembly, the number and kinds of questions they asked while they were there, and their spending from their local development funds. Ward councilors are slightly different: in Chennai, they propose resolutions usually related to issues affecting their constituency that are then approved by the Council and implemented.
However, we realized that simply collecting information about resolutions, questions, and attendance, did not tell us the entire story about a ward councilor’s performance. We were also interested in outcomes – how did the ward actually fare under their leadership with respect to urban services?
This is a hard question to answer because of the paucity and inconsistency of data available to connect a legislator’s performance with outcomes at the constituency level- especially those of the city and the ward (High Powered Expert Committee 2011, 45). Official statistics on most aspects of city life, such as access to sanitation, extent and quality of sidewalks, slums, and public health are incomplete, and almost never disaggregated to the ward level. Even when data is present, it is often skewed as it fails to record (or even acknowledge) the deficiency in urban services to many of the city’s residents because they are seen to exist in the realm of the ‘informal’; like residents in a slum (see Roy 2009, High Powered Expert Committee 2011, 45).
This is why Transparent Chennai started the Ward Accountability Experiment, where we are using citizen efforts to create data about issues in urban services at the ward level, data that could potentially be used to hold elected representatives accountable for making improvements (Cavill & Sohail 2004, see also Blair 2000).
We began our efforts in a single ward. Each Saturday this September, nearly a hundred volunteers from civil society groups and colleges throughout the city walked around the streets of ward 176 (formerly ward 152 and parts of 151) in the southern part of the city, to capture data about three kinds of outcomes: public sanitation, garbage collection, walkability. We used paper maps and pencils to mark locations of piles of garbage and measured their size, and marked the locations of dustbins and whether they were usable. We found public bathrooms, and recorded their conditions. We also evaluated the road’s walkability, marking locations of broken sidewalks and problems with crossing the street. We also took photographs and videos, and filled out quick surveys to supplement the information in the map. During the survey, we also tested a mobile-app built for us by a local company to see whether GPS readings from it were accurate enough for wider use as a tool for documenting civic issues.
We also took photographs and videos, and filled out quick surveys to supplement the information in the map. During the survey, we also tested a mobile-app built for us by a local company to see whether GPS readings from it were accurate enough for wider use as a tool for documenting civic issues.
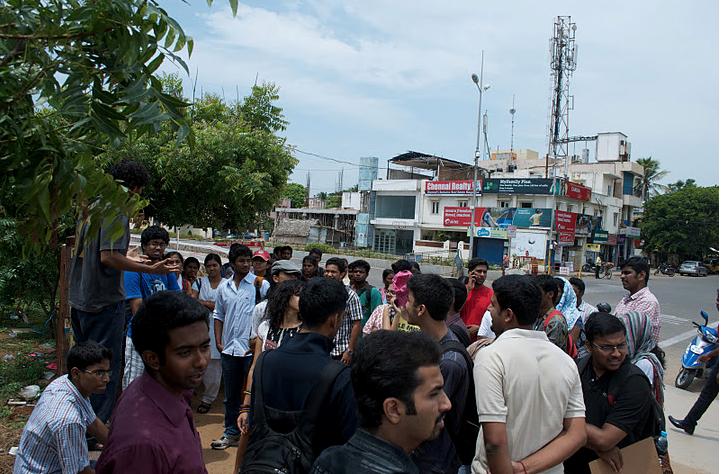
Picture1 : Students volunteers gathering before a mapping session
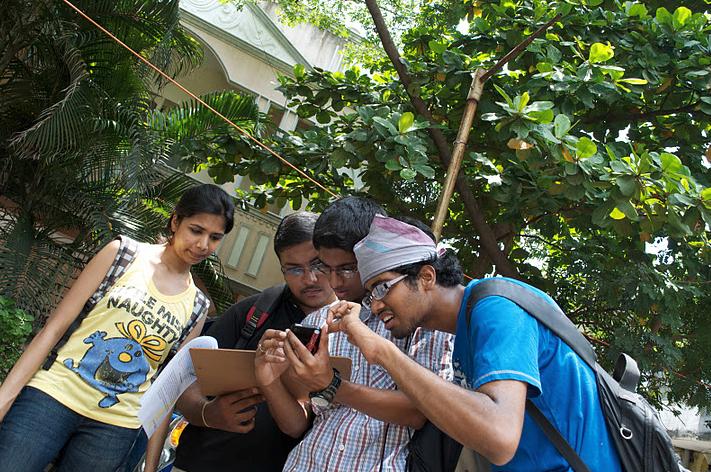
Picture 2: A group of volunteers testing a mobile phone application
The volunteer team worked with Transparent Chennai to digitize the data, converting it from paper to spreadsheets and digital maps that could be analyzed.
The experiment yielded strong data that underscored some of our suspicions about local conditions. 40 of 111 (36%) dustbins on 87 roads that we covered were unusable, and piles of garbage were most prevalent in the poorest parts of the ward. Only 2 of 11 public toilets met basic standards for usability (they had water, lights, and did not have any blockages). And only three out of the twenty roads that we surveyed scored well on walkability, while the rest required improvements.
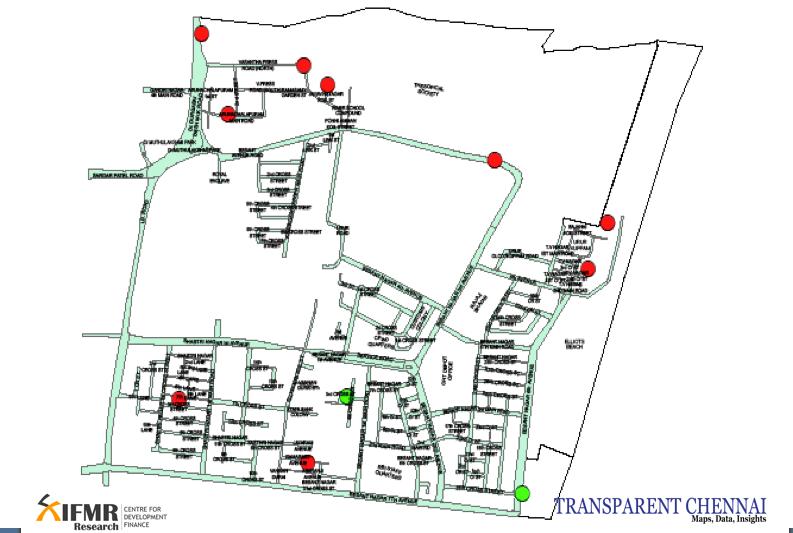
Picture 3: A map showing public toilet facilities in the ward- those marked in green were deemed useable, while those in red were found to be unusable
At the end of the process, we held a public meeting where we invited all the candidates for ward councilor, as well as residents from the ward. We shared the data and analysis with attendees, and invited councilor candidates to share with us their plans for the ward. Candidates came from four parties, the BJP, AIADMK, Congress and the DMK (although the last candidate came far too late to contribute to the meeting). All of them promised to take action based on the information, but both residents and press covering the event expressed skepticism about their ability and willingness to follow through on their promises.
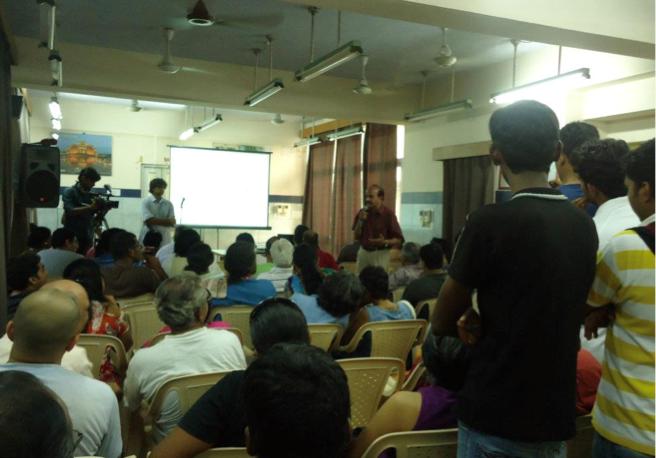
Picture 4: A resident reflecting on the experiment during the public meeting
We plan to repeat the exercise again in 6 months to see whether the elected councilor held to their promises, and a number of the local residents who came to the meeting committed to participating in the survey next time.
For the mapping, we used low-tech paper maps, so anyone can use these tools, not just those who have access to smart phones and are familiar with the Internet. We believe that this is a crucial element to making these tools inclusive. Using our experiences from the Experiment, we will be refining the methodologies, and making them available in the form of Toolkits in both English and Tamil on our website. Our hope is that we will be able to assist volunteers from many other wards carry out similar exercises locally.
The Transparent Chennai team was overwhelmed by the enthusiasm of the volunteers, who came week after week to map local conditions and to digitize data.
But what we are most excited about is the promise behind the experiment – that citizens can actually come together and create the data they need for greater accountability of elected representatives.
Data is powerful, and what we like about the possibilities that participatory mapping has opened up for us is that anybody can easily use these tools, either with or without Transparent Chennai’s support, to create information about the city. The ability to create data levels the playing field between government and citizens, and enables citizens to take more control over their local conditions
References:
Blair, H 2000, ‘Participation and accountability at the periphery; democratic local governance in six countries, World Development, Vol. 28, No. 1, pp. 21–39
Cavill, S & Sohail, M 2004, ‘Strengthening Accountability for Urban Services’, Environment and Urbanization, vol. 16, No. 1, pp. 155-170
High Powered Expert committee 2011, Report on Indian Infrastructure and Services, High Powered expert Committee.
Roy, A 2009, ‘Why India cannot plan its cities: informality, insurgence and the idiom of urbanization’, Planning Theory, Vol. 8, No. 1, pp. 76-87.
Recommended for you

We tried to come up with a clear…
The bureaucracy is considered to be the steel…
Policy Buzz
Keep up-to-date with all that is happening in…
Policy Study on Using Data for Better Policy…
Welfare governance in sectors such as education, health…

Understanding India’s Health Budgets
The budget is a vital tool to support…