On Backwardness and Special Status – part 2
22 January 2014
My previous blog (available here) had outlined the manner in which funds are transferred from Government of India (GOI) to states and the need for a fresh approach in transferring funds in the context of changing centre-state relations. In May 2013, GOI had set up a six-member Committee headed by Raghuram Rajan (now RBI Governor) to develop a measure of development or (under) development. The Committee released a Composite Development Index in September 2013. This blog presents a summary of the index by laying out the objectives, methodology and finally the resultant shares of fiscal transfers from GOI to respective states.
Objective
There are two main objectives of the index. First is to propose a general method for allocating funds from GOI to the states based on both a state’s development “need” as well as its performance. Second, by categorizing states into relative degrees of (under) development- “least developed,” “less developed” and “relatively developed”- the index provides a benchmark by which GOI could consider offering additional forms of financial assistance to states that are particularly underdeveloped.
Methodology
As mentioned above, the index is a combination of a number of indicators representing a state’s “need,” based on geographical, income and human development indicators as well as its performance. While a state’s need was given a 75 percent weight, performance constituted 25 percent. The step by step methodology is given below:-
Step 1: Determining a State’s “Need”
The index measures need through a composite index of 10 indicators each assigned an equal weight. These were: (i) monthly per capita consumption expenditure, (ii) education, (iii) health, (iv) household amenities, (v) poverty rate, (vi) female literacy, (vii) percent of SC-ST population, (viii) urbanization rate, (viii) financial inclusion, and (x) connectivity.
Each state is assigned points based on their relative need, such that less developed states would rank higher on the index, and thereby get a larger share of allocations. Further, in order to ensure those particularly in need get a disproportionately higher share of resources, the underdevelopment scores are “squared” (see formula below).
Step 2: Accounting for State Size
In order to allocate more to underdeveloped states with large areas but small populations, weights were assigned to a state’s share in population (80 percent weightage) as well as its share in area (20 percent weightage).
The formula for need is thus given as/by:
(0.8* state’s population share + 0.2 * state’s area share)* [(under)development index for the state]2
Step 3: Accounting for Performance
The committee recognized that need alone is an incomplete measure. A state’s ability to absorb and spend funds is affected by its administrative capacity. In a poorly governed state, additional resources may not reach a majority of the population nor have the desired impact. Further, if underdevelopment ensures a greater share of resources, looking at need alone could create a perverse incentive for states to not develop,. The index thus added a component of performance measured as the improvement in a states development index over time (i.e. a fall in underdevelopment).
The formula for performance is thus:
points to the state based on need * change in (under)development index for the state * performance weighing parameter
Step 4: Identifying the Constant – or the Basic Minimum
Finally, recognizing that all states require a basic minimum to meet fixed expenditures such as administrative costs, the committee assigned a fixed basic allocation for all states. Given that there are 28 states included in the index – the committee determined 8.4% (or 0.3%*28) as the fixed allocation.
The formula thus is: –
% share of a state to the total GOI allocation = 0.3% (i.e., the fixed allocation) + % share of a state based on need + % share of a state based on performance.
Comparison with other methodologies
The index has a number of interesting innovations when compared with previous methodologies.
First is the use of monthly per capita consumption expenditure (MPCE) as opposed to a state’s per capita income. The rationale for using MPCE data was that the value of the underdevelopment index for a state should represent the need of an average individual in the state which may or may not be related to the state’s per capita income. For instance, the presence of a large number of registered offices of corporations in a state like Maharashtra or Karnataka, may increase the states’ per capita income but average household consumption may still be low. While the use of MPCE was debated within the committee,[1] it is an interesting attempt to measure the income actually available for an individual household.
Second, while the focus on performance is not new (the Gadgil formula includes components of a state’s fiscal performance), the index gives a higher weightage to performance than some of the previous methodologies. In fact, an important feature of the formula used is that since performance is multiplied by need – the formula rewards underdeveloped states more for an improvement in the index.
Finally, the methodology attempts to introduce a system of proportionate but non-linear share of allocations. For instance, by giving proportionate to need the formula takes into account changing trends over time such that over time a state may get a greater or lesser share of allocations over time. Moreover, by “squaring” the points a state gets on the need criteria – the methodology ensures that those in greater “need” get a higher share of resources.
Findings
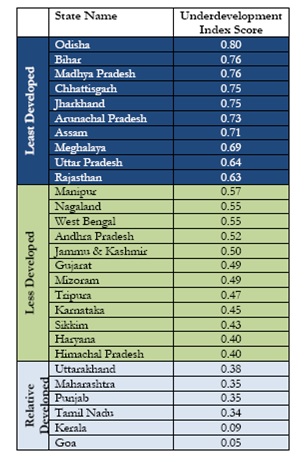
As mentioned earlier, the index ranks different states based on their relative degree of (under)development.[2] Accordingly, Odisha ranks 1 in terms of underdevelopment, followed by Bihar and Madhya Pradesh. In contrast, Goa, Kerala, Tamil Nadu, Punjab, Maharashtra and Uttarakhand are amongst the states which are relative more developed. Table 1 below outlines the rank of the different states based on the underdevelopment index. (See Table 1 for more details)
Table 1: Relative Degrees of Development: Ranking of States

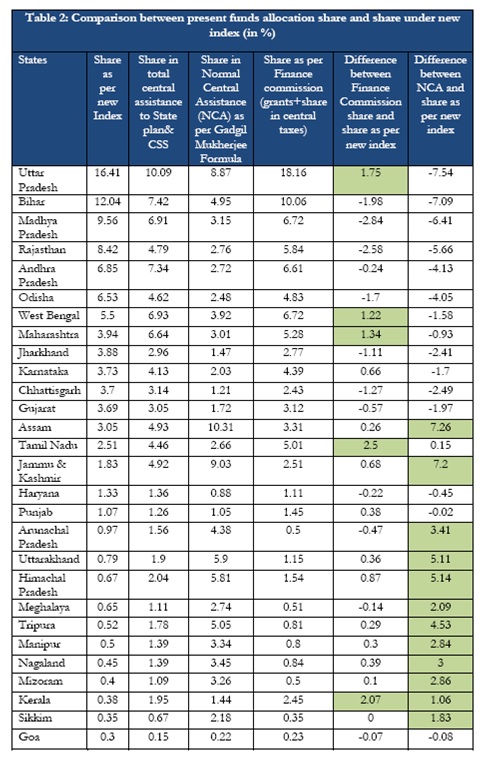
Table 2 shows the share of allocations for each state based on this index, which are then compared with allocations received through the Planning Commission and Finance Commission grants. On average, each state gets 3.6 percent of allocation of funds. However there are significant variations ranging from 0.3 percent to as high as 16.41 percent. In fact, according to this formula, 7 of the poorest states of the country—Bihar, Chhattisgarh, Jharkhand, Madhya Pradesh, Odisha, Rajasthan and Uttar Pradesh—will corner 60.56 per cent of the Central allocation under the new formula.

Relative to the Finance Commission formula, only five states, namely Uttar Pradesh, West Bengal, Maharashtra, Tamil Nadu and Kerala lose one percentage point or more of their share. In contrast, compared to the Gadgil Mukherjee Formula, 12 states lose more than 1 percentage point with 4 of them losing more than 5 percentage points.
As one can see, the index is based on a combination of factors – a state may do better in terms of one measure but not with respect to another. For instance, based on the index, Uttar Pradesh gets the highest share based on both need and performance, followed by Bihar in terms of need but not in terms of performance. Andhra Pradesh, on the other hand, gets a significantly high share based on performance but not as much on need. When measured in relation to population, Arunachal Pradesh, Odisha, Chhattisgarh and Meghalaya, receive the highest based on need; whereas Rajasthan, Odisha, Jammu and Kashmir and Sikkim get the highest shares based on performance.
Conclusion
The findings of the index have raised a lot of debate. While some states stand to gain by this methodology, others such as Kerala, Goa, Sikkim and Assam, would lose in terms of a decreasing share of GOI allocations. The recommendations suggested in the Report are currently being examined by the Government.[3] The 14th Finance Commission, too, will be coming up with their report later in the year. Whether the composite development index methodology or some part of it will be used in determining the transfer of funds remains to be seen. If nothing else,the report has been successful in reigniting the debate on the need for a new criteria.
All information on the index is available online at: http://finmin.nic.in/reports/Report_CompDevState.pdf
[1] A note of dissent by Dr. Shaibal Gupta is available in Appendix 7 of the Report..
[2] States that score 0.6 and above on the index were categorized as “least developed” states. States that score below 0.6 and above 0.4 as “less developed” states, while states that score below 0.4 as “relatively developed” states.
[3] PIB Release, Criteria for Central Assistance, 13/12/2013


