
6 Things You Should know about India’s Quarterly Slowdown
30 July 2019
India is considered a regional superpower in South Asia with its considerable natural resources and an enormous domestic consumer market. India’s GDP growth rate has been impressive throughout the 2000s but has suffered a decline since the early 2010s. Nevertheless, it maintained an impressive rate of growth among developing countries. Since then, the rates of growth of 8-10 per cent have remained elusive. Now, the government is eyeing to reach a USD 5 trillion economy. What will they keep in mind?
-
Explaining the basics
The gross domestic product (GDP) is the metric by which a country’s volume of finished products, in terms of its monetary value, within a specific period of time (usually one year) is measured. It serves as a broad measure of how a country is doing economically. Recent research has shown that India’s GDP numbers along with other macro-indicators may have run the risk of being overestimated. Even though this claim has been largely discredited, recent estimates as published by the National Statistics Office, show a considerable slowdown in the recent quarterly estimates of GDP.
The quarterly estimate of the GDP indicates the monetary value of production within a three month period. The benefit of studying quarterly trends is that it directly measures consequences of policy decisions on the macro-economy. A comparison of quarter-on-quarter GDP (estimates of GDP in the same quarter in two successive years) provides a benchmark for productivity in the current year as compared to the previous. A lower growth rate in successive quarters could signal an overall slowdown for the country.
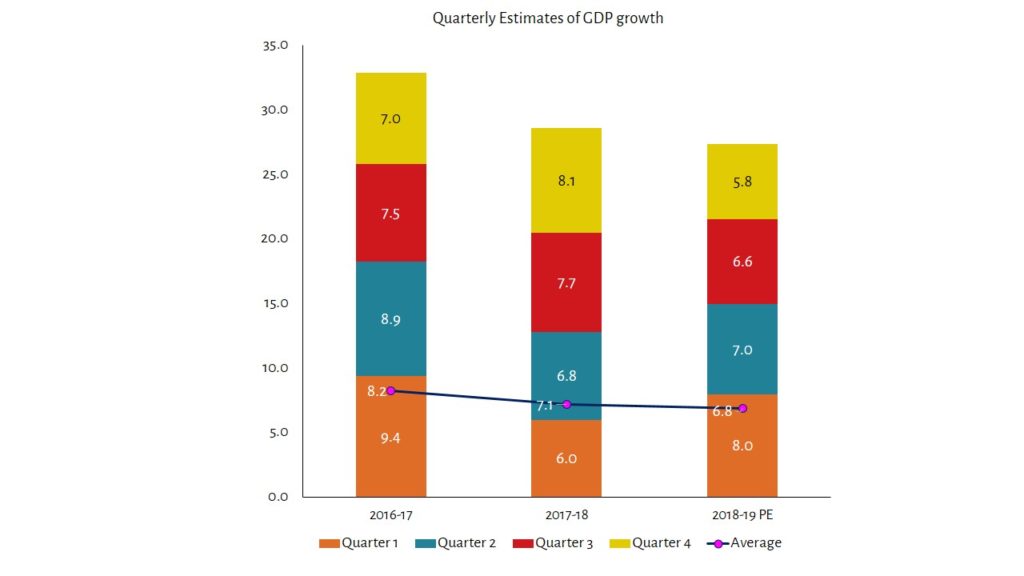
Source: NSO
-
Factors behind the slowdown: Demand side
There are three basics of note here. There are demand side and supply side factors that affect the production of goods in an economy. The aggregate demand is often measured by components such as investment by industry in capital goods, government spending in public goods and services, domestic consumption and international trade.
Gross fixed capital formation (GFCF) refers to the rate at which the country is producing new capital goods and replacing capital goods that have deteriorated to ensure that productivity keeps increasing. Capital goods may refer to machinery, equipment, tools, electricity and other factors.
Private final consumption expenditure (PFCF) refers to the purchases by households on consumption items such as food, rent, clothing, health, leisure and other goods and services. In developing countries, PFCF is a crucial engine for growth as it accounts for a high proportion of the GDP.
Supply side factors include the size and quality of labour, technological innovations, construction, and agricultural productivity.
Demand side factors
- Gross fixed capital formation (GFCF) declined significantly to 3.6 per cent in the fourth quarter of FY 2018-19 after posting double digit growth numbers in the previous quarters.
- Private final consumption expenditure (PFCE) has been sluggish. The quarter-on-quarter growth slowed down from 9.8 per cent in Q3 to 7.2 per cent in Q4 for FY 2018-19 as compared to FY 2017-18.
- Exports of good and services too languished in the fourth quarter of FY 2018-19 from ₹ 7,61,502 crore in quarter 3 (16.7 per cent increase from FY 2017-18 Q3) to ₹ 7,45,430 crore in quarter 4 (10.6 increase from FY 2017-18 Q4).
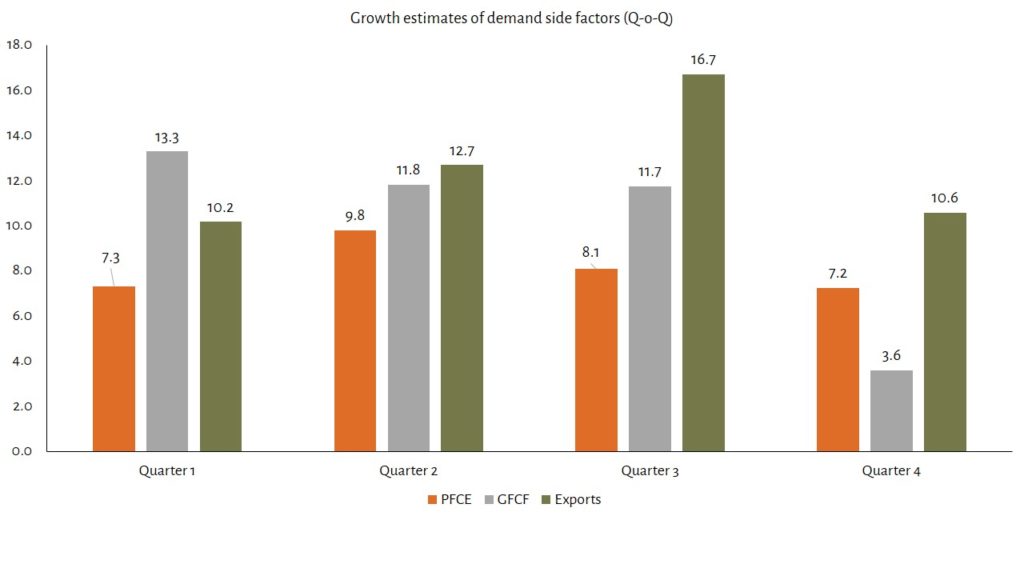
Source: NSO
-
Factors behind the slowdown: Supply side
- The agricultural sector declined in the fourth quarter of FY 2018-19 as compared to the quantum produced in Q4 of FY 2017-18 by -0.1 per cent mainly due to a decline in the production of rabi crop.
- Manufacturing declined to 3.1 per cent in Q4 as compared to a 12.1 per cent in Q1 in the beginning of the year.
- Construction too registered a slowdown from 9.7 per cent in Q3 to 7.1 per cent in Q4 as compared to Q3 and Q4 in FY 2017-18.
- However, the services sector registered an increase in quarter-on-quarter numbers for all four quarters in FY 2018-19 as compared to FY 2017-18.
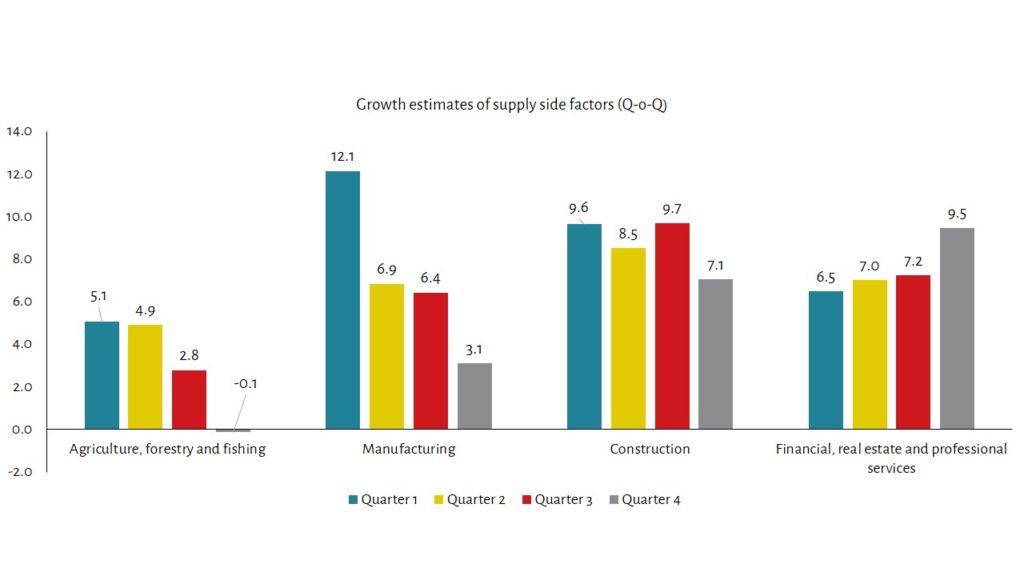
Source: NSO
-
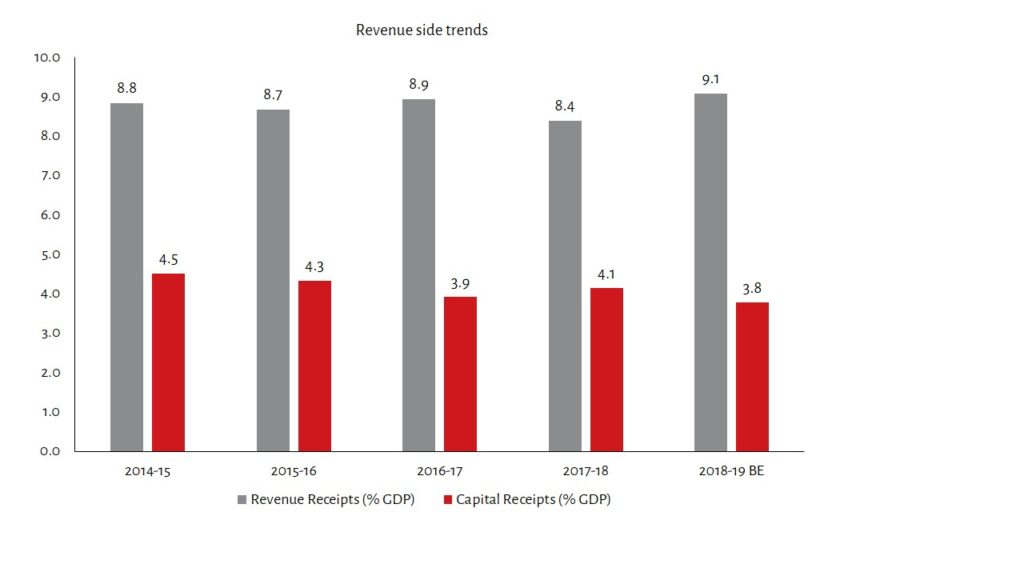
Revenue and Expenditure Trends
Revenue receipts declined as a share of the GDP but the deficit was curtailed by declining expenditure as well:
- Total revenue receipts increased from ₹ 13,74,203 crore in FY 2016-17 to ₹ 14,35,233 crore in FY 2017-18. However, the share of total revenue receipts as a proportion of the GDP declined from 8.9 per cent to 8.4 per cent.
- Total expenditure increased from ₹ 19,75,194 crore to ₹ 21,41,975 crore but declined as a share of GDP from 12.86 per cent to 12.53 per cent over the same period.

-
Major Deficit Indicators
The government usually is the authority that is responsible for spending on essential public goods and services such as defence, internal security, roads, bridges, health care facilities, educational facilities and other goods and services. In order to pay for these, the government taxes income, corporations and traded goods apart from other transactions within the economy. A budget deficit occurs when the expenditure of the government on these goods and services exceeds the revenue that the government collects through taxation and other means. There are several ways of calculating deficits:
- Revenue deficit: the difference in the revenue expenditure over and above the revenue receipts is known as the revenue deficit. This deficit is the gap between current income and current expenses. A high revenue deficit indicates the inability of the government to cover its current expenses such as salaries, pensions, interest payments and other operating costs. The Fiscal Responsibility and Budget Management Act (FRBM) stipulates the government to maintain a 2 per cent revenue deficit as a proportion of the GDP.
- Fiscal Deficit: the difference in the total expenditure of the government over and above the total receipts is known as the fiscal deficit. Total expenditure of the government includes not only the revenue expenditure but also expenditure on capital goods. The difference between the fiscal and revenue deficit usually indicates the extent of borrowing by the government that is used for investing in capital goods. Even though running a high fiscal deficit potentially risks a high inflation rate in the economy and/or exchange rate fluctuations, it indicates the government is spending on assets in the short run that have a return on investment in the form of generating income in the future. Investing in manufacturing equipment, infrastructure and human capital (in certain cases) are examples of investing in capital goods. The FRBM stipulates a 3 per cent fiscal deficit target for the government to maintain public debt sustainability and fiscal prudence.
There was an improvement in both the fiscal and revenue deficit numbers since FY 2014-15 when the RD was 2.9 per cent of the GDP and the FD was at 4.1 per cent of the GDP.
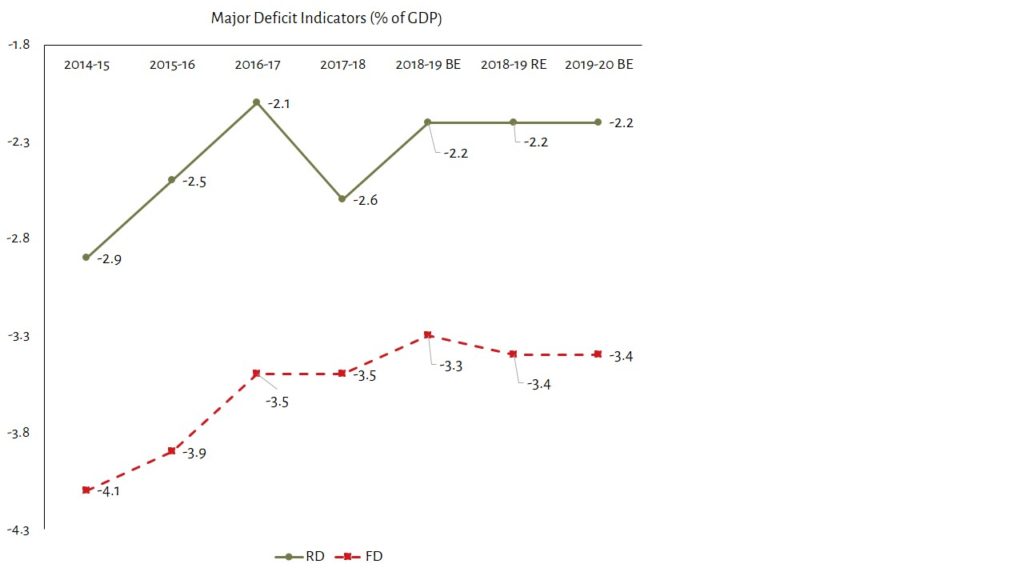
- The revenue deficit however plummeted to nearly 2.6 per cent of the GDP in FY 2017-18 due to a sharp decline in revenue receipts from 15 per cent in FY 2016-17 to 4.44 per cent in FY 2017-18 (Y-o-Y).
- The fiscal deficit was limited to 3.5 per cent of the GDP because of a decline in total expenditure. Share of capital expenditure declined from 1.9 per cent of the GDP to 1.5 per cent of the GDP over the same period.
- The GFCF too has declined as a share of GDP from 30.1 per cent in FY 2014-15 to 28.6 per cent indicating a decline in investments.
- Fiscal prudence at the cost of spending on capital assets is cited as a worrying trend by economists.
-
Off-budget financing
Over the years, concerns have been raised at the Government of India (GoI) for increasingly resorting to off-budget financing. The government uses off-budget methods of financing for both revenue and capital spending. The quantum of these borrowings, outside of Parliament control, have been rising but the system lacks transparent disclosures and a comprehensive management strategy to deal with them.
A report by the Comptroller and Auditor General of India (CAG) underlined three instances of off-budget borrowing that covered the deferring of imminent payments:
i) fertiliser subsidies by the Ministry of Chemicals and Fertilisers through special banking arrangements in which loans from PSU banks are arranged; ii) food subsidy bills of the Food Corporation of India through financial instruments and guaranteed Cash Credit Facility (CCF) extended by the GoI; iii) funding irrigation projects under AIBP through Long Term Irrigation Fund (LTIF) through NABARD (National Bank for Agriculture and Rural Development).
The financial loans extended under these off-budget channels are considerable. For example, the carryover liability (subsidies that remain unpaid in the current fiscal year) for the Ministry of Chemicals and Fertilisers in 2015-16 and 2016-17 were ₹ 43,356 and ₹ 39,057 crore respectively. In order to overcome the liquidity shortage, the department also applies for loans though PSUs, the interest for which accumulates over years. In 2014-15, the department paid an interest of ₹ 80.9 crore on these loans.
The FCI is even more in debt. The carryover liability in 2015-16 and 2016-17 was ₹ 50,037 crore and ₹ 81,303 crore respectively. Financial instruments such as bonds (₹ 13,000 crore), unsecured short-term loan (₹ 40,000 crore), loans through National Small Savings Fund (NSSF loans of about ₹ 70,000 crore) and Cash Credit Facility through 68 other public sector banks (₹ 54,495 crore) cover liquidity shortages for the FCI.
The National Bank for Agriculture and Rural Development (NABARD) has a Long Term Irrigation Fund (LTIF) dedicated to providing loans for irrigation projects under the AIBP. This is for both the State and Central share of financing irrigation projects.
The CAG audit report states that NABARD bonds worth ₹ 9,086 crore were issued in 2016-17 for LTIF porjects. It further extended ₹ 3,336.88 crore to LTIF projects and ₹ 2,414 crore to the Polavaram Project under Central share in National Water Development Agency (NWDA). It also extended ₹ 3,335 crore towards State share for LTIF projects.
There is also some concern on the final report that the Jalan committee on economic and capital framework is expected to release soon. If the committee gives the green signal for the government to identify surplus capital with the central bank (the Reserve Bank of India) and utilise the same for reviving debt-ridden PSUs, it may provide the government with adequate fiscal space to undertake reforms. However, whether it is at the cost of the autonomy of the RBI, transparency in the budgetary process of the government or the credibility of macroeconomic data in the public domain remains to be seen.
6 thoughts on “6 Things You Should know about India’s Quarterly Slowdown”
Add new comment
Recommended for you

We tried to come up with a clear…
The bureaucracy is considered to be the steel…

Policy Buzz
Keep up-to-date with all that is happening in…

Understanding India’s Health Budgets
The budget is a vital tool to support…

The Evolution of India’s Welfare System from 2008-2023:…
In the 15 years that have gone by,…
In-depth and articulate.
In-depth analysis of the subject
It is an extremely well written and researched article covering both the micro and macro economic aspects of our economy. Numbers don’t lie and Meghna has done a wonderful job in presenting her facts with numbers.
Just to put my worries into perspective, let me compare the population and GDP of US, China and India, (US 327 Mn / 21 Tn$; China 1.42 Bn / 14 Tn$; India 1.35 Bn / 2.7 Tn$). Even in the unlikely event of our reaching 5 Tn$ GDP in next five years, our relatively unimportant position in the global scheme of things will not change much.
As you have pointed out in your article, with facts and figures from Government sources, there are many areas of concern. Even a shortfall in monsoon can make our budget estimates go topsy-turvy. Government is showing people a pie-in-the-sky, by saying they will reach a GDP of 5 Tn$ in five years.
In-depth analysis of the subject.
In-depth analysis .The country might eventually enter into a period of economic recession.