How is Janani Suraksha Yojana performing in backward districts of India? – Part 3

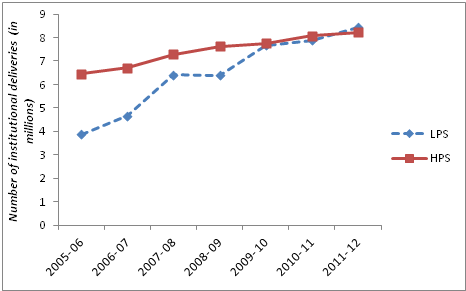
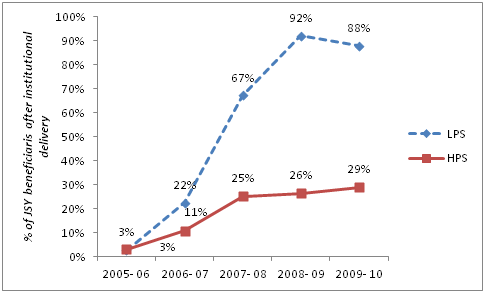
So far we have seen that Janani Suraksha Yojana (JSY) has been successful in increasing institutional deliveries. The scheme is performing well even in some of the most backward districts in the country. But there is a scope for improvement in its functioning especially with regards to delays in receiving benefits, payment of bribes and other problems in receiving the benefits.

This part of the series discusses the role of the Accredited Social Health Workers (ASHA) and the Auxiliary Nurse Mid-wife (ANM).

Part III- Role of ASHA & ANM

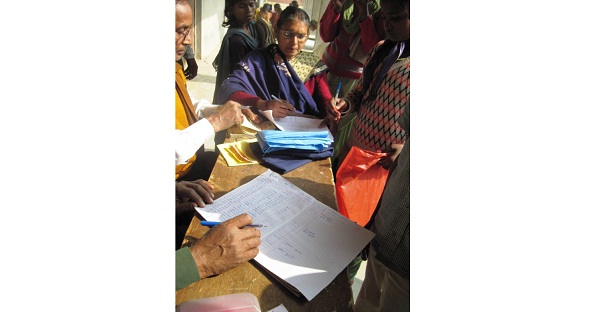
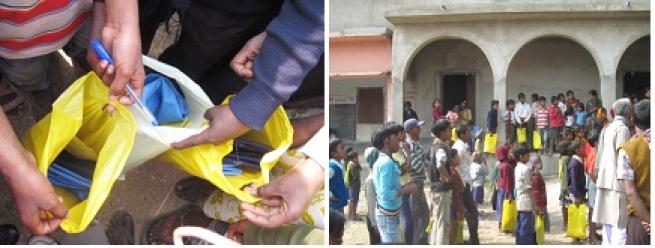
An ASHA is a critical element of the NRHM and JSY. As per the guidelines, an ASHA is supposed to identify pregnant women in the village, make sure that they receive antenatal care, identify a functioning government or accredited private medical facility where these women can deliver their baby, escort them and stay with them at the medical facility till the time of discharge. She is also supposed to arrange immunization for the newborn and postnatal care.

We covered only a few of these aspects in our questionnaire. The results are discussed below and indicated in a table at the end of the blog.

1. Mode of Transport and Transport Arrangements

65% of women delivering in government medical facilities reached the institution using car/ taxi/ jeep, while 6% used an ambulance. Making transport arrangement for pregnant women is an ASHA’s responsibility. But 82% respondents reported that members of their household or other relatives made travel arrangement. Only 16% women mentioned that such an arrangement was made by an ASHA, while 2% reported that some health worker, other than ASHA, made the arrangement. There are variations across districts- ASHAs in Sundargarh, Nalanda, Hardoi and Gumla perform better than ASHAs in other districts.

2. Staying with Pregnant Woman

Only 72% women delivering in government medical facilities reported that a health worker (either ASHA or ANM or Anganwadi worker) stayed with them during delivery. The proportion is highest in Sundargarh, Hardoi (more than 90% in both) and Gumla (88%), while it is lowest in Udaipur (48%) and Rajgarh (55%).

Only 67% of these women reported that the ASHAs stayed with them at the facility during birth. The proportion is highest in Sundargarh (96%) and Hardoi (82%), and lowest in Udaipur (30%), Rajgarh (35%) and Bhilwara (37%).

More worryingly, 18% of women delivering in medical facilities reported that none amongst ASHA, ANM or Anganwadi worker stayed with them.

3. Post Delivery Visit

An ASHA is supposed to visit the women within seven days of delivery to track their health post-delivery. But only 47% women reported of a health worker visiting them in a week. Out of these women, 60% reported that an ASHA visited them, while 25% reported being visited by an ANM. Thus, proportion of women who delivered at a government facility and reported that ASHAs visited them within seven days is barely 28%[1].

This discussion clearly indicates that the performance of ASHAs leaves a lot to be desired.

We also canvassed a short questionnaire separately for ASHAs, where we asked about timing of their appointment, amount they receive per delivery, days post-delivery to receive their incentives, and impediments (if any) in receiving these incentives.

The data indicates that three-quarters of the ASHAs interviewed were appointed in the period 2005 to 2008. Thus, lack of experience is unlikely to explain why ASHAs might not be able to perform as per expectations.

ASHAs receive Rs. 448 per delivery, on an average[2]. Interestingly, 35% of the ASHAs interviewed report receiving Rs. 350 per delivery, while 37% report receiving Rs. 600. Overall, 62% received less than Rs. 600 per delivery. ASHAs in Hardoi and Nalanda report receiving Rs. 600 per delivery, while ASHAs in Rajgarh and Korba receive the least amount per delivery within our sample districts, around Rs. 340 on an average. This might also reflect the fact that the households are making transport arrangements themselves and ASHAs are being paid only the incentive amount and amount for escorting women to the facility.

When it comes to the timing of receiving incentives post-delivery, overall, 58% of surveyed ASHAs received their incentives within or up to 7 days, while 65% received it within or up to 15 days[3]. Bhilwara, Sundargarh and Udaipur perform quite well. More than 80% of ASHAs in these districts receive incentives within 7 days. Hardoi and Gumla are the worst performers where only 17% and 28% ASHAs report receiving their incentives within 7 days post-delivery.

Our findings are consistent with those of other studies[4]. The CES (2009) for instance found that on average ASHA’s accompanied only 54.3 percent of women who delivered in government institutions in low performing States (LPS) and in only 49.1 percent cases, the ASHA stayed with the woman. Even in terms of motivation, the percentage of rural women motivated by ASHAs was 19.2 percent in rural areas. Interestingly, according to the NHRC survey, when JSY beneficiaries were asked why the ASHA had not accompanied them, in about “40% the reason was that institutional delivery was not promoted by ASHAs”.

It is clear from the above discussion that while the payment of the incentive to the individual beneficiary has resulted in an increase in institutional delivery, there are some gaps with respect to the role of the ASHAs, and we need more specific evidence to learn more about them.

In the next and the final section, we will summarize the main findings of the survey and look at some of the constraints from the supply side – in terms of public health institutions and their facilities.

Rajasthan Jharkhand Uttar

Pradesh

Chhattisgarh Bihar Madhya

Pradesh

Orissa Overall
Udaipur Bhilwara Gumla Hardoi Korba Nalanda Rajgarh Sundargarh
Mode of transport to

government medical

facility


 Ambulance 3.15  1.9 4.38 0.61 0 2.35 6.14 27.98 6.3
 Car/Taxi/Jeep 79.13 86.08 58.13 58.18  47.19 60.09 56.68 65.8 64.94
Who made arrangements

in case of car/taxi/jeep

to the government facility?


 ASHA 7.96 13.24 23.91 23.96  0 28.13 3.25 29.13 16.09
 Other health

worker

2.99 4.41 1.09  0 7.14  0 0.65  0 1.74
 Household 86.07 77.94 72.83 75 88.1 69.53 90.26 67.72 78.79
 Other relatives 1.99 2.94 2.17  0 4.76 2.34 5.19 3.15 2.77
Did any health worker stay with you at

the govt. facility during the birth?

47.68 58.11 87.66 90.8 76.19 80.86 54.62 96.95 72.18
 If yes, who stayed with you at the government facility?


 ASHA 29.73  37.21 78.46 81.63 54.69 79.75 34.62 96.28 66.54
 ANM 26.13 23.26 11.54 3.4 14.06 7.36 7.69 2.66 10.3
 AWW 7.21 15.12 4.62 2.04 10.94 1.23 12.31 0 5.4
 None 36.94 24.42 5.38 12.93 20.31 11.66 45.38 1.06 17.76
Did any health worker visit you at the govt. facility during the birth?  41.67 42.04 72.26 41.36 53.93 54.07 19.03 72.02 47.21
If yes, who visited you?  ASHA 23.53 40.63 67.27 75.76 51.06 78.18 20 84.56 59.71
 ANM  42.16 32.81 26.36 10.61 25.53 15.45 66 6.62 24.96
 AWW 24.51 23.44 4.55 6.06 21.28 3.64 2 4.41 10.22
 Others 7.84 3.13 0.91 7.58 0 1.82 10 2.94 3.94
 Don’t know 1.96 0 0.91 0 2.13 0.91 2 1.47 1.17
Amount received by ASHA per delivery (Rs.)  Mean  354.84 426.92 395.87 596.51 342.39 600 340.38 477.38 447.61
 Median  400 400 350 600 350 600 350 550 400
 Observations  31 26 49 43 46 38 26 42 301
 % of ASHAs receiving incentives after delivery in government facility  Within 7 days 83.33 87.1 27.91 16.67 63.04 48.72 59.26 86.36 57.79
 Within 14 days 86.11 90.32 30.23 33.33 73.91 51.28 77.78 88.64 64.94
Days post delivery to receive the amount  Mean 8.06 7.16 28.74 23.48 8.52 24.03 7.56 4.86 14.55
 Median 3 3 30 15 7 8 7 1 5.5

[1] (47% * 60% = 28%)

[2] Median is Rs. 400. There are 3 observations with values above Rs. 100 and 3 observations with values greater than Rs. 800. These have been excluded in calculations.

[3] 15 observations with more than 90 days have been excluded in these calculations.

[4] Coverage Evaluation Survey (2009), NHRC(2010), UNFPA (2007)

Union Budget Speech 2013-14: Highlights from the Social Sector

Highlights for focal ministries:

  1. The Ministry of Rural Development has been allocated a total of Rs. 80,194 crore, which is an increase of as much as 46 percent from the revised estimates of 2012-13. Much of this increase can be attributed to the increase in allocations to the Pradhan Mantri Gram Sadak Yojana. The budget estimates for the Ministry of Rural Development for the year 2012-13 stood at Rs 90,435 crores.
  2. The Ministry of Human Resource Development has been allocated with Rs. 65,867 crores, an increase of 17 percent over the revised estimates of 2012-13.
  3. The Ministry of Health and Family Welfare has received an allocation of Rs. 37,330 crores, a meager rise from Rs. 34,488 crores allocated in the budgetary estimates of 2012-13.
  4. The Ministry of Drinking Water and Sanitation has received an allocation of Rs. 15,260 crores, an increase from Rs 13000 crores, which was the revised estimated allocation to the ministry in 2012-13.

Highlights for flagship social sector schemes:

  1. The Mahatma Gandhi National Rural Employment Guarantee Scheme has been allocated Rs 33,000 crores – an amount equivalent to the budgeted estimates for the scheme in 2012-13.
  2. The Pradhan Mantri Gram Sadak Yojana has been allocated a total of Rs 21,700 crore this year, a significant upward increase from Rs 15873 crores in 2012-13.
  3. Allocations for the Sarva Shiksha Abhiyan have seen a marginal increase – Rs `27,258 crore has been allocated to scheme this year, while Rs 25,555 crores was allocated to the scheme last year.
  4.  The Mid Day Meal Scheme has been allocated a total of Rs 13215 crores, also a marginal increase from the budgeted estimates of 2012-13, which stood at Rs. 11,937 crore.
  5. The Integrated Child Development Scheme has successfully spent all its allocations for the year 2012-13 and has been allocated 17,700 crore in 2013-14, representing an increase of 11.7 percent, from Rs. 15,850 crores.
  6. The Ministry of Drinking Water and Sanitation has also received increased allocations to the tune of Rs 2260 crores. It receieves Rs 15,260 in the 2013-14 budget.
  7. Allocations to the Jawaharlal Nehru National Urban Renewal Mission have nearly doubled. While the revised estimates last year stood at Rs. 7,383 crores, the budgeted estimates in the 2013-14 budget stand at Rs. 14,873 crores. It has been proposed that a significant proportion of this increased allocation be used in the provisioning of 10,000 buses, especially in hill states.
  8. The Backward Region Grants Fund has received an allocation of Rs. 11,500 crore in 2013-14, with an additional sum of Rs 1000 crores specifically allocated to Left Wing Extreme affected states. BRGF will include a State component for Bihar, the Bundelkand region, West Bengal, the KBK districts of Odisha and the 82 districts under the Integrated Action Plan. In addition, the criterion for identification of eligible districts under the scheme shall see revision.

Other highlights relevant to the social sector:

  1. The 173 Centrally Sponsored Schemes and Additional Central Assistance schemes shall be restructured in to just 70 schemes. Additionally, it was announced that the centre shall allocate a sum of Rs. 5,87,082 crores to the states and union territories as taxes, non-plan grants and loans, and central assistance.
  2. 11 lakh beneficiaries have received benefits under the Direct Benefit Transfer Scheme. The government has announced the seeding of bank accounts with aadhar numbers and the extension of the DBT to more schemes by the end of the term of the government.
  3. The Rashtriya Swasthiya Bima Yojana covers 34 million families below the poverty line.  It will now be extended to other categories such as rickshaw, auto-rickshaw and taxi drivers, sanitation workers, rag pickers and mine workers.
  4. The launch of the second phase of the Pradhan Mantri Gram Sadak Yojana was also announced, wherein states who have successfully met their targets of the first phase are eligible to participate.
  5. In an effort to bolster financial inclusion, it was announced that all bank branches would have to have an ATM facility. Further, the Rural Housing Fund (that extend loans for rural housing) has been allocated an increased sum of Rs. 6000 crores in 2013-14, up from Rs. 4000 crores in 2012-13.
  6. The establishment of India’s first Womens’s Bank with an allocation of Rs. 1000 crore has been announced. The bank has been set up with a view to address the gender related issues pertaining to financial inclusion.

Highlights from the Economic Survey 2012-13

General Trends in Social Sector Allocations:

  • GOI expenditure on social services and rural development combined (Plan and non-Plan) has seen an increase from 14.77 per cent in FY 2007-8 to 17.39 per cent in FY 2012-13 (Budget Estimates [BE]).
  • It is budgeted that 25.1 percent of the total expenditure (GOI and states) will be spent in FY 2012-13. This is an increase from 24.5 percent in FY 2011-12.
  •  The total expenditure (GOI and states combined) on education increased from Rs. 291378 crores to Rs. 331524 crores. As a percentage of GDP, this amounts to an increase from 3.25 percent to 3.31 percent.
  • The expenditure on health (GOI and states) as a percentage of GDP also increased from 1.29 percent in FY 2011-12 to 1.36 percent in FY 2012-13.

Key Development Indices:

  • While the average annual growth rate of the Human Development Index of India between 2000-11 is among the highest of all countries surveyed, the figures themselves continue to be low.
  • In 2011, India was ranked at 134 out of 187 countries (according to the latest available Human Development Report (HDR) 2011 published by the United Nations Development Programme (UNDP)).  In 2010, conversely, India was ranked at 119 out of 169 countries.
  • India’s performance in the Gender Inequality Index (GII) (which captures the loss in achievement due to gender disparities in the areas of reproductive health empowerment, and labour force participation) also ranked low at 129. This is worse than countries such as Pakistan (115), Bangladesh (112), and Sri Lanka (74).

Income and Inequality:

  • The Monthly Per Capita Expenditure (MPCE) at constant prices increased from Rs. 558.78 in rural areas and Rs. 1052.36 in urban areas during 2004-5 to Rs. 707.24 and Rs. 1359.75 in 2011-12 in rural and urban areas.

Employment:

  • Overall employment in public and private sectors combined saw a marginal increase from 281.72 lakh at the end of FY 2009-10 to 289.99 lakh at the end of FY 2011-12.
  • The increase can be attributed to private sector employment which grew from 103.77 lakhs to 114.52 lakhs in the same time period.
  • Public sector employment saw a decrease from 177.95 lakh to 175.48 lakh during the same period.

Growth Rates:

  • Growth rates: The best performing states in terms of growth (measured as gross state domestic product at constant prices) during 2011-12 were Bihar (16.71 per cent) Madhya Pradesh (11.98) and Maharashtra (8.54).
  • The states with the slowest growth rates included Rajasthan (5.41 per cent) Punjab and Uttar Pradesh.
  • Bihar also had the highest per capita growth rate in terms of per capita income, at 15.44 percent.  On the other hand, per capita income growth was lower than the India average for  Rajasthan (3.72 per cent), Uttar Pradesh, Punjab and Odisha.

Financial Inclusion:

  • Decadal growth in the percentage of bank branches has been highest in Haryana (59.5 per cent) and lowest in Bihar (14.4 per cent). Nearly 90 percent households in Himachal Pradesh avail of banking services, while the figure for Bihar stood at a low 44.4 percent.

Trends in  Key Social Sector Components:

  • The Indira Awas Yojana:

–          During FY 2012-13, as against a target of 30.10 lakh houses, 25.35 lakh houses were sanctioned under the scheme. A total of 13.88 lakh houses were constructed as of 31st December 2012.

–           The unit assistance to rural households for construction of dwelling units under the IAY is being revised w.e.f. I April 2013. The scheme shall now provide Rs. 70,000 in plain areas ( up from  from `Rs. 45,000 ) and Rs. 75,000 in hilly/ difficult areas/Integrated Action Plan (IAP) districts (up from Rs. 48,500).

–          Eighty-two left-wing extremism (LWE)-affected districts have also been made eligible for a higher rate of unit assistance between Rs.48,500  and Rs. 75,000 (w.e.f. 1.4.2013).

–           310 lakh houses have been constructed since the inception of the IAY till 31 December 2012.

  • Rural Sanitation:

–          The annual number of rural households with toilet facilities has increased from 6.21 lakh in 2002-3 to 88 lakh in 2011-12. Conversely, the Census 2011 reports that only 32.7 per cent of rural households have toilets.

–          More than 27 lakh toilets have been constructed in rural households in the annum 2012-13 (up to November 2012).

–          A total of 28,002 gram panchayats, 181 intermediate panchayats, and 13 district panchayats have been awarded the Nirmal Gram Puruskar (NGP) over the last seven years.

  • Rural Drinking water:

–          About 73.91 per cent of rural habitations are fully covered under the provision of safe drinking water in rural areas. This entails the provision of at least 40 litres per capita per day (lpcd) of safe drinking water.

–          As against a target of 7,98,967 habitations to be covered during the Eleventh Five Year Plan,  coverage up to 31 March 2012 stood at 6,65,052 (83.23 per cent).  The Census 2011 reported that 84.2 per cent rural households as having improved access to drinking water sources such as tap water, hand pumps and covered wells.

–           Allocations for the Nirmal Bharat Abhiyan (NBA – earlier the Total sanitation campaign) have seen an increase from Rs. 1500 crore in 2011-12 to Rs. 2500 crore in 2012-13.

–          Incentive provision for individual household latrine units under the NBA has widened from all BPL households to include above poverty line (APL) households that fall under the following categories: SCs, STs, small and marginal farmers, landless labourers with homesteads, physically challenged, and women headed households.

  • AADHAAR:

–          As of December 2012, 24.93 crore Aadhaar numbers have been generated and an estimated 20 crore Aadhaar letters dispatched.

  • Janani Suraksha Yojana (JSY):

–          The number of beneficiaries under the JSY has increased from 7.38 lakh in FY 2005-06 to more than 1.09 crore in FY 2011- 12.

–          The number of institutional deliveries has increased from. 1.08 crore in 2005-6 to 1.75 crore during 2011-12.

–          The number of institutional deliveries during 2012-13(up to September 2012) stood at   80.39 lakh.

How is Janani Suraksha Yojana performing in backward districts of India? – Part 2

As mentioned previously, this blog post discusses the findings from the PAHELI survey with respect to the JSY.

1. Institutional and home deliveries

Out of 3178 deliveries, 48% deliveries took place in government facilities, 9.5% in private facilities, and 42.5% deliveries took place at home (table 1A)[1]. The proportion of deliveries in government facilities is highest in Sundargarh and Rajgarh, followed by Udaipur. Korba, Gumla and Hardoi perform the worst.

There has been a substantial decline in the proportion of home deliveries as compared to District Level Household Survey (DLHS) III, which is the latest available household-level data on maternal health[2]. Yet, the proportion remains quite high.

2. Receipt of cash benefits

As per the scheme guidelines, all women delivering in government medical facilities are entitled to the monetary incentives. However, only women from BPL families can avail of the benefits in case of deliveries in accredited private facilities or at home in the presence of skilled personnel.

The data indicates that 94.5% of women delivering in government facilities receive monetary compensation. In fact, this proportion is above 90% in all eight districts, with Udaipur (98%) and Sundargarh (97.5%) performing the best (table 1A). But only 11% of women on average delivering at home report receiving money. Rajgarh (31%) and Sundargarh (25%) have the highest proportion of women getting benefits after a home delivery.

3. Location of receipt of benefit in case of deliveries in government facilities

Payment to JSY beneficiaries should be paid at the institution itself. As per our data, 95% of the beneficiaries report that payment was indeed made at the institution (table 1B). With the exception of Sundargarh, the proportion is more than 91% in rest of the districts.

4. Mode of Payment

As per the JSY guidelines, payment is to be given through account payee cheques. 86% of the beneficiaries delivering in government facilities report receiving payment through cheques (table 1B). The proportion was highest in Hardoi (97%) and lowest in Bhilwara (76%). The proportion of beneficiaries receiving payment through cheques was lower in the case of private facilities (72%) and even lower (35%) in the case of home deliveries.

5. Payment in Installments

JSY guidelines explicitly say that the payment to the beneficiary should be made in one installment. The data indicates that in the case of deliveries in government facilities, 89% of the JSY beneficiaries received payment in one installment (table 1B). This proportion varies from 96% of beneficiaries in Sundargarh to 79% in Gumla.

6. Amount Received

Women delivering in government medical facilities receive payments as per the norm, an average of Rs. 1451, while the median amount is Rs. 1400 (table 1B). Average payment amounts are above Rs. 1500 in Gumla, Korba and Udaipur, and below Rs. 1400 in Sundargarh, Hardoi and Rajgarh.

Women delivering at home receive Rs. 859.47 on an average, while women delivering in private facilities receive Rs. 1504.39[3].

7. Delays in receiving compensation

60% of beneficiaries who deliver in government facilities report receipt of benefits within seven days, while 71% report receiving benefits within two weeks (table 1A). Udaipur performs the best, with 93% of the beneficiaries reporting receipt of benefits within two weeks. Gumla performs the worst on this indicator, with only 24% beneficiaries receiving benefits within two weeks.

Overall, the median days to receive benefits in case of delivery in government facilities is four, while the mean number of days is ten[4]. On an average, beneficiaries in Udaipur, Sundargarh and Rajgarh can expect to receive their benefits within a week, while those in Gumla might have to wait up to a month.

In case of delivery in private facilities, beneficiaries reported receiving money, on an average, ten days after delivery. The delays seem to be even higher for payment in case of home deliveries: on average, 23 days after the delivery (table 1B)[5].

8. Payment of bribes to receive JSY benefits

Only 6% of the beneficiaries who delivered in government facilities reported that they had had to pay bribes to receive the money (table 1B). Bhilwara (1%), Gumla (2%) and Sundargarh (4%) are the best performers, while Rajgarh is the worst performer with 13% of the beneficiaries reporting that they had to pay a bribe.

9. Other problems

But having to pay a bribe is not the only problem beneficiaries might have to face. When one takes into account other problems (such as, distance to the health facility, paper work, inconvenient timings, behaviour of health workers), the proportion rises. Data indicates that 18% of the beneficiaries in case of deliveries in government facilities reported facing one or more of these problems (table 1B). The proportion was lowest in Sundargarh (8%) and Bhilwara (9%), and highest in Hardoi (31%) and Gumla (28%).

The corresponding fractions are 27% in case of delivery in private health facilities and 29% in case of home deliveries.

The above discussion suggests that JSY is working reasonably well as far as some of the important process-related indicators are concerned. But there is scope for improvement, especially when it comes to delays in transferring benefits, payment of bribes and other problems faced in receiving the benefits.

In Part III, we’ll look at indicators related to the performance of ASHAs.

TABLE 1A: JSY-related indicators


Location of delivering the baby

RJ

JH

UP

CH

BH

MP

OR

Overall

Udai-  pur

Bhil-wara

Gumla

Hardoi

Korba

Nal-anda

Raj-garh

Sundar-garh

Sample size (households) 

1120

1334

1190

1180

1176

1065

1178

1162

9405

% of women delivering the baby

Home

33.33

46.05

58.37

55.38

65.81

28.37

21.91

24.31

42.54

Government Facility

61.35

43.05

35.90

37.00

22.88

51.06

69.77

70.49

47.99

Private Facility

5.31

10.90

5.73

7.62

11.31

20.57

8.31

5.21

9.47

No. of Respondents

414

367

454

446

389

423

397

288

3178

Home
(DLHS III)

67.30

66.10

90.80

90.00

90.80

65.40

54.10

66.00

How is Janani Suraksha Yojana performing in backward districts of India? – Part 1

The Government of India (GoI) has ambitious plans “to transfer individual benefits from the Government directly into the bank accounts of beneficiaries”[1]. This has given rise to intense debates and discussions on direct cash transfers as a policy tool to administer social-welfare objectives of the government. Unfortunately, there has been a limited discussion of the evidence from cash transfer schemes currently in operation in India. This 4-part blog-post, based on a forthcoming working paper, partially fills this gap by analysing the performance of Janani Suraksha Yojana (JSY), a conditional cash transfer scheme aimed at promoting institutional delivery by providing money to women if they deliver in medical facilities. Incentives are also given to the local community health workers, Accredited Social Health Activists (ASHAs), if they facilitate such deliveries. The data for this exercise comes from PAHELI, a unique attempt to rapidly assess the status of human development, including maternal and child health, in some of the most backward districts in India (click here, here and here to know more about PAHELI)[2].

In part I, we discuss the JSY scheme and discuss whether it has been successful in increasing institutional deliveries. The section also briefly describes the PAHELI survey. In Parts II and III, we analyse specific indicators related to the JSY and ASHA. Our findings indicate that JSY is working reasonably well. Yet there are some concerns regarding delays in receiving payments and the limited role played by ASHAs in facilitating deliveries or making post-delivery visits. But the most important concern is the continued high proportion of women delivering at home. In Part IV, the blog series concludes with a discussion of a few possible reasons, which might prevent women from accessing government health facilities, drawing on existing literature.

About Janani Suraksha Yojana & PAHELI

Background

JSY is a flagship programme of the National Rural Health Mission (henceforth, NRHM), launched by the GoI in April 2005. The main objective of JSY is to decrease maternal and infant mortality by encouraging pregnant women to deliver in medical facilities[3]. This is sought to be achieved through the payment of a cash incentive to the woman if she delivers in a government medical facility or in an accredited private medical facility. As per the current eligibility criteria, any woman from the low performing States (LPS), irrespective of poverty status, number of births and age is eligible for these cash incentives, while in the high performing States (HPS), a woman has to be above 19 years of age and below the poverty line[4]. The amounts of incentives are shown in table 1.

Table 1. Current Incentives under JSY (in Rs.)

Amount of Incentives (Rs.)
State category Rural area Urban area
Low Performing State (LPS) 1400 1000
High Performing State (HPS) 700 600

In addition to facilitating demand directly by the beneficiary, JSY also introduced the Accredited Social Health Activist (ASHA), a trained female community health activist. Selected from the village itself and accountable to it, ASHAs are supposed to work as an interface between the community and the public health system, and play an important role in the context of maternal and child health[5]. As far as JSY is concerned, she is supposed to facilitate delivery in a government or an accredited private medical facility. As per the guidelines, she is to be paid Rs. 600 per delivery in government facilities in LPS and Rs. 200 in HPS[6].

Has the Scheme worked?

Figure 1 indicates that institutional deliveries have increased more rapidly in LPS post-2005, as compared to the HPS, and as a result, the gap between the two has almost disappeared. Figure 2 shows that the proportion of JSY beneficiaries has also shot up dramatically in LPS[7]. Rigorous evaluations using various rounds of nationally representative data sets suggest that JSY has contributed to this narrowing of the gap[8]. A number of qualitative studies and reports also indicate that JSY has played an important role in improving institutional deliveries[9].

Figure 1. Number of institutional deliveries in LPS and HPS[10]

Source: NRHM (2012)

Figure 2. % of JSY beneficiaries after institutional delivery in LPS and HPS

Source: NRHM (2012), RTIs filed by Accountability Initiative

It is in the backdrop of these impressive aggregate numbers that PAHELI offered us an opportunity to assess how well JSY actually functions, in some of the most backward districts located in the LPS.

PAHELI

‘People’s Assessment of Health, Education and Livelihood’ (PAHELI) is a rapid assessment of the prevailing status of human development, covering four major sectors: life and livelihood, water & sanitation, maternal & child health, and education & literacy[11]. It comprises of a set of simple survey formats that can be used by citizens to track progress towards the ‘Millennium Development Goals’ (MDGs), as well as assess the progress towards national objectives of poverty reduction, social protection and development of human capabilities.

The PAHELI survey was carried out in eight districts spread across seven states – Udaipur and Bhilwara (Rajasthan), Gumla (Jharkhand), Hardoi (Uttar Pradesh), Korba (Chhattisgarh), Nalanda (Bihar), Rajgarh (Madhya Pradesh) and Sundargarh (Odisha) – in the second half of 2011. 60 villages were selected randomly from each district and 20 households were selected from each of these 60 villages. This gave us a sample of 1200 households per district.

The questionnaire related to maternal and child health consisted of a series of questions which enquired whether the female respondent has accessed health care facilities in the period before, during and after pregnancy; the role of health workers such as ASHA and Auxiliary Nurse Mid-Wife (ANM); and most importantly, whether the pregnant woman received benefits under JSY after delivery and what impediments, if any, were encountered while obtaining these benefits. These questions were asked only to those women who had a child in the age group of zero to three years as on the date of survey.

In the next part, i.e., Part II, we analyse the performance of the scheme with respect to some specific indicators such as the proportion of institutional deliveries out of total deliveries, receipt of cash benefits, mode of payment, amount received, etc.


[1] Press Information Bureau, Prime Minister sets up the Architecture for Cash Transfers, September 28, 2012

[2] Accountability Initiative was a knowledge partner in this exercise.

[3] Maternal deaths in India account for 19.5% of the global maternal deaths (See Trends in Maternal Mortality-1990 to 2010 for details). Though maternal mortality ratio (MMR) has declined from 254 in 2004-06 to 212 in 2007-09, it remains high (Office of Registrar General, 2011).

[4] Low performing States are the ones where the proportion of institutional delivery was very low at the start of the NRHM. These include Jammu & Kashmir, Himachal Pradesh, Uttaranchal, Uttar Pradesh, Bihar, Orissa, Jharkhand, Madhya Pradesh, Chhattisgarh, Rajasthan, Assam, Arunachal Pradesh, Manipur, Meghalaya, Mizoram, Nagaland, Sikkim and Tripura.

[5] http://mohfw.nic.in/NRHM/asha.htm#abt

[6] Some States have divided this amount into three components- Rs. 250 for transport, which is given to whoever pays for the transport (may not be ASHA), Rs. 200 as an incentive for ASHA (non-transferable) and Rs. 150 if ASHA escorts woman to the facility/ stays with her.

[7] The underlying data has been obtained from the NRHM documents and through the RTIs filed by Accountability Initiative.

[8] Lim et al., 2010; Dongre, 2012 (revised); Joshi & Sivaram, 2012 (personal communication)

[9] CORT, 2007; UNFPA, 2009; NHSRC, 2011; NRHM, 2011

[10] The States in North-East and Union Territories are excluded in these calculations.

[11] See PAHELI Report (ASER et al., 2012) for details (http://www.asercentre.org/Keywords/p/63.html).

All for One and None for Another? Entitlements, Attendance and Conditional Cash Transfers in Bihar: Part II

Since mid-January, Bihar’s public schools have seen great activity as an ambitious campaign to distribute student entitlements was rolled out. These entitlements are given out each year; however, this year there is an added twist in the form of a required attendance rate of 75 per cent between April and September 2012 to be eligible. As mentioned in my last post, the second part of my blog discusses the efficacy with which the distribution campaign has been designed and implemented in Bihar over the past few weeks. It also touches upon the scope for conditional cash transfers in the Indian education context.

Lack of timely communication and preparation

As per the directions of the Government of Bihar (GoB), after instructions and details of the campaign had been shared with headmasters and teachers, lists of eligible students were to be submitted to block officials by January 4th. These were then to be forwarded to the District. What I witnessed, however, was a huge delay in sharing this information with the headmasters and teachers, as well as the larger community. In Nalanda, for instance, headmasters were not informed of the date when the camp was to be held in their schools until January 12th, only three days before the campaign was due to start. Coordination at the district-level had been difficult and, till the 14th, locations of where the camps were to be held were still being finalised. While the number of Panchayats to be covered had been decided upon earlier, the actual schools had not.[1] In Purnea, due to delays in the collection of lists of beneficiaries and of correct school bank account numbers, the campaign started four days late (on January 19th).

More importantly, the details and rationale behind the new conditionality attached to the benefits were not explained in advance to the students and their families. What ensued as a consequence was considerable agitation from parents and students, questioning why some students have not received the benefits.. For instance in Purnea, the first day of the camp (January 19th) saw a massive protest at the Purnea Collectorate by high school girls demanding cycles for all students (Hindustan, January 20, 2013). Students and parents have also been reported to hold protests by blocking roads and highways in Purnea and its neighbouring district of Kishanganj. In other cases, under pressure from the local community, headmasters have felt obligated to distribute cash to those students without the requisite attendance rates. Thus, it’s clear that the GoB did not have a strong enough communication strategy and this has led to significant implementation problems at all levels of the system.

Parents at a school in Purnea demanding why their children were not being given their entitlements as well (January 2013)

Parents at a school in Purnea demanding why their children were not being given their entitlements as well (January 2013)

Inconsistencies, delays and irregularities in fund-transfers

Aside from this, there have been logistical problems related to fund transfers as well. In Nalanda, district-to-school fund transfers, albeit made online through the Real-Time Gross Settlement system (RTGS), were only made on January 12th, three days before the campaign was supposed to start. By the first day of the camp on the 15th, funds still had not arrived in the Panchayat we had visited. Instead, the teachers were busy disbursing uniform money that was to have been distributed in 2011-12! The district administration had directed that any funds left-over from the previous year, for instance because of lack of students’ bank accounts being opened, were to be distributed during this camp as well. There were also stark inconsistencies noticed in the implementation mechanism between districts. In Purnea, in contrast, not only was the campaign delayed, but excess funds were being transferred to schools. To illustrate, instead of transferring funds based on the number of eligible students, every school was transferred funds according to a formula of 75 per cent of the total student enrolment. Thus, if a school had 100 students, entitlements for 75 per cent would be transferred. Any funds left over were then to be returned to the district. Furthermore, no mention has been made in Purnea regarding the disbursal of any funds remaining from FY 2011-12.

Lack of strict monitoring

These instances are only the tip of the iceberg. As pointed out in Part I of my blog, it is widely accepted by the administration and teachers that attendance rates in Bihar are low (see PAISA District Studies 2011 for more details). Compounding the problem of linking attendance to benefits is the contributing factor of double enrolment (that is, children enrolled in both government and private schools) [2] Thus, even before the campaign had begun, state-level officials anticipated two developments on the ground: a. manipulation of data;[3] or b. backing away from the true data that comes out. However, apart from the internal and external monitoring mechanisms already in place (mentioned in my previous blog) no explicit measures to address these problems were shared, nor any to verify the data generated at the school-level. As mentioned above, parents are already questioning the veracity of the lists submitted and demanding that these numbers not be taken into consideration. In a significant number of visits we had made, we did not find the presence of public representatives or other officials. Even on the first day of the campaign in Nalanda, the Mukhiya (Gram Panchayat President) did not venture out of the Block Resource Centre adjacent to the school where the camp was being held.

Where officials did go, they had a tough time explaining the campaign’s rationale and details to parents and guardians. Moreover, in Purnea, district- and block-level officials were observed questioning headmasters during a school-visit about the distribution, but it remains to be seen what kind of reporting will be done and follow-up action taken in cases where any kind of mismanagement is discovered. At a monthly block-level meeting held in Purnea on February 4, it was observed the Block Education Officer (BEO) asked all headmasters present to certify they had only given out entitlements to those students who had 75 percent attendance. This was done without asking for any verification of the same and, of course, all present duly provided their certifications. Currently, there is no way of knowing the extent to which teachers and headmasters have used their own discretion to decide which students are eligible. Therefore, the question also arises as to whether students from marginalised backgrounds have truly been covered or not.

Block official explaining details of the distribution camp to students (left) and students receiving their entitlement for uniforms – due to them from the previous year, FY 2011-12 (right).

Block official explaining details of the distribution camp to students (left) and students receiving their entitlement for uniforms – due to them from the previous year, FY 2011-12 (right).

Based on a “voucher drawal” system, cloth and receipts (also called “vouchers”) are examined by teachers before the cash entitlement for uniforms is handed out. The headmaster at this school shared that, in case it is different from the norm specified, a student will be reimbursed only the amount that she has spent. Students signed three registers in this school – one for the school’s records and two to be submitted to the administration.

Based on a “voucher drawal” system, cloth and receipts (also called “vouchers”) are examined by teachers before the cash entitlement for uniforms is handed out. The headmaster at this school shared that, in case it is different from the norm specified, a student will be reimbursed only the amount that she has spent. Students signed three registers in this school – one for the school’s records and two to be submitted to the administration.

Furthermore, issues related to corruption and security may also arise; according to field reports, no explicit monitoring is being undertaken to ensure that the amount withdrawn from the school’s bank account is the total amount that is actually distributed. Given these situations, stricter monitoring of these camps, both internal and external, is imperative.

What next?

There are several issues and challenges associated with this campaign and with such conditional cash transfers in general.[4]  

First, three to four weeks has clearly not been enough time to lay the ground-work for such an ambitious campaign. Logistics have been hard to coordinate and field-work in both districts reveals that, till date, funds for uniforms are being distributed more regularly while the distribution of other benefits has been slow. Complete funds for FY 2012-13 have not yet been received in all schools. Reports now point to the campaign extending at least into the first two weeks of February; at this rate, the amount of disruption in classroom learning would become quite significant. Not only that, if this form of entitlement distribution is to be institutionalised in the state in coming years, then clearly the timing and means of communication at all levels needs to be thought through further. Second, the appropriateness of such conditional cash transfers in the Bihar public education context needs more debate. Given Bihar’s past experience with low attendance and double enrolment, a strong argument can be made for linking entitlements with attendance; teachers and administrators already do. However, as my colleague Uthara wrote recently, “[t]he efficacy of a cash transfer scheme, like all other schemes, would […] depend largely on its specific design, and how well suited it is to the context to which it is being applied.” A cash transfer scheme is usually designed to reduce delays and leakages in benefits reaching the target populations. In this case, with the added conditionality of 75 per cent attendance between April and September, the issue of delays would still not be addressed, since the earliest students would get their benefits would be October.

Aside from the communication and implementation problems described earlier and the fact that this campaign is in conflict with Right to Education (RTE) norms, what is more worrying is that it is seen as an end in itself. Such conditional cash transfers may well work to incentivise children to attend school in the short-term. However, in a supply-driven system such as the Sarva Shiksha Abhiyan, without a focus or link with the larger issues, such as quality of teaching-learning, teacher absenteeism, good quality physical infrastructure, adequate monitoring and sanctions, and community empowerment and involvement, it is hard to see this campaign achieving sustained attendance rates in the long-run. Without empowering parents and communities to take greater ownership of their schools, doling out conditional incentives may not lead to long-term change in Bihar’s government schools. Thus, more rigorous planning, learning from the experience of other countries (such as rigorous trials in Mexico, Brazil and elsewhere), and linking these incentives to the larger objective and context of quality education are the need of the hour.


Acknowledgments: Dinesh Kumar and Seema Muskan, PAISA Associates in Nalanda and Purnea districts, contributed to this blog with reports from the field.


[1]At least some blocks in Nalanda had conveyed camp dates to headmasters during a special meeting held on January 12 (a Saturday); it may be possible that these were not shared with the District Administration until later. Headmasters shared that not enough notice was given to them regarding the camp dates since schools had closed in the first week of January due to unexpectedly cold weather.

[2] According to the Annual Status of Education Report (Rural) 2012, the proportion of students enrolled in private schools in rural Bihar is around 10 per cent in 2012 for Standards II and IV. While an increasing trend is observed for these Standards between 2008 and 2012, the opposite is observed for Standards VI and VIII over the same period. In contrast, overall rural India figures point to a consistently increasing trend for all four Standards.

[3] In this case, “manipulation of data” implies the inflation of student attendance rates.

[4] See here for my colleague Uthara’s blog on cash transfers entail and here for Accountability Initiative’s compendium of resources on direct cash transfers. The World Bank’s Policy Research Report on conditional cash transfers can be accessed here.

All for One and None for Another? Linking Entitlements and Attendance in Bihar: Part I

Picture this: a sunny winter morning, bright yellow mustard fields in full bloom, children in assorted uniforms making their way to school in rural Bihar. As the rest of the Delhi team continued working on the PAISA-MDM report, I’d arrived in Bihar last month to learn more about a much-publicised government campaign to distribute entitlements to government school children through cash transfers. The entitlements include uniforms, scholarship, financial incentives (protsahan), and cycles (for high school students), to be distributed through various educational schemes of the Government of Bihar (GoB).[1] But these entitlements are already given out each year; so what was different this year? As it turns out, quite a lot. In this two-part blog, I first discuss the norms of these schemes, then how the campaign is being implemented on the ground in Bihar.

What’s different this year?

According to the Right to Free and Compulsory Education Act (henceforth, RTE Act), all students – girls and boys, regardless of socio-economic background – are entitled to textbooks, uniform and transport allowance. The GoB also offers other monetary and non-monetary incentives mentioned above, aiming to increase educational attainment[2] in the state. In most cases, funds for these schemes flow down to the school-level quite late, by December or even later in subsequent years. To illustrate, according to PAISA District Report Studies 2011, almost half of all uniform receipts for financial year (FY) 2009-10 occurred in FY 2010-11 in Nalanda district; this proportion was 44 percent in Purnea.

    1.       Direct, more visible cash transfers to students

In elementary schools, up until two years ago, all entitlements (except for textbooks) were disbursed in cash or by cheque in Bihar. Since 2011-12, however, money for uniforms was to be deposited directly in students’ bank accounts, after which it was expected that the families would buy the uniforms. In contrast, scholarships and protsahan were to continue being handed out in either cash from the Gram Panchayat (for classes 1-6) or by cheque from the District Welfare Officer (for classes 7-8). The norms for these schemes are given below in Table 1.

Table 1: Norms for Various State Educational Schemes, Bihar, 2012-13 (Y in a cell indicates the scheme is applicable to the category)

Beneficiaries / State Schemes Boys Girls Scheduled Caste (SC)/ Scheduled Tribe (ST) Backward Class & Very Backward Class Minority Amount(s)
Standard (Std) Amount (Rs.)
Chief Minister’s Uniform Scheme for Boys and Girls


    Y      Y          Y         Y       Y 1-2


400
3-5 500
6-8 700
Bihar Shatabdi Chief Minister’s Uniform Scheme for Girls      Y             Y          Y        Y   9-12 1,000
Chief Minister’s Cycle Scheme for Boys and Girls     Y      Y            Y            Y       Y   9-12 2,500
Chief Minister’s Financial Incentive (Protsahan) Scheme for Girls      Y           Y Upon completion of Std. 10, if receive First Division in exams and continue to Std 11 10,000
Scholarship Scheme (for students from Backward and Very Backward Classes     Y      Y           Y 1-4


50/month
5-6 100/ month
7-10 150/month (for 12 months, for those whose family earns less than 1,00,000 per year.
Scholarship Scheme for Scheduled Caste (SC) / Scheduled Tribe (ST) students     Y      Y            Y  1-4 50/month
5-6 100/ month
7-10 150/month (for 12 months)
Scholarship Scheme for Minority Students     Y      Y   1-5 100/month
6-10 100/month (for day scholars whose family earns less than 1,00,000/ year; separate norms for hostellers). 30% total funds reserved for girls
Financial Incentive (Protsahan) for Minority Students     Y      Y         Y  Upon completion of Std. 10, if receive First Division in exams and continue to Std. 11 10,000

This year, however, the distribution procedure has changed, in part due to difficulties in opening younger students’ bank accounts in 2011-12.[3] The campaign now involves money being sent to each school’s account, from where it would be withdrawn and then distributed in camps held in each school. These camps are to be conducted Panchayat-wise over a two-week period (January 15-31, 2013). While cash amounts for scholarship would be given out directly to eligible students, the protsahan would still be given by cheque. Entitlements for uniforms would be now doled out based on a “voucher system.”[4] The idea is to reimburse students after proof of purchase (both cloth and receipts, or “vouchers”) has been presented to the teachers.

    1.        Direct link of entitlements with attendance

However, the biggest change this year is a controversial condition imposed on the distribution: only those students who have an attendance rate of 75 per cent or more between April and September 2012 will be entitled to receive these benefits. It is widely known that attendance rates in Bihar are typically low, hovering around 50 per cent (PAISA 2011), and that the government is attempting to remedy the issue. As of right now, it is uncertain whether the government will continue to link this condition on entitlements to boost attendance in coming years, but in the event it does, it would automatically imply that the earliest the distribution of benefits could occur would be as late as October,[5] more than half-way into the school year.

    1. Wide participation of public representatives and third-party institutions in monitoring

Lastly, the administration has devised monitoring mechanisms for the campaign which it considers to be quite novel and stringent. They require the officers of the state, district, block SSA administrations to undertake daily rounds of the camps, along with local police officers and officers from the District Magistrate’s office and Welfare Departments.[6] Additionally, each district has to ensure that audio-visual recording is undertaken at each camp. However, during our field-visits to schools, we observed the recording taking place in only a couple of instances.External monitoring of the camps is to be conducted by the AN Sinha Institute of Social Studies, based in Patna. Volunteers from a local college in each district have been trained by the Institute and are to visit a selected sample of schools across the state. Finally, public representatives – MPs, MLAs, Gram Panchayat Mukhiya and Sachiv, School Management Committee members – and the village community at large are supposed to play a monitoring role as well.

Big political push

Interviews with members of the SSA administration at state, district and block-levels revealed that the administration has been looking for more visible ways to incentivise enrolment and attendance; in the words of a senior state-level official, the “political executive would like a big show.” This campaign is also seen as a follow-up to the GoB’s drive last year to reduce double enrolment in government and private schools – where children were on government schools’ rosters but really attended private unaided schools. Almost all officers and teachers interviewed were of the opinion that this condition of required attendance is necessary; that the State Government wants to send out a clear message that these benefits can only be availed of if a child has been to school regularly.

Conditional cash transfers linking monetary and in-kind benefits with school attendance are not new and have been successful elsewhere, as in Mexico.[7] However, the fact remains that this campaign is conflicting with RTE norms, and, in the absence of clearly-communicated guidelines to the concerned officials, has seen shoddy implementation. Senior officials were willing to relax the “eligibility criteria” only in the case of the Chief Minister’s Cycle Scheme for high school girls, conceding that it would be hard for girls to come to school without a bicycle and attain the required attendance rates.

Elementary school students with the cloth they’ve bought for their uniforms, waiting to be reimbursed for their entitlement. Cloth and receipts both must be shown at the school as proof of purchase to avail of the cash reimbursement (Nalanda, January 2013)

Hurriedly conceived, hurriedly rolled out

It appears that greater thought needs to go into the implementation of such a transfer scheme. Linking entitlements with attendance has posed significant problems in Bihar, especially in terms of logistics and the short time given to prepare for the campaign. Teachers, headmasters, and block officers began hearing about the campaign in early December through newspaper articles. However, in Nalanda for example, block officials were given training and copies of guidelines at the District Resource Centre (DRC) on December 22, 2012, during the monthly meeting; guidelines and necessary forms to prepare lists of eligible students were then shared with the schools between December 24 and 28th. These were to be filled and returned to the block by January 4th.  In contrast, in Purnea, Block Education Officers (BEO) had not even received a copy of the campaign guidelines, with instructions and details only being shared verbally in meetings; similarly, details were shared with headmasters verbally during block-level meetings. Thus, awareness levels of the campaign’s details – such as how to hold camps, district-to-school fund transfer information, and campaign schedule for each school – were low at the school-level. More worryingly, clear information about which children would be given their entitlements – and why – had not been adequately shared with parents.

It is laudable that the Government of Bihar wants to visibly address the key problem of attendance and enrolment in its schools, aiming to increase educational attainment. However, questions regarding the design and efficient implementation of the campaign remain. In Part II, I’ll discuss how the campaign and its monitoring are being implemented at the school-level in Nalanda and Purnea, the challenges being faced (the campaign will continue well into February now), and the scope for such a conditional cash transfer scheme in this context.

Acknowledgments: Dinesh Kumar and Seema Muskan, PAISA Associates in Nalanda and Purnea districts, contributed to this blog with reports from the field.


[1] In all there are eight Government of Bihar schemes through which benefits are being given to students in primary, middle and high schools. These are: 1. Chief Minister’s Uniform Scheme; 2. Chief Minister’s Uniform Scheme for Girls; 3. Chief Minister’s Cycle Scheme for Girls; 4. Chief Minister’s Cycle Scheme for Boys; 5. Bihar Shatabdi Chief Minister’s Uniform Scheme for Girls; 6. Chief Minister’s Financial Incentive Scheme for Girls; 7. Scholarship Scheme (for students from Backward and Very Backward Classes; for minorities; and for Scheduled Caste and Scheduled Tribe students); and 8. Financial Incentives for Minority Boys and Girls.

[2]Educational attainment here refers to the number of years spent in school, through increased enrolment and attendance. Depending on whom one talks to, officials sometimes also link these incentives indirectly to learning levels.

[3] According to teachers and the administration, banks were not in favour of opening accounts for so many minors where money would be deposited and then almost immediately withdrawn. A lack of human resources in banks to manage such a huge number of accounts was also cited as a reason.

[4] Apart from the fact that in 2011-12, cash entitlements for uniforms in Nalanda and elsewhere had not been distributed due to a lack of functioning bank accounts for students, anecdotal evidence suggests that in the past issues have also been faced with households not utilising funds towards uniforms as required.

[5] The reason for this being that distribution could only occur after attendance rates have been recorded for the previous six months (April to September) and funds accordingly transferred to the districts for distribution.

[6] Three different welfare departments of the state government are the source of funds for scholarships and protsahan: Backward and Very Backward Classes Welfare Department; SC and ST Welfare Department; and Minority Welfare and Information Department. The only convergence with these Departments for the current campaign is that they release funds and monitor the camps.

[7] See here and here for analyses of the Programa Nacional de Education, Salud y Alimentacion (PROGRESA), a key poverty alleviation programme of the Government of Mexico which targets poor, rural households on three associated and complementary components: education, health and nutrition. In particular, mothers in eligible households are given money for each school-going child who attends at least 85 percent of classes and completes high school. School supplies are also subsidised. 

Demystifying Cash Transfers

In his 2011 Budget Speech, the Finance Minister announced the replacement of the Public Distribution System with the direct transfer of subsidies to individuals living below the poverty line[1].  What has ensued since is a disparate range of opinions on the issue in the mainstream media and policy and academic circles. The conversation around cash transfers is progressing at a very rapid rate, (take a look at Accountability Initiative’s compendium of resources on D.C.T.s here),so much so that the popular opinion on the subject has been obscured. Understanding cash transfers as a tool for governance would require that we distill the political discourse from its policy implications.

In this blog post I shall explain what Cash Transfers are, discuss the various forms they may take and explain what issues related to governance they can be realistically expected to resolve.

In a service involving Cash Transfers, the state transfers cash directly into the accounts of the intended beneficiary so that he or she can use this money to purchase essential goods (food grains) and services (insurance, hospital treatment). These can be availed of from either the open market, or a stipulated government service provider. (This varies from scheme to scheme)

These cash transfers could be either conditional or unconditional.

A conditional cash transfer scheme would require the intended beneficiary to fulfill a certain behavioral condition in order to receive the cash benefit. The accompanying condition is designed to incentivize a developmental outcome. For example, in the Janani Suraksha Yojana (J.S.Y.) pregnant women are paid between Rs 1000 to Rs 1400 to deliver their babies in a hospital (or with the assistance of a qualified health worker in some cases)[2]

Unconditional cash transfers on the other hand do not require the beneficiary to fulfill any such behavioral condition – they receive the cash simply by virtue of belonging to a certain socio-economic or demographic bracket. Old age pensions are an example of unconditional cash transfers, wherein people receive the benefit by virtue of belonging to an eligible age group.

Cash transfer schemes, whether conditional or unconditional can be either universal or targeted. Universal schemes include all members of a said population (The Janani Suraksha Yojana for instance is universal in states deemed as ‘Low Performing’)[3] Targeted cash transfer schemes identify a certain segment of the population (such as B.P.L. or A.P.L. families). as recipients of the benefit.

The efficacy of a cash transfer scheme, like all other schemes, would therefore depend largely on its specific design, and how well suited it is to the context to which it is being applied.

Cash transfers operate on the rationale that the beneficiary has complete control over the cash and/or is now free to choose where he or she will avail of a service, if the said scheme allows him to make that choice (The P.D.S. cash subsidy, for instance will allow to the beneficiary to chose what shop he or she will buy grain from.) Proponents of the idea claim that D.C.Ts ‘improve the efficiency and reach of welfare benefits for the underprivileged.[4]  The Government of India in a recent press release stated that Direct Cash Transfers (D.C.T.) were a means to “improve targeting, reduce corruption, eliminate waste, control expenditure and facilitate reforms.”[5] It might be useful to use the terms in this statement as our main points of enquiry  

Firstly, can Direct Cash Transfers Improve Targeting?

In fact the converse is true. Cash Transfers are simply a means for streamlining payments, and cannot in themselves ensure that all eligible persons are successfully targeted by a program. A sound targeting strategy is actually a prerequisite to the effectiveness of cash transfers and not vice versa. A study by Rema Hanna, Abhijit Bannerjee, Benjamin Olken and Vivi Atlas discuss in detail the various methodologies that can be used for accurately identifying eligible members for Cash Transfer Schemes.[6] It is based on the very premise that iIdentifying or ‘targeting’ the poor to determine eligibility for a government’s anti-poverty program is challenging because the government often lacks verifiable records of people’s income and assets. Targeted social programs can have mis-targeting rates of over 40 per cent which means that many social programs designed to help the poor never even reach them.

Secondly, can Direct Cash Transfers Reduce Corruption?

A cash transfer scheme could potentially help prevent corruption through leakages and diversions (because there are no physical resources such as grains or medicines that need to be handled anymore) and even  duplication fraud if it is leveraged on a technology platform (such as the current PDS subsidy transfer that operates through aadhar).   In a 2010 study, Dutta, Howes and Murgai[7] concluded that the popular DCT based social pension schemes (old age pension and widow pension) in Karnataka and Rajasthan have much lower levels of leakage than the public distribution system (PDS) . The authors argue that one of the possible explanations of this could be low levels of discretion in the cash transfer process.

That said, corruption in the delivery of welfare services has multipronged manifestations, and it is unclear how the statement differentiates between its varying forms – corruption at the lowest levels for instance, is not merely limited to pilfering by middlemen. A paper by Jennifer Davis[8] on ‘Corruption in Public Service Delivery’ cites evidences from the water and sanitation sector in India, where ‘corruption’ practices took as varied forms as ‘ customers meting out informal payments to expedite meter repairs’  and unfair bidding practices to private contractors amongst others. These and other prevalent forms of corruption, such as non transparent practices in remote and local decision making processes cannot be tackled by cash transfers.

Thirdly, Can Cash Transfers Eliminate Waste and Control Expenditure?:

Describing the government’s ambitious direct cash transfer scheme as a “powerful tool”, Reserve Bank Deputy Governor K C Chakrabarty has said the initiative will help reduce fiscal deficit, which in turn will also bring down inflation if implemented well.. He accrued this to the stimulus to the economy caused by an increase in public spending due to cash actually reaching the hands of the beneficiaries, which could be significant given that estimates posit the loss due to subsidy leakages at nearly 40 percent. [9] Others opine that beneficiaries are rendered vulnerable to the increasing cost of goods and services due to inflation, an argument that has not as yet seen a direct counter.

The National Institute of Public Finance and Policy recently conducted a cost benefit analysis of aadhar enabled cash transfers and concluded that despite all costs, the returns to the government through the program for a host of social sector schemes was as much as 52.85 per cent.[10] The study attributed this to the lowered operational costs that cash transfers enable.

And Lastly, Are Cash Transforms a means to Facilitate Reforms? :

While the term ‘reforms’ is very broad, It is clear from the literature available that cash transfers hold promise to correct certain very specific issues ailing public service delivery – namely leakages, diversions and fraud. As I’d mentioned above, evidences suggest that they significantly lower operational costs and may also have other intangible benefits.  The impact of cash transfer programs on social policy varies from place to place as a consequence of the differing nature in program design and the context in which they operate. Papers have concluded that conditional cash transfers have caused an increase in the use of services – school enrollment rates have seen significant increases in middle income and low income countries such as Nicargua, Mexico and Barbados.[11] In India, the success of the Janani Suraksha Yojana, another cash transfer scheme has been well documented. [12]

The impending need in the Indian context currently is for rigorous trials and research to bolster the case for cash transfers. That the Government of India has taken to cash transfers with alacrity is certain, but there is a need for the decisions to be backed by a sound, evidence backed policy rationale.


[1] Budget 2011-12, Speech of the Minister of Finance, http://indiabudget.nic.in/budget2011-2012/ub2011-12/bs/bs.pdf

[2] Guidelines for Janani Suraksha Yojana, Ministry of Health and Family Welfare, [2] JSY Guidelines, Ministry of Health and Family Welfare, Government of India, http://www.mohfw.nic.in/NRHM/RCH/guidelines/JSY_guidelines_09_06.pdf

[3] The scheme has identified Uttar Pradesh, Uttaranchal, Bihar, Jharkhand, Madhya Pradesh, Chhattisgarh, Assam, Rajasthan, Odisha and Jammu and Kashmir as “Low performing states” based on their lower rates of institutional delivery.( From Guidelines of the JSY, 2006, Ministry of Health and Family Welfare http://mohfw.nic.in/WriteReadData/l892s/file28-99526408.pdf)

[4] Interim Report of the Task Force on Direct Transfer of Subsidies on Kerosene, LPG and Fertiliser, Chaired by the Chairman of the UIDAI, June 2011, http://finmin.nic.in/reports/Interim_report_Task_Force_DTS.pdf

[5] Press Information Bureau, Press release by Prime Minister’s Office, dated 28th September 2012, http://pib.nic.in/newsite/erelease.aspx?relid=88048

[6] Bannerjee Abhijit, Atlas Vivi, Tobias Julia Olken Benjamin,Hanna Rema, Targetting the Poor: Evidence from a field experiment in Indonesia, May 2010, http://economics.mit.edu/files/5577

[7] Murgai Rinku, Dutta Puja, Howes Stephen, Small But Effective : India’s Targetted Unconditional Cash Transfers,  ASARC working paper, 2010,http://www.crawford.anu.edu.au/acde/asarc/pdf/papers/2010/WP2010_18.pdf

[8] Davis, Jennifer, Corruption in Public Service Deliver,  Massachusetts Institute of Technology, http://www.google.co.in/url?sa=t&rct=j&q=&esrc=s&source=web&cd=1&ved=0CDoQFjAA&url=http%3A%2F%2Funpan1.un.org%2Fintradoc%2Fgroups%2Fpublic%2Fdocuments%2Fapcity%2Funpan047339.pdf&ei=DpP3UK21J8LprQe6pYD4CA&usg=AFQjCNFMpihaIstEmlUxSSOapc83NE3AJQ&sig2=wd0jm3TMU3dkQAJvJMqf9g&bvm=bv.41018144,d.bmk&cad=rja

[9] Ghosh Jayati, ‘The Siren Song of Cash Transfers’, The Hindu, March 2011, http://www.thehindu.com/opinion/lead/article1504114.ece

[10] A Cost Benefit Analysis of Aadhaar, National Institute of Public Finance and Policy, November 2012, http://planningcommission.nic.in/reports/genrep/rep_uid_cba_paper.pdf

[11] Fiszbein Ariel, Schady Norbert, Conditional Cash Transfers, Reducing Present and Future Poverty, World Bank Policy Report, 2009.

[12] Dongre, Ambrish A. and Kapur, Avani, How is Janani Suraksha Yojana Performing in Backward Districts of India? (January 3, 2013). Available at SSRN: http://ssrn.com/abstract=2197248 or http://dx.doi.org/10.2139/ssrn.2197248

Of Dolphins, Transparency and TABridge

“We policy people are like dolphins – extremely intelligent, but it looks like nobody knows how to communicate with us.” This quote, by Matt from Indigo Trust is by far my favourite quote from the TABridge session a few weeks ago at Glen Cove, New York. It beautifully sets the context of why this conference was held: to help foster conversation between technology experts and groups working on transparency and accountability (T&A) issues. The term T&A was left loose to encourage participation. Participants ranged from organizations working on natural resource governance, budget transparency, open governments, and data transparency, as well as technology experts on mobiles, visualization and so on. Accountability Initiative was invited to share its experiences, both for its work on budget transparency and for its experience in facilitating similar conversations between policy wonks and technology experts within India (at the bar-camp we held in 2010).

The 3-days session was structured as an unconference (a user-generated conference) and, in my opinion, this format was perfect for fostering conversations about a complex problem. And when I say complex, I am using my words very carefully. Influencing public policy and public institutions to be more transparent and accountable lies in a category of problems defined as “wicked problems” (introduced by Horst Rittel[1] and Ron Heifetz in the early 1970s). In layman’s terms, problems can be classified as simple, complicated and complex (or wicked)[2].

–       “How do I attend the Glen Cove conference?” is an example of a simple problem. You follow a series of steps like booking an air ticket, talking to the coordinator and so on, and you can attend it.

–       A complicated problem would be something like putting a man on the moon. It requires coordination between various teams and hundreds of people, but once you put a man on the moon, it becomes a solved problem. Repeat the steps and most likely you would have another person on the moon.

–       And then there are complex problems. The characteristics of complex problems can be seen in Rittel’s paper, but I will use the analogy of raising children to explain it. Previous expertise in raising children can contribute to better parenting but it is neither a necessary nor sufficient condition to assure success in raising the next kid. Formulae don’t work in parenting. Similarly with introducing transparency and accountability in a community: you have to know the community and the context afresh every time.

Introducing transparency and accountability seems to be a complex problem if we judge it against the ten characteristics identified by Rittel in his paper. But why does this matter? Understanding that we are dealing with a complex problem, and not just a complicated problem, helps us choose the correct problem-solving technique. Research on complex-problem solving is ongoing, but here are a few key points to keep in mind

  1. Recognition of ‘Asymetry of ignorance’ – Rittel stated that the knowledge required to solve a complex (wicked) problem never resides with a single person. Instead, there is symmetry of ignorance, where both knowledge and ignorance are distributed equally over all participants and no-one ‘knows better’ by virtue of having an advanced degree or being familiar with the subject.” Accordingly, the process of problem-solving must involve those who are directly affected by the problem so as to come up with sustainable solutions.Agenda-setting at TABridge was treated as a complex problem – all of us were equally ignorant (and in the same breath, equally knowledgeable) about technology and transparency. So we sat down in groups and discussed the challenges we were facing in implementing technology and introducing transparency, and the broader trends we wanted to understand. We jotted them on post-its put up on a wall. We then went through them, and either volunteered to speak about a topic, or expressed interest in some session. Through this process of collective agenda-setting, we came up with an intense 3-day session list.

    Similarly, when solving a budget transparency problem, it’s important to involve all stakeholders including communities in the conversation. Experts don’t know it all and neither do communities.

  2. Defining terms and outcomes – All of us are working towards a future where there is more transparency and accountability.

    These states can be further broken down. Take the example of participation in an SMC – to a parent that means signing off on cheques, to a teacher it means just reading out the statement of accounts to the parents, while to the government it means that parents actually set the school agenda for the year. Thus, even a simple aspirational state can be broken down and this process can become iterative.

    Rittel recognized this iterative decomposition as a characteristic of complex problems when he said, “There is no definitive formulation of a wicked problem.” Research on complex problem-solving shows that the way forward is to develop a shared understanding amongst stakeholders and subsequently evolve a shared goal. This can’t be emphasized enough. In the absence of this, whatever solution, no matter how technically sound, is most likely going to fail[3].

    Problems in developing a shared understanding:
    Developing a shared understanding and a shared goal is difficult to achieve in general, and specifically on policy issues, since it involves understanding the data behind events. This brings me to a topic of data literacy. In an increasingly data-driven society, flawed interpretation can lead to a wrong understanding of the problem or worse, a huge waste of public money. Richard Sterling, former head of the web site, data.gov.uk said it best when he stated:[4] “individuals may be coming to conclusions that weren’t quite valid after browsing the 5,850 data sets available on the site.”  In fact, this paper here, explores how a flawed understanding of data can lead to a huge waste of public money.[5]

    To avoid such problems, data-literacy needs to be inculcated as an important civic-skill. But what is data-literacy? From our session on this topic at TABridge, I realized that this skill needs to be seen both from the perspective of the provider and the recipient of data. On the one hand, a data-literate provider would be able to put data out in a manner that allows for simple and correct interpretation. He/she would have a good understanding of data scraping, publication and visualization tools, as well as knowledge of data portals so they can put their data out.  A data-literate recipient, on the other hand, would be one who can correctly identify, retrieve, evaluate and use information, not only to ask, but also answer meaningful questions of data.

  3. Strategy not technology – This point flows out from the previous one and going into it would take an entire blog post by itself. Put simply, it refers to how technology needs to be seen as a step towards achieving a shared goal, rather than as the end goal, as a lot of non-profits tend to do.

Hopefully by applying what we’ve learnt from complex problem-solving us dolphins would be able to talk to the rest of the world, collectively decide on what a more transparent and accountable society means, and use technology and data to reach our goals.


[1]  Rittel, Horst, and Melvin Webber; “Dilemmas in a General Theory of Planning,” pp. 155–169, Policy Sciences, Vol. 4, Elsevier   Scientific Publishing Company, Inc., Amsterdam, 1973.

[2]  I got the idea of simple, complicated and complex problems from this blog, an excellent blog on how dialog-mapping is used for collaboration. http://www.cleverworkarounds.com/2012/09/08/confessions-of-a-post-sharepoint-architect-the-self-fulfilling-governance-prophecy/

[3]  Developing a shared goal can be done in one of two ways – authoritative or collaborative – and in his paper, Rittel hints at the advantages of the latter.

[4]  http://pearsonblueskies.com/2011/how-open-data-data-literacy-and-linked-data-will-revolutionise-higher-education/

[5]    The most dangerous equation of all – http://press.princeton.edu/chapters/s8863.pdf. This paper talks about how flawed interpretations of data can lead to loss of millions of dollars.

The Data Explosion: Big Data and Development

Velocity of data. Quantity of data. Big Data. These were some of the terms that caught my attention after reading Laina’s blog on Data Governance. I was particularly surprised by the figure that showed the varied skills that a data scientist is supposed to possess. I wondered what it is about the new kinds of data that are being created that make them so complex and difficult to analyse? While exploring this question, I was exposed to a variety of literature regarding the new types of data and in particular Big data. In fact if you look at the Google trends image below, you can see that the term Big Data has captured the popular imagination in the past couple of years1. However, till recently most of the applications of Big data have remained within the business realm. Only now are Governments beginning to see the possibilities Big Data could hold for policy making. In this blog, I will try and summarise what big data is and how it can make policies more effective.

Defining Big Data seems to be quite a tough job with different authors explaining the term in different ways2, however there seems to be some agreement that Big Data is a large volume of structured and unstructured data that is so large that it’s difficult to process using traditional database and software techniques3. It is data that is coming in at a great velocity, great variety and great volume. Data from cell phone GPS, data from climate sensors, data from social media are all being generated every second and constitute large datasets which come in without large time lags. Most of this data is being created passively by the data bearers i.e. they are not actively responding to a questionnaire to generate this data.

The main advantage this type of data offers is real time information, which can greatly reduce the time lag between the accumulation and analysis of data, and subsequent responses. The variety of data also allows for the creation of a broader profile of the trends in the society i.e. you have many more variables to analyse, this can allow you to create a better behavioural profile of the people in the area being analysed.

Big data has been used by companies like Google and Amazon to better understand the behaviour of their users and to use this information to optimise their websites and their sales4. The potential of this data is being recognised by governments as well5, and many researchers are beginning to show its uses in pre-empting possible outbreaks of diseases6, estimating GDP in real time7, even calculating where a person might be located at any point in time based on their past movements which were gathered through the GPS on their phones8.

So how does this type of data help us in policy making? Firstly, we can make much more informed decisions. If the government has to make a decision about when to implement a public health intervention in a village, for example, knowing the movements of the villagers and where they are at any point in time could be very useful. The government could use this data to identify the time at which most people are away in the fields and the time they are at home. This would help the government design a policy which is more targeted. Other issues like how people cope with shocks like inflation, natural disasters, unemployment etc. can also be understood much better using this data.

Big data could also help in assessing the impact of policy interventions, for example once the government has implemented the public health initiative, its impact could be seen in a number of ways- we could see reduced visits to pharmacies and hospitals, which could be checked with GPS information. Because of thereduced expenditure to households, more people might start saving which in turn could be represented in mobile based banking databases, collected in real time. There could be consequent increases in purchases of livestock and more investment in agricultural activities. However, if we see that visits to pharmacies remain the same or if there are increases in expenditure on medicines, we can analyse why the policy is not having the desired effect. Since this impact can be gauged much quicker, an adequate response can be implemented without much time lag. The point is that the impact could manifest across multiple databases which are being created passively. These databases, by design, have fewer missing values and they save a lot of input costs which would have been required to collect such data. Thus, an impact assessment can focus purely on the analysis aspect without worrying about the collection or quality of data.

However, there are a number of problems with using this data extensively. The primary issue is privacy; individuals need to have the right to control the information about them. Appropriate safety measures need to be in place for a well functioning system. These measures could be in the form anonymising datasets and strict controls on release of data.

Access and sharing are other issues that create bottlenecks to using big data. . Much of this data is held by private entities who may not be willing to release information as it could fall into the hands of competitors. Some of this data may not be collated in a usable format by the companies and a researcher may have to spend a large amount of time organising this data. Global Pulse, the UN body working in the field of Big Data, is trying to put forth the concept of “Data Philanthropy” to encourage companies to donate their datasets.

Moreover, even if this data is available, the technical capacity required to use this dataset requires large investments and knowledge. Possibly, the private companies which have already made these investments could be used to structure this data and allow it to be interpreted, which brings us to another issue which is interpretation of data. With so many different data sources, the person studying the data must know what he/she is looking for and in which different datasets this could show up.

Despite all of these challenges, big data could possibly be very useful with its early awareness, real time data and lowered feedback gap. As Global Pulse states “the promise of Big Data for Development is, and will be, best fulfilled when its limitations, biases, and ultimately features, are adequately understood and taken into account when interpreting the data.”

1 http://www.google.co.in/trends/explore#q=big%20data; in fact google trends itself is a form of Big Data.

2 The following links are all interesting articles about Big data and its uses- http://blogs.starcio.com/2012/12/what-is-big-data-real-challenges-beyond.html, http://radar.oreilly.com/2012/01/what-is-big-data.html?cmp=ba-conf-st12-twitter-promo, http://www.weforum.org/reports/big-data-big-impact-new-possibilities-international-development

3 Most blogs and articles define Big data is this way, this definition is taken from http://www.unglobalpulse.org/sites/default/files/BigDataforDevelopment-GlobalPulseMay2012.pdf

4 Many companies have been using big data to improve and predict sales, there are many articles which talk about this trend and how the companies are using Big data analytics http://gigaom.com/2012/03/22/synthesizing-insights-and-capitalizing-on-consumers-digital-signals-structure-data-2012/

McKinsey published a report this year on how Big data is the next frontier for innovation- http://www.mckinsey.com/insights/mgi/research/technology_and_innovation/big_data_the

_next_frontier_for_innovation

Harvard Business review talks about big data as a management revolution and how users like Amazon embraced and utilized its potential – http://hbr.org/2012/10/big-data-the-management-revolution/ar/1

5 http://www.zdnet.com/blog/btl/u-s-government-commits-big-r-and-d-money-to-big-data/72760 & http://www.policyexchange.org.uk/images/publications/the%20big%20data%20opportunity.pdf

6 Paul, M.J. and M. Dredze. You Are What You Tweet: Analyzing Twitter for Public Health. Rep. Center for Language and Speech Processing at Johns Hopkins University, 2011. <http://www.cs.jhu.edu/%7Empaul/files/2011.icwsm.twitter_health.pdf>

7 Helbing and Balietti. “From Social Data Mining to Forecasting Socio-Economic Crisis.” As quoted in “Big Data for Development”, United Nations Global Pulse

8 “When there is no such thing as too much information” http://www.nytimes.com/2011/04/24/business/24unboxed.html?_r=1&src=tptw