Increasing Child Participation in Monitoring and Evaluating Mid-Day Meals

This year in May, a nine-year old in Scotland started blogging[1] about the quality of meals in her school, complete with a picture, a ‘food-o-meter’, that rated the meal on a scale of 1 to 10 and the number of pieces of hair in her food. When Martha Payne’s blog became popular, the local council panicked and banned her blog, fearing that the reports could get the catering staff fired. The Council’s reaction only increased Martha’s popularity. The media had a field day, celebrity chefs such as Jamie Oliver decided to intervene and the council had to retract the ban. As a result of the attention to her blog, Martha reports that the meals taste better and the portions are larger. Martha’s story offers a lesson that the Midday Meal (MDM) Scheme, the world’s largest school feeding programme can learn from: the need to place the key beneficiary, the child, in the centre of the monitoring and evaluation (M&E) process.

Launched as a centrally sponsored scheme in August 1995, MDM aims to improve enrolment and retention in (government and aided) schools, and the nutrition levels of children availing the scheme. MDM allocations stand at 31% of the total elementary education budget[2]. Over time, states have also adopted innovative MDM practices to increase the efficiency of the implementation of the scheme by involving children’s mothers, through Mahila Samakhyas (Bihar), Saraswati Vahinis (Jharkhand) and Bhojan Mata (Uttarakhand), in cooking and serving the food in schools[3].

Bihar and Jharkhand have involved children to a modest degree where Bal Sansads (Child Cabinets) oversee the distribution of MDM, check if children have washed their hands and cooks have worn their aprons. The MDM, counter-intuitively, does not have child representatives in the M&E process. Take Bihar, as an example. At present, Bihar has 6 bodies to monitor the scheme at the state, district, block and school level.

Bihar’s MDM Monitoring and Evaluation Structure[4],[5]
No. Individual / Group Task
1 State Steering cum Monitoring Committee At the District level there is a Nodal Officer – the District Magistrate and a District Resource Person (DRP) to monitor the scheme. Each DRP monitors 50-100 schools a month.
At the Block level, the scheme is monitored by Block Resource Person (BRP). Each BRP monitors 50-100 schools a month.
2 Bihar Rajya Madhyanha Bhojan Yojana Samiti’s Mid-Day Meal Cells


At the State level, the MDM Cell has a Director with a State Programme Coordinator, one Database Administrator, four Assistant Programme-Coordinators to assist him as well as a team of two Junior Monitoring Officers, four Assistants, one Account Officer and two Accountants to monitor and supervise the programme.
At district level, the cell has a District MDM In-charge (A senior Deputy Collector from the Bihar Administrative service) who is assisted by one District Coordinator, one Accountant-cum-Computer Operator and two Resource Persons to monitor and supervise the programme. The District MDM is in charge of checking if MDM has been prepared in all the schools, the quality of the food, if all schools have funds and food grains and the grievance redress mechanism.
At the block level the cell has one resource person to monitor and supervise the programme.

Additionally officers have been contracted – two resource persons at the District level and one at the Block level to provide regular monitoring and support

3 School Management Committee At the Block level, the Block Education Extension Officer holds a meeting with the Block Resource Person and members of SMC to monitor the utilisation of the MDM funds.
4 Monitoring Institutions[6] Bihar has two External Monitoring Institutions,

Jamia Millia, Delhi and  A.N. Sinha Institute of Social Studies, that monitor the regularity of delivering grains, cooking funds and serving meals. Also, they monitor the quality and quantity of meals and whether children were discriminated against during MDM, as well as the adequacy of cooking infrastructure.

5 Gram Panchayat/PRI members Provide monitoring support when required.
6 Online Monitoring System – mdmsbihar.org.in

BRPs and a Sub Divisional Education Officer (SDEO) send SMS reports to an online portal. Their tasks overlap with those of DRP and BRP of the Steering and Monitoring Committees.

Despite the complex monitoring and evaluation structure, cases of poor quality meals come to light only when there are glaring discrepancies, for example 60 children falling ill in West Bengal in July[7] or the alleged murder of a Standard Eight student for leading the protest against the poor quality of MDM in his school earlier this month, also in West Bengal[8].

While setting up blogs for all the recipients of the MDM – Martha Payne style – may not be feasible (yet) in India, a step towards involving the child directly in evaluating their meals can be made possible in the present M&E structure, through the Interactive Voice Response System (IVRS). Currently introduced in Uttar Pradesh and Bihar, the IVRS records teachers responses at the end of the meal every day, and makes this data available to the public real-time. The same process can be used to record children’s responses about the availability, quality and quantity of the meal served to them, instead of restricting the role of evaluator and monitor to adult members of school staff and management committee, and government officers. The impact of IVRS has yet to be assessed and there is a need to be cautious about the ability of technology to seamlessly integrate the student in the M&E process (verifying the authenticity of the recipient/data entered). However, the process can change the role the child from a passive participator in the M&E process, to a more active respondent. It can be an attempt to create a direct link between the planners and the recipient.


[1] http://neverseconds.blogspot.in/

[2] http://www.accountabilityindia.in/sites/default/files/mid-day_meal_scheme_2012-13.pdf

[3] http://mdm.nic.in/

[4] http://mdm.nic.in/Files/PAB/PAB2012-13/Bihar/1_AWPB_Wtite_up_2012-13.pdf

[5] http://mdm.nic.in/Files/Review/Reports/2010/Bihar%20RM%20report%20final-2010.pdf

[6] http://mdm.nic.in/Files/MI%20REports/Monitoring%20Institution%20list.pdf

[7] http://articles.timesofindia.indiatimes.com/2012-06-20/india/32335302_1_mid-day-meal-tribal-students-primary-school

[8] http://indiatoday.intoday.in/story/boy-killed-for-protesting-poor-quality-mid-day-meal-in-west-bengal/1/203772.html

Delving Deeper into PAISA Data

By now, you are all familiar with the PAISA reports and the DRC report. These reports have convincingly shown us that the current financial management system for elementary education is riddled with process-related inefficiencies. None of the tiers within the government (State/ District/ School) receive its total allocation, and there are significant delays in fund transfers.

Our data clearly points out that there are wide variations in different aspects of fund flows across districts, and even within districts. The proportion of schools receiving the annual SSA grants, in both 2009-10 and 2010-11, varies from 35% in Jalpaiguri to 82% in Medak. It is 76% in Nalanda, and barely 18% in Purnea, despite both districts being in the same state, Bihar. Now let’s look within a particular district, say Udaipur. The percentage of schools receiving the SSA grants ranges from 44% in Lasadiya block to 92% in Bhinder block.

For the last couple of months, we have been trying to find which factors are responsible for variations in fund flows at the school level using multiple regression analysis. The paper would be out soon (hopefully!), but here is a glimpse of what we have found.

We have looked at the following dependent variables:

a)      Whether a school has received grants in 2010-11?

b)      When did the school receive the grant (i.e. timing of grant receipt)?

c)      What was the gap (in number of days) between receipt and spending?

These three variables capture most of the dimensions of fund flow at the school level.

What did we find?

Performance in Previous Year

The single most critical determinant of grant receipt in a school is its performance in the previous year. The schools which received grants last year are 34% more likely to get the grants this year. Grant utilization also matters- the schools which utilized their grants in the previous year are 8% more likely to receive grants this year. This makes sense. As per the financial norms, all schools are expected to submit Utilization Certificates (UCs), essentially a proof of expenditure, at the beginning of the new financial year. The grant release is not explicitly conditional on the submission of UCs. Yet, the district and block officials do believe that the grants should be released to schools only after the schools show 100% expenditure through the UC submission. And that is exactly what seems to be happening.

Bank-related Factors

Potentially, the type of bank where a school has opened a bank account (nationalized, grameen or co-operative), distance of bank from the school and frequency of visits to the bank would matter for fund flow at school level.

Nationalized banks have core banking facilities which allows them to transfer funds electronically and thereby, in a much shorter time. Co-operative banks, on the other hand, still follow the system of transfer of funds through cheques. Consistent with this, we find that schools which have their SSA accounts in nationalized banks receive their grants almost 4 weeks earlier compared to the schools which have accounts in co-operative banks. No wonder that the MHRD has recently come up with an order asking the schools to open their accounts in nationalized banks. But opening an account is just the first step. Take Sagar for example, where all schools have accounts with the State Bank of India (SBI). There is wide variation in terms of the timings of grant receipt at school level. One major reason, we found, was that there were mistakes in collating bank account numbers, and as a result, the grants could not be transferred. Though it sounds funny, it has actually delayed receipt of grants at school level.

We also find that the distance from bank-branch to the school and frequency of HM visits to the bank don’t really matter.

Ironically, we also find that schools with accounts in nationalized banks start spending their grants 4 weeks later than the schools with accounts in co-operative banks. What might be reason for this? We hypothesize that since schools with nationalized banks receive their funds relatively earlier, they have more time to make plans, which could result in these delays.

School Characteristics

We find a strong positive correlation between school infrastructure and grant receipts. We also find that schools with higher teacher attendance have a higher probability of grant receipt. Perhaps this is because schools with better infrastructure or higher teacher attendance are better governed. But infrastructural facilities or teacher presence have no correlation with timing of grant receipts. Student attendance is not correlated with any of the dependent variables.

The headmaster (HM) of a school is also its administrator. He is the secretary of the school management committee (SMC), and along with the SMC president, manages the bank account. Given the importance of this position, it is not surprising to find that the schools with an HM or a Prabhari are 8% more likely to report receipt of grants. These schools also report receiving grants 2-4 weeks earlier than the schools that do not have a HM or a Prabhari.

Administration

Given the proximity of the cluster and the block officials to schools, as well as their role in education system, one would expect that the number of visits by these officials to schools would have an effect on fund flow at school level. Our regression analysis shows that higher number of CRC visits increases the probability of grant receipt by 2.4% points, while BRC visits do not matter. Further, BRC and CRC visits do not have much correlation with the timing of grant receipts and lag between receipt and spending.

******

I have highlighted only the main points. The work is still in progress. Keep a tab on our website for the entire paper.

Money Laundering and the effectiveness of Anti Corruption Agencies- Part 1

I recently read Jeffrey Robinson’s book “The Laundrymen”, an expose on the diversification of money laundering in the United States. This blog post, inspired by the book, collates my ideas on illicit money-flows –a theme I have been exploring since my previous blog post titled “White paper on black money

What intrigued me most in this book was the fact that numerous agencies exist to combat this menace. Bringing this closer to home, developments in the Indian institutional framework to counter these flows present an interesting angle.

As you may already know, suspicious money trails, hoarding, and hidden agendas have defined the larger character of money laundering. In India, perceptions around money laundering are deeply (but not only) connected with ‘Hawala’ transactions. ‘Hawala’ is mainly associated with an alternate remittances system which ‘exists and operates outside of, or parallel to ‘traditional’ banking or financial channels’.[1] It is a fast transfer process which does not usually have a traceable paper trail- making it cumbersome for agencies to uncover., Robinson states that:

“Money laundering is called what it is because it perfectly describes what takes place – illegal, or dirty, money is put through a cycle of transactions, or washed, so that it comes out the other end as legal, or clean money. In other words, the source of illegally obtained funds is obscured through a succession of transfers and deals in order that those same funds can eventually be made to appear as legitimate income.”[2]

Adding to the problem of tracking these illicit flows is the endemic nature of corruption and the continuation of systemic failures within the Indian governance system. India, having recently become a member of the Financial Action Task Force (FATF) to combat money laundering and terror financing, is taking a keen interest in international as well as national level agency creation to support anti-laundering efforts.

When it comes to estimating the illicit money laundering money flows, there are various views and methods of calculations.  In 2010, US-based Global Financial Integrity estimated that $462 billion went out of India between 1948 and 2008. Earlier this year, the CBI Director stated that Indians have ‘nearly Rs 24.5 lakh crore ($500 Billion) of illegal money stashed away in tax havens’[3][4] while another report claims that in 2009 $1500 billion was laundered by Indians (view report here). One of the key challenges while estimating the flow of illicit money is to effectively and promptly monitor transactions and thus, it is difficult to assess the accuracy of methods to calculate unaccounted money.

To combat money-laundering, India has come out with the Money Laundering Act (Amendment Bill) 2011, an amalgamation of various International Conventions that India has ratified (namely, UN’s Political Declaration and Global Programme of Action, Financial Action Task Force, Asia/Pacific Group on Money Laundering).  It seeks to ‘enlarge the definition of the offence of money laundering to include therein activities like concealment, acquisition, possession, and use of proceeds of crime’ and also ‘link the provisions of Indian law with the laws of foreign countries and provide for transfer of the proceeds’. Banks have to record any transactions that are above 10 Lakhs and maintain these records for 10 years.[5]

The government has also formed several institutions to strengthen efforts against money laundering and other economic offenses. The table below lists a few of these bodies (you can click on the organization to be directed to their website), when they were formed, who they report to and what they aim to accomplish:

Body Formed Reports to Aim
Enforcement Directorate  2000   Ministry of Finance
  • Enforcement of  the Foreign Exchange Management Act 1999 (FEMA) and the Prevention of Money Laundering Act 2002 (PMLA) 
  • Render cooperation to foreign countries in matters relating to money laundering 
  • Constituted special Courts under PMLA for trials of an offence 
Financial Intelligence Unit 2004 Economic Intelligence Council, Department of Revenue, Ministry of Finance
  • Independent national agency responsible analyzing and disseminating information relating to suspect financial transactions 
  • coordinating and strengthening efforts of national and international intelligence, investigation and enforcement agencies in pursuing the global efforts against money laundering and related crimes 
Central Economic Intelligence Bureau 1985 Department of Revenue, Ministry of Finance
  • Nodal agency for economic intelligence mandated to ensure effective interaction and coordination against economic offences. 
Economic Intelligence Council 1990 Central Economic Intelligence Bureau, Chairperson is the Finance Minister 
  • Coordinates at the central level the exchange of information and intelligence relating to economic offences including drug trafficking, smuggling, foreign exchange violations, supply of counterfeit currency, hawala transactions, financial frauds in stock markets, money laundering, tax evasion
  • advises the Finance Minister and the Union Council of Ministers on laws regulating the financial sector and fighting economic crimes


Serious Frauds Investigation Office   Ministry of Corporate Affairs 
  • detecting and prosecuting or recommending for prosecution white-collar crimes/frauds 
  • The Companies Bill, 2011, will also give SFIO statutory recognition , as well as powers of arrest, raid and seizure, which are necessary to make the investigating agency more competent 
Central Bureau of Investigation- Economic Offences Wing 1994 Special Police Establishment
  • Central authority to investigate cases  in jurisdictions within the Union Territories only
  • investigate not only cases of bribery and corruption, but also violation of Central fiscal laws, major frauds relating to Government of India departments, public joint stock companies, passport frauds, crimes on the high seas, crimes on the Airlines and serious crimes committed by organised gangs and professional criminals


With the establishment of several agencies as well as the introduction of a new foreign assets disclosure law (see here), the government does seem to be making some strides in the right direction- but how effective are these Anti-Corruption Agencies?

1. How independent is each agency in evaluating and assessing its cases?

2. Is the jurisdiction of a particular case already pre-decided? How many agencies does it really take to solve a case?

3. What is the judiciary’s role prior to and after the case is taken?

4. Is a single agency system the answer? Do too many agencies ruin the final assessment?

Without assessing these initial directions of thought, the road to tackling corruption will be a Sisyphean task.  As I delve more into this topic, I hope to uncover a few answers (if not all).

Watch this space for Part 2!


[1] Interpol. ‘Hawala alternative remittance system and its role in money laundering. https://www.interpol.int/Public/FinancialCrime/MoneyLaundering/hawala/default.asp

[2] Robinson, Jeffery. “The Laundrymen: Inside Money Laundering, the World’s Third-Largest Business,” pg 4. Arcade Publishing, New York, 1996.

[3]Economic Times. http://articles.economictimes.indiatimes.com/2012-05-23/news/31827627_1_black-money-black-economy-nipfp

[4] Times of India.Black money Indians have stashed. http://timesofindia.indiatimes.com/india/Black-money-Indians-have-stashed-over-500bn-in-banks-abroad-says-CBI/articleshow/11871624.cms. Feb 12, 2012

[5] White Paper on Black Money. http://pib.nic.in/archieve/others/2012/may/d2012052101.pdf. May 2012,

Improving quality education through community participation

Ministries of education worldwide have promoted community engagement in education with the goal of ultimately improving learning. One  vehicle for such engagement has been school committees, generally including a combination of parents, teachers, school officials and community members.  But how successful have these school committees been in improving the quality of education in schools? How best should the engagement of committees with the schools be fashioned to ensure better quality? Does giving grants work better than training committee members or are we barking up the wrong tree by focussing on these interventions? Is there something else that works better?

A paper titled “Improving Educational Quality through Enhancing Community Participation: Results from a Randomized Field Experiment in Indonesia” attempts to answer these questions. Four different interventions at improving community participation have been evaluated in this paper. Two of them focus on institutional reforms – First, with the goal of increasing school committee legitimacy, some schools implemented elections of school committee members. Second, in order to strengthen links with external stakeholders, facilitators supported a planning process between school committees and democratically-elected village councils (called linkage). The other two focussed on grants and training.

What do you think the results are? Which worked better? We won’t play a guessing game, but encourage you to read the paper.

Solutions to the Problem

As some of you may recall, the PAISA team spent the better part of last year collecting and analyzing data on fund flows in elementary education finances in the 9 PAISA districts. This effort culminated in the production of the PAISA district studies. The study highlights two major anomalies in the current financial system for education. One, and this is no surprise to anyone familiar with the nuts and bolts of India’s administration, fund flows and planning systems are riddled with process related bottlenecks. As a consequence, even basic things like pushing money through the system takes significantly longer than it ought to. Funds are transferred toward the end of the financial year and spent in a tearing hurry. The second finding points to a larger structural problem in the planning and budgeting system for elementary education. Our findings highlight that the current system is extremely centralized (a trend that is likely to get further entrenched as more and more money for elementary education gets routed through the Sarva Shiksha Abhiyan).  So deep is the tendency to centralize that even school grants, that are meant to be discretionary grants spent on needs identified by school headmasters, are in fact spent based on formal and informal instructions provided by the district administration.

While we can argue the merits and demerits of centralization the fact is that such a centralized system cannot deliver on the Right to Education Act’s (RTE) mandate to build a decentralized bottom up system for elementary education financing. For the un-initiated, sections 21 (1), 21(2), and 22 of the RTE mandate that all government and government aided schools set up School Management Committees (SMCs)’ that are tasked with monitoring the day to day functioning of the school and making annual school development plans.

Echoing this mandate in the implementation guidelines for Sarva Shiksha Abhiyan (SSA), the GOI clearly states that effective implementation of the RTE  requires “… need for creation of capacity within the education system and the school for addressing the diversified learning needs of different groups of children who are now in the schooling system…..planning and implementation for universal access in the rights based approach would require an understanding of community needs and circumstances as well as decentralized decision making for meeting the diversified needs of children[1].”

While the PAISA studies have identified the problem, the one question we are regularly confronted with when we share our findings is about solutions.  How do we build a bottom up financing system that is accountable; that has the capability to plan (we are a nation driven by technocrats and we believe strongly that only ‘technical experts’ know how to plan) and (for the converted – who think decentralization is a good thing) how should we align finances to enable decentralization?

I’ve been thinking about these questions, and went back to fiscal decentralization theories that I studied in graduate school for answers. Here are some of my thoughts on the financial design question. Since this is a work in progress, I hope that this blog will generate some debate amongst readers that will enable us to come up with more nuanced solutions to the problem.

First principles of decentralization argue that a well-designed decentralized system is premised on the alignment of “three Fs”: funds, functions and functionaries. In essence, this means that every level of government must have a clearly delegated set of responsibilities or functions. This process of delegation must be based on the principle of subsidiarity which holds that “functions shall be carried out closest to citizens” at the smallest unit of governance possible and delegated upwards only when the local unit cannot perform the task. Second, funds must follow functions. However, these funds must be devolved in a manner that allows enough flexibility to local bodies to align expenditures to expressed needs and preferences. Third, functionaries must be accountable to the body responsible for delivering that function. Since PAISA in its current avatar is primarily focused on the issue of financial management, my focus on solutions in this blog is primarily concerned with the issue of designing an effective fiscal devolution system or the funds aspect of the 3 Fs.  First principles of fiscal decentralization mandate that funds ought to be devolved in such a manner that the relevant unit of government has flexibility and autonomy over expenditure decision making. Moreover, fund flows must be transparent. Transparency is essential because it can ensure that all levels of government understand their financial entitlements and therefore safeguard against funds being re-appropriated by higher levels of government. Second, transparency can ensure effective monitoring both by higher levels of government and more importantly, by citizens.

If applied to elementary education, implementing these principles would require the following reform solutions (note: my focus here is on the last level of government – the SMCs in this case. The reason is that greater decentralization at the last mile is the hardest and the most hotly contested issue in this country. Thus if we can get this right, building a financial system that facilitates decentralization at the last mile will follow naturally).

4.1 Providing untied block grants to School Management Committees: As revealed by the PAISA 2011 study, the current system of financial transfers to schools is based on specific guidelines that curb flexibility at the school level. The first reform needed is to redesign the transfer system away from this line-item based devolution to an untied block grant system. The district could identify broad areas of expenditure (eg. infrastructure, maintenance) but schools must have the flexibility to spend on activities prioritized by them. Interestingly, the need for freeing school grants from the current norm based approach has been well recognized[2]

4.2 Simplify the transfer system and distribute grants to schools on a per-child basis: Rather than transfer funds on complex criterion such as number of rooms in a school or teachers appointed, finances to schools should be devolved on a per-child enrolled basis. A per-child basis for devolution would both ensure simplicity in the transfer system and thereby facilitate greater transparency. Moreover, it would ensure a greater correspondence with school needs than the current system enables. Finally, a simplified transaction system will also smoothen process related inefficiencies that are often the cause of delays in fund flows.

4.3. Building a real-time management information system that tracks expenditures: A real time management information system (MIS) is critical to enabling transparency. Such a system could be modeled on the current MIS for the Mahatma Gandhi National Rural Employment Guarantee Act (MGNREGA) that enables detailed fund tracking all the way to the Gram Panchayat. Transparency will ensure both that district and local bodies have access to data on timing of fund flows (thereby enhancing predictability) and will also enable higher authorities to track the flow of funds regular to identify and unlock process bottlenecks in real time. This can go a long way in ensuring predictability in fund flows.  Crucially, this MIS system must be made publically accessible. This will ensure that citizens and SMCs are informed of financial processes and can go a long way in enhancing transparency and accountability.

4.4 Predictability in fund flows: Apart from measures already described, predictability in grant flows can be enhanced by building in a reward and sanction based incentive structure for fund transfers at the State and district level. This could include penalizing sub-national governments that delay fund transfers by requiring them to pay schools an interest on delays.

4.5 Capacity building for planning: The problem of weak capacity is one of the most frequently offered arguments against greater financial and functional devolution to local governments and SMCs. There is little argument that in their current form, SMCs have almost no planning skill and capacity. In fact many studies on village education committees (the pre-RTE avatar of SMCs) point out that most often members are not even aware of their membership in these bodies. However, this is a chicken and egg argument. Capacity cannot be built in a vacuum. In fact, the absence of finances and powers there are no incentives for SMC members to participate in meetings and make plans. After all, why participate and plan if there is no authority to ensure implementation? Arguably therefore, effective decentralization is the first step to capacity building. However, this does need to be accompanied by a concerted effort by higher levels of government to train and mobilize SMCs and perhaps most important facilitate them in making plans. Consequent to the RTE every district now has a large financial allocation for community training and mobilization. However, this line item is given very low priority and for the most part goes unspent. Placing a greater emphasis and priority on spending these funds and organizing well designed training for SMCs will be an important first step in addressing this capacity deficit.


[1] SSA framework  2010-11

[2] Joint Review Mission, MHRD (2011)

Empowering School Management Committees- Helping SMC members plan better

Laina Emmanuel, Accountability Initiative

Parental involvement in children’s education is largely believed to lead to improved learning outcomes. The level of involvement can vary from providing a secure home for children, maintaining a healthy parent-teacher communication, volunteering to involving parents in the governance of the school[1]. The effect of each type of parental involvement on learning outcomes also varies, though research largely points towards beneficial effects.

Recognizing this, the architects of the Right to Education (RTE) Act mandated parental involvement in schools through School-Based Management Committees. These committees are tasked with making School Development Plans[2] among other tasks[3]. But how successful are school committees in discharging this responsibility? Our field research has helped us see the ground realities of School Management Committees (SMCs). Take for example, these quotes from the stories our PAISA associates sent us from the field[4] which show the information and capacity problems SMC’s face.

–     “We found that the SMC members were not even aware that they are members” –Swapna Ramtake, Sagar, Madhya Pradesh

–          “SMC members don’t make the connection between their attending meetings and the quality of outcomes in the school” – Poonam Choudhary, Jaipur, Rajasthan

–          “We met the lady who was made the SMC head by the headmaster, and she was never told what her roles and responsibilities are” – Seema Muskan, Nalanda Bihar

In addition to these information and capacity problems, there is another problem which Avani had briefly mentioned in her previous blog i.e. the lack of management skills in an SMC member or the lack of planning tools to help them plan better. To quote her – “Until we are able to staff and strengthen our management structures at every level of government – national, state, block, cluster and SMC – timely and efficient implementation of the programme will remain a challenge”

Before we look for solutions to these management challenges, it would help our reader to have in mind the picture of an SMC member from the PAISA districts work inworking in. An average SMC member is a person who can ill-afford to give up his/her daily wage to sit around in a meeting in which his/her doesn’t see value, is usually illiterate but clearly sees the value of education in improving his/her child’s future, he/she does not feel they can hold a government school teacher accountable as he/she thinks government school education is a free service and charity.[5] Also, apart from the charity aspect, parents who are uneducated find it very difficult to question an educated Headmaster and so are unable to pressurize the HM to correct things, or take steps for grievance redressal if it involves interacting with govt officials.

Coming back to the problem of lack of management skills, how do you ensure an average SMC member can actually plan for their schools? What tools, methodologies, skills can we impart to them to ensure that their plans are comprehensive and reflect the ground-realities of their schools?

Whatever be our solution, they should be simple enough so as to ensure parents (or SMC facilitators) spend minimum amount of time learning the solution. Complicated decision matrices and 2by2’s are not going to cut it. So what do we do?

Our next PAISA course module focusses on collectively finding a solution. Our 9 PAISA associates are traveling from various parts of the country to Delhi to attend a 5 day tool-creation workshop. Each of them is carrying with them a treasure-house of field experience. Collectively with the analyst team based in Delhi, we are going to spend 5 intense days, figuring out how we can best help SMC’s plan better.  Joining us in the brainstorming and creative processes, are 3 master trainers for ASER from Chattisgarh,  who would be later working on building SMC capacity. We would also be joined over Skype by grassroot planners from Kutch who have worked extensively on school-related issues such as bringing out-of-school children to school and monitoring school programmes. We would hopefully be joined by SMC members themselves from Kutch. And through this collective brainstorming, we hope to come up with solutions and tools which can help SMC’s plan better for their school.

After creating these tools, our PAISA associates would pilot them in their districts, and hopefully we would be able to answer questions about what kind of community involvement in school governance can help improve learning outcomes. We are very excited about this project, and will keep you informed.


[1] Epstein’s framework for six types of involvement talks about the various levels of involvement.

[2] Under Section 22(1) of the RTE, schools are required to prepare a School development plan. The school development plans contain the list of prioritized activities to be undertaken at the school level. It’s a three year plan estimating student strength, teacher requirement under the prescribed PTR, additional infrastructural, financial requirements and so on.

[3] The RTE guideline mentions specific functions to be performed by the SMC like (i) monitor school activities and its working, (ii) prepare and recommend school development plan, (iii) monitor grant utilization, (iv) monitor teachers’ and students’ attendance, (v) monitor MDM, (vi) ensure 100% enrollment of children in the age group of 6-14 year

[4] The PAISA associates send us detailed stories from the field. We would be later compiling them into a ‘Handbook for conducting PAISA’

[5] See Rukmini’s article – http://www.accountabilityindia.in/accountabilityblog/2224-hamara-gaon-hamara-school-my-village-my-school

Mis-Management or Missing Management

Avani Kapur, Accountability Initiative

Over the last few years, India’s elementary education landscape has witnessed a lot of change. On the one hand, there has been a substantial increase in financial allocations. For instance, allocations for Sarva Shiksha Abhiyan (SSA) – the programmatic vehicle for elementary education have increased from Rs. 15,000 crores in 2010-11 to Rs. 25,555 crores in 2012-13. This represents an increase of 70 percent in 3 years. At the same time, with the passing of the Right to Free and Compulsory Education Act (RTE) in April 2010, states now have an increased responsibility towards the beneficiaries. Central and state governments can now be held accountable for failure of delivery.

So more resources and increased responsibility are being pushed into the system. But then the question arises – Is the architecture of elementary education equipped to handle it? Fundamentally, do we have the capacity and manpower to handle these changes?

So lets try and understand this with the help of a few examples….

1) Constraints at the Block Level

The Block is an essential component of the SSA structure for day-to-day support to teachers. The SSA organisational structures requires a Block Education Officer, responsible for supervision and monitoring of schools. In addition, the block has a Block Resource Coordinator (BRC), responsible for providing curricular support to teachers such as developing teaching learning materials. The BRCs are also expected to conduct workshops with subject teachers of upper primary classes and organise trainings.

However, a look at the number of vacancies across different states indicates a huge human resource deficit at the block level. As the table below indicates, at the end of 2011-12, there was a shortage of 60 BRC’s in Chhattisgarh, 192 in Haryana, 205 in Himachal Pradesh, 322 in Bihar and 353 in Maharashtra!

Interviews with officials in Medak district, also confirmed that 60 percent of posts for Mandal Education Officers (equivalent to BEO’s) are currently vacant.

Table 1

State Post Sanctioned Post vacant
Maharashtra 407 353
Bihar 537 322
Himachal Pradesh 301 205
Haryana 299 192
Uttar Pradesh 880 136
Madhya Pradesh 322 82
West Bengal 696 75
Rajasthan 244 69
Jharkhand 237 61
Chhattisgarh 150 60


 2) Missing Junior Engineers: Example from Satara

The Junior Engineers (JE) are essential for the planning, designing and monitoring of all civil works – the second largest component of the SSA budget after teacher salaries. The roles and responsibilities of the JE include:

  • Cross checking the school civil work requirements.
  • Estimating the cost of the work on the basis of design specifications.
  • Giving directions to the SMC on the layout and the work-estimates
  • Monitoring the progress of the work
  • Scrutinising the works to assess whether it meets the standards given the in the Public Works Department schedule of rates for building works
  • And finally, assessing the work completion and expenditure and providing the completion certificate.

It is thus safe to say, the JE is one of the key implementing officers for any civil works project in schools. However, while analysing data for our district studies, we found that while the infrastructure budget for Satara, Maharashtra had increased by 61.6% between 2009-10 and 2010-11, the pace of activities at the school level was much slower. For example, allocations for boundary walls saw a massive jump from 0.88 lakhs to 210.9 lakhs, yet only 6.8 percent of schools had started construction. Similarly, only 15.2% schools had started toilet construction, despite an increase in allocations from Rs. 3.5 lakhs to Rs. 17.7 lakhs.

Interviews with officials solved part of the mystery – we found that more than half of required posts for JE’s were vacant in 2010-11. In fact, no infrastructure works could be carried out in one block as there were no JE’s in position. Satara is finally undergoing a huge recruitment drive to ensure this doesn’t happen this year.

A similar reason namely, “inadequate supervision staff” was cited in the Project Approval Board Meeting minutes as one of the main reasons for slow completion of civil works in Bihar.

3) School Management Committee Accountants – Example from Himachal Pradesh

The School Management Committee are an integral part of school functioning and decentralized decision making.  According to the RTE, SMCs are mandated to monitor school functioning and develop annual school development plans (SDP). In addition, one of the most important tasks of the SMC’s is the management of finances. All monies related to basic school functioning (school grants) as well as infrastructure monies are transferred directly into SMC bank accounts at the school level. The SMC’s are thus responsible for maintaining passbooks and cashbooks and deciding and incurring expenditures at the school level.

Himachal Pradesh was a step ahead of most other states in that they were able to constitute their SMC’s by April 2010 (just after the passing of the Act). Moreover, in order to assist in the management of funds at the school level, Himachal Pradesh decided to appoint 1 accountant for 50 SMCs at the block level. However, one year after the implementation of the RTE, of the 303 accountants required, only 63 posts were filled by April 2011, leaving 240 posts vacant!! In addition, in Himachal Pradesh in 2011, the posts of a Finance controller at the state level and of 2 Finance and Accounts officers at the district level were also vacant.

Interestingly, while the budgets for SSA have increased substantially, the share of allocations for management (Block Resource Centres, Cluster Resource Centres, Management and MIS) have actually decreased. In 2009, allocations for management constituted 8 percent of the total SSA allocations. However, in 2011, this dropped to 7 percent. Moreover, even in terms of expenditure, in 2010, only 71 percent of management funds were spent, down from 78 percent in 2009-10.

These statistics clearly point to a great management challenge in SSA. Until we are able to staff and strengthen our management structures at every level of government – national, state, block, cluster and SMC – timely and efficient implementation of the programme will remain a challenge. One positive step has been the recognition of this constraint by the SSA Framework 2011. In fact, the framework stated “the project management structure and requirement of manpower, delegation and capacity building would have to be reviewed in light of the larger fund availability and considerable expansion of the activities of SSA in  view  of  the  RTE Act.” Now it’s time to move from theory to practice.

The Politics of Money: A look into the Finance Ministry’s crusade against Black Money

Aishwarya Panicker, Accountability Initiative

The recently released ‘White Paper on Black Money’ by the Ministry of Finance was presented at the Lok Sabha on the 21st of May 2012.  Having taken some time to read through the rather lengthy document, it seemed fitting for a few words to be written about the report.

The report seeks to address the scale at which unaccounted wealth exists at present and the response of the Government to curb governance and accountability failures (the full report can be found here). It begins with an emphasis on clarifying concepts, followed by a detailed historical perspective on illicit money flows in the last few decades, and also touches on the subject of institutional strength and transparency to restrict illegitimate economic activity. 

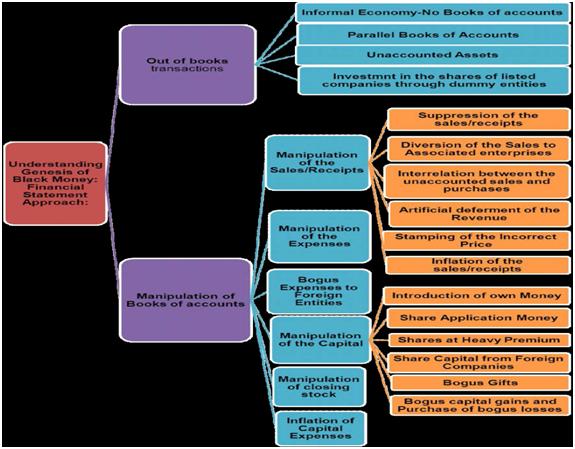
The report looks at black money as ‘wealth earned through illegal means as well as legal income that are concealed from public authorities’[1]. An interesting point made was the level at which manipulation of financial records take place and the procedures involved in misrepresenting particular amounts of money. Here is a snapshot of the various points at which transactions are manipulated and tax is evaded:


Source: White Paper on Black Money (2012)

According to the Global Financial Integrity Report, 2011, the illicit flows out of India have gone up to $104 Billion[2]. The report takes this into account and stresses on a few particular sectors of the economy that are vulnerable to misappropriation of funds- real estate, jewellery, public procurement, non-profit, transfer pricing, tax havens, informal sector and financial markets. While taking a look into the details of each sector, it is apparent that the reader of the report may have gained more insight if more information could have been given on the impact of black money flows in each sector and the subsequent influence on the Indian economy, the extent to which organized crime has penetrated the sectors, any active cases that may be going on as well as the government’s point of view on the growing complex organized crime networks that are now present at the national and international level in these sectors.

The report goes on to elaborate on the several proactive steps taken in terms of the legislative framework. A paradigm shift has been triggered with the onset of the various Bills such as Finance Act (2011), Income Tax Act and Finance Bill (2012- includes the General Anti Avoidance Rules, see details here), Prevention of Money Laundering (Amendment) Act 2011, Benami Transaction (Prohibition) Bill 2011, Public Procurement Bill 2012, Prevention of Bribery of Foreign Public Officials Bill 2011 and the Lokpal and Lokayukta Bill 2011. With India dropping 11 places to the 95th position globally in Transparency International’s Corruption Index (2011), dialogue on the implementation and future of these Bills in tackling the twin problems of deep rooted corruption and inefficiencies in the governance system is vital.

The involvement of high level officials, politicians, & well known business-houses in various large-scale scams present a serious concern when studying problems of low monitoring of institutions, rent-seeking, bribe taking and embezzlement of funds (an interesting outlook on the legal and illegal facets of corruption in the recent issue of EPW can be found here).  The relationship between the private and public sector is important to note here. Reports from academia, policy institutions and news reports have uncovered the blatant usage of power for personal gain and the magnitude of distortions that occur at the government-business level. This dialogue has not only displayed the levels of dependency of businesses on government (and vice versa) but also revealed a routinization of this dependency across time. The report realises the negative effects of entities arising out of state-business links and comments on the need for corporate structuring:

Corporate structuring is a legitimate means of bringing together factors of production in a way that will facilitate business and enterprise and help the economy. However, an artificial personality can also be created of a corporate entity to conceal the real beneficiaries. Opaque structuring through creation of multiple entities that own each other and the secrecy granted by certain jurisdictions facilitate such misuse” 

To rectify this gap (between illegal activities and the role of the governance institutions in catching the culprits), the report strongly recommends:

a) Methods to bring back the money 

1. A highly critiqued suggestion by the government was the bringing in of the Voluntary Disclosure Schemes for Tax Recovery, wherein ‘partial benefits in the form of immunity from prosecution will be made available in lieu of voluntary disclosure’[3] of assets.

2. Multilateral Convention on Mutual Administrative Assistance in Tax Matters– India ratified this convention early this year.  It is primarily for assistance in tax collection from countries who are part of this convention.

3. Stolen Assets Recovery (StAR) : India is collaborating with the World Bank Group and the UNODC ( United Nations Office on Drugs and Crime) to end the existence of safe havens for corrupt funds.

b)Creation of effective systems within the governance structure

Besides giving the establishment of a Lokpal a big thumbs up, it also suggests the formulation of:

1. A Directorate of Criminal Investigation: To be set up within the Department of Revenue for the investigation, review of complains and prosecution of those implicated in illegal activities under direct tax laws.

2. Setting up fast-track courts: These will ensure that cases are tried in a time-bound manner.

3. Income Tax Overseas Units: To aid authorities across foreign shores in collecting taxes and keep a check on foreign investors investing in India.

4. Committee on Black Money: This was formed in May of 2011. It is currently being headed by the Chairman of the Central Board of Direct Taxes (more details here) and primarily suggests policy recommendations.

5. National Tax Tribunal: To be set up in immediate effect to deal with tax litigation cases.

6. Economic Offenses Court: Recommended for the High Courts to set up an exclusive court to deal with tax cases.

Some points to ponder about:

1. The report does not source any primary government studies on the subject. What are the quantifiable government’s records on black money? Why have they not been considered at all? The lack of details is my primary criticism of this report.

2. The report in the beginning states that there is a ‘Need for more research’. Why is there no emphasis on the government’s initiatives in this regard? Is there no ongoing research being conducted if it is truly seen to be a problem facing the nation?

2. What is the feasibility of the government in conducting a program in which providing incentives to those who voluntarily disclose their assets is the main objective (after already stashing their assets on foreign shores)?

4. There is an emerging need for national governments to work closely and comprehensively with banks and intelligence bodies overlooking tax haven locales-

The political dimension of money is definitely not a subtle one. It is evident from the report that the problem of black money and corruption requires an approach that is wide-ranging. This ‘White Paper’, with all the criticism’s it has received, is still a step in the right direction towards tackling the numerous problems associated with black money. It will be interesting to see to what extent the recommendations will be implemented and which ones succeed.


[1] White Paper on Black Money. http://pib.nic.in/archieve/others/2012/may/d2012052101.pdf. May 2012, Page 2

[2]  It was mentioned, however, that these estimates were mostly an underestimate. White Paper on Black Money. http://pib.nic.in/archieve/others/2012/may/d2012052101.pdf. May 2012,

[3] White Paper on Black Money. http://pib.nic.in/archieve/others/2012/may/d2012052101.pdf. May 2012. Page 67

The Case of the Exploding Centrally Sponsored Schemes (CSS)

In last week’s blog on the Rangarajan Committee Report, Anirvan outlined the process of fund flows in Centrally Sponsored Schemes (for more details see here). Piqued and interested in exploring the topic of Centrally Sponsored Schemes, I decided to do some digging of my own. In the process of my investigation, I came across an interesting report recently published by a committee appointed by the Planning Commission on ‘Restructuring of Centrally Sponsored Schemes’ (details of the report can be found here).

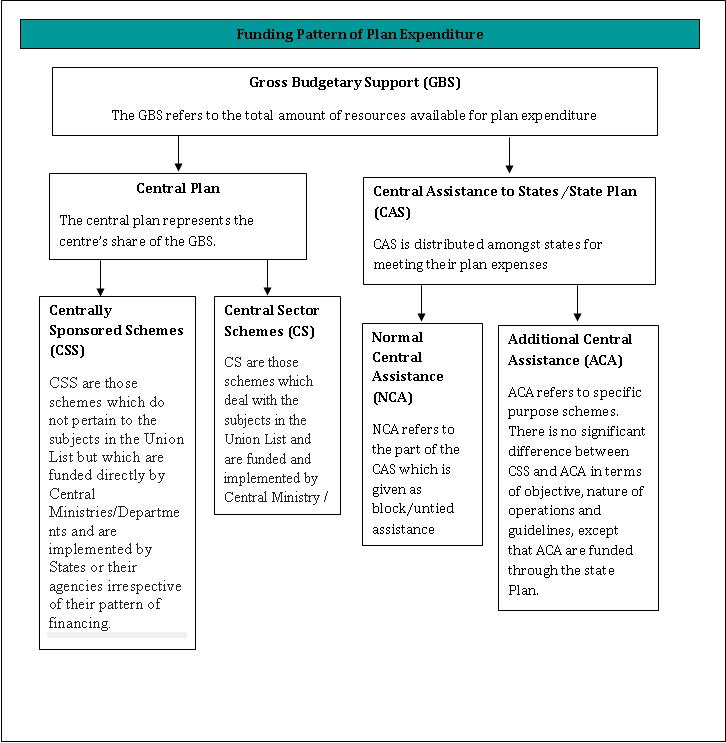
Before launching into the findings of the Report it is important to first gain some clarity on the definition and objectives of CSS. CSSs refer to specific purpose schemes which are funded by the central government and implemented by states or other local agencies (See Flow Chart for details). These schemes were originally instituted to redress development concerns of national importance. For this purpose through the conduit of CSS, schematic support is provided by the central government for subjects that constitutionally fall within the domain of states.

Despite the initial intention to limit the number of CSS to matters of national policy, the Report finds a proliferation CSS across successive plan periods (1997-2012). While the total numbers of schemes have declined from the 9th Five Year Plan (FYP) when there were a total of 360 CSS, to 147 during the 11th FYP, the share of CSS in the total plan expenditure (Gross Budgetary Support) has been steadily increasing. At the end of 11th FYP, the percentage share of the CSS in the total GBS was 42%, an increase of 11 percentage point from its share at the end of the 9th FYP (See table 1 for details).  A significant proportion of the allocations for CSS are accounted for by the central governments 9 Flagship schemes which alone constituted 79.4% of the total CSS provision  (For more details on allocation and expenditure trends of flag ship schemes see here).

Plan GBS (Cr.) No. of Schemes CSS (Rs. Cr.) % of CSS to GBS Central assistance of

States and UTs (Rs. Cr.)

Central assistance to

states as a % of GBS 

9th plan 316286 360 99001.68 31.3 138394 43.75
11th plan 1588273.24 147 660506 41.59 397418.93 25.02


Given these trends, the Report makes a mention of several important recommendations for restructuring of CSS. The following are a list of some of major proposals made by the Report;Apart from CSS, plan expenditure at the state level is also funded through the state level plans which are funded by Central Assistance to States (CAS) grant. CAS refers to the share of the State in the total GBS. CAS is essentially the budget that is distributed amongst the states for meeting their Plan expenses. In its findings the Report notes that the proliferation of CSS, has been associated with a decreasing share of the Central Assistance to States in the GBS. The share of CAS as a percentage of GBS has decreased from 43.7% (9th FYP) to 25% at during the 11th FYP. The decreasing share of the CAS represents a point of concern given that it represents a departure from the 1960s understanding regarding the division of the GBS. As per this understanding the share of the Central Plan and the State was required to be in ratio of 60:40.  The Report however notes that not only is share of the central assistance to states decreasing; the share of Normal Assistance to States (NCA) has also reduced during successive plan periods. From a state’s perspective this is worrying primarily because the NCA constitutes that part of the state plan which is given in the form of block/ untied grant. The NCA, thereby represents the funds available to states for making plans according to their own needs. The share of NCA was originally determined in the 1969 National Development Council, when it was decided that the centre could provide schematic support (CSS) so long as such support does not exceed 1/6th of the amount to be given for block assistance (NCA). Despite such stipulations, the NCA to states during the 11th FYP was Rs 1,07,101 Crore which represented 16%  of the total CSS funds (Rs. 6,60, 506 Crore).

1)     Restructuring of CSS into three categories; 1) Flagship schemes which will address major national interventions required for education, health, irrigation, urban development, infrastructure, employment and other identified sectors. 2) Major sub sector schemes to address development problems of sub sectors of major sectors such as agriculture, education and 3) Sector umbrella schemes which will address sectoral gaps to help improve effectiveness of plan expenditures. Based on these criteria the report proposed that the total number of schemes can be reduced to 59.

2)     To ensure that there is no proliferation of CSS, the report recommends that all new schemes must fall into the above three categories with new interventions being confined to Flagship schemes only.  Other new schemes should become part of sub sector schemes or umbrella schemes.

3)     The NCA to states should not be reduced to below 10% of GBS to enable states to have adequate flexible untied funds for their plan.

The extent to which these recommendations will be followed remains to be seen. It is however important to note that with the publishing of the Report of Restructuring of CSS and the Rangarajan Committee Report, it is increasingly recognized that the proliferation of CSS is a concern which needs to be addressed.  While this is an important recommendation, the larger issue of how CSSs have structured accountability relations between the centre and the state, is a consideration that has been largely left out of the discussion. Given that the defense for schematic transfers has in part been based on ensuring the accountability of public expenditure, framing the discourse around such concerns is perhaps an important starting point for a revaluation of the role and growth of centrally sponsored schemes.

What Does ‘Quality Education Study’ Show?

Recently, I attended the release of an interesting report, ‘Quality Education Study’, put together by Educational Initiatives and Wipro-Applying Thoughts to Schools. The study tries to assess learning levels of students in Standards 4, 6 and 8 by developing specific tests for English, Maths, Science and Social Studies. As mentioned in the report, ‘the questions were not based simply on the ability to recall information or use formulae or procedures…but also attempted to evaluate if the students have understood and internalized the concepts(1).  Some questions were also included to study student attitudes toward gender equality, diversity and sensitivity toward others, civic/ citizenship issues, ecological issues, values and interpersonal skills. 

The study was carried out in 89 ‘top’ English medium schools, out of which 83 schools were included on the basis of a public opinion survey and 6 schools were included, based on expert recommendation for their different learning environments(2). The study could have benefitted from including more of later type of schools, which would have allowed comparison between regular schools and schools with different learning environments. Along with the tests, the study also involved focus group discussions with students and teachers, and principal interviews, in a sub-sample of 16 schools. The objective was to get a sense of classroom climate, teaching practices, role of principal and teachers, their beliefs about teaching etc.

Interestingly, the study intended to cover 255 schools but only 89 agreed to conduct these tests. It is plausible that such external tests would disturb the school’s routine. Even then, reluctance on the part of so many schools is noteworthy.
I will concentrate on two findings reported in the study, which, in my opinion, are extremely important.
First- learning levels were found to be significantly lower than what was observed in a 2006 study conducted in the same schools and using some of the same questions(3). Out of 54 common questions, performance was found to be lower on 48 questions.

This indicates that decline in learning levels may not be restricted to only government schools. It seems that even the ‘top’ schools are experiencing the same problem. It’s just that nobody knew about it till now. Reasons for such a drop are not clear. These schools operate in a fairly competitive ‘education’ market- parents have some ability to take their kids to a different school and new schools are opening all the time. It is not implausible to assume that fees have increased to keep pace with increased costs and schools are not fiscally stretched. Teachers seem to be qualified and classes are fairly homogenous – most of the students belong to fairly affluent and educated families. A drop in learning levels, hence, becomes even more difficult to understand. Some teachers at the launch were of the opinion that this may be due to the new policy of ‘no retention’ and ‘no board exams’. This definitely needs to be probed further. On this note, check out this news item http://timesofindia.indiatimes.com/city/mumbai/RTE-fallout-After-blind-promotions-mass-failures/articleshow/13041159.cms

Second- Students from these schools performed lower than the international average in all 3 subjects tested – English, Maths and Science, at class 4 level, and in all the questions included from the international tests. However, at class 8 level, students performed on par with their average international counterparts. But this was due to better performance on questions which were procedural in nature(4).

This finding becomes even more critical since these schools are ‘top’ schools and hence their learning levels represent, in some way, an ‘upper bound’ of sorts of learning levels in India. What are the reasons for such a gap in learning levels? Inferior teacher quality? Faulty method of teaching or testing children? Outdated or irrelevant curriculum? This needs a serious investigation.

According to Prof. Krishna Kumar, former Director of NCERT and a noted educationist, who was also present at the launch, this might be due to the fact that Indian students are not being taught in their mother tongue, and hence they are not able to grasp concepts easily, especially at the lower grades. As they grow, they overcome this barrier to an extent and manage to do well in procedural questions, but can’t match international average on conceptual questions.
This sounds quite plausible. Unfortunately, nobody in India wants to even talk about the issue of language of instruction. The attitude is as if the issue has already been settled. Everybody has accepted that English medium is the way to go, and that’s a real tragedy.  Unfortunately, the sample did not have ‘top’ schools offering education in a local language, which would have shed at least some light on this issue. The possibility of children of different background attending ‘top’ English medium schools and ‘top’ vernacular schools and other differences would make drawing any conclusions difficult but it’s an area which should be examined with more rigor and open mind.

**
The report gives some background information on schools. It shows that the schools are fairly large with 84% of the schools having more than 1000 kids enrolled. The average class size is between 40-50 students. Only 9% of schools had less than 30 students per class. 56% schools had more than 40 students per class or per teacher. Thus more than half of the schools will have to reduce their class size or recruit more teachers to comply with the RTE requirements.
Further, a larger class size might have adverse effect on learning levels. It would also be interesting to see if the class size differs at class 4, 6 and 8 and if it has any correlation with learning levels.
**
The report opens up quite a few new research questions and is definitely worth reading.

1. Please see the report for list of specific competencies tested in each paper.

2. Please see the report for details.

3. EI and Wipro had carried out another study in 2006. Some schools and questions are common to that study and the current QES study.

4.  The tests had two types of questions- questions that checked for deeper understanding of concepts, and questions that checked for learning that is ‘text-bookish’ or ‘straightforward’.