The story behind PAISA: Notes from the Field

During the course of the PAISA survey our field level researchers gained some interesting insights regarding the ground level implementation of SSA. Their findings, trace different elements of the implementation story and include an analysis of the pattern of SSA fund flows, the status of school outputs and the level of SMC functioning.  Here are some highlights from the field.

The curious case of missing uniforms

In this story Venugopal Kalokota, PAISA Associate, Andhra Pradesh, narrates a perplexing tale of the pattern of fund flows in Andhra Pradesh. In tracing the story, he demonstrates how confusion within the administration created delays in the provision of uniforms- a fundamental right of children under RTE.

Following the passage of the Right to Education 2010, the State Implementing Society (SIS)  for Sarva Shiska Abhiyan, took a decision to provide two sets of uniforms to every student enrolled in a government elementary school.  Funds for the uniforms were to be transferred to schools, who in turn where given the responsibility for purchasing uniforms at the local level. Consequently funds were transferred into school accounts in FY 2011(at a unit cost of Rs. 200 per uniform).

During the course of the PAISA survey, while scrutinizing the school passbooks, we found that although schools had received the uniform grant, none had spent it and in fact the funds had been re-appropriated back in to the district account. This seemed decidedly odd. On probing we learnt that later that year contrary instructions had been issued by the SIS to retrieve the grant amount transferred to schools!  This was because the SIS, upon transferring money to schools, changed its mind and decided instead to procure uniforms centrally. To do this, the SIS office entered in to a contract with the Andhra Pradesh State Handloom Weavers Cooperative Society (APSHWCS). As a consequence of this administrative confusion, funds, once they reached the schools were ‘re-transferred’ to the state. The ultimate price however was borne by the students who did not receive their uniforms on time.

Status of School Outputs

One of the principal rights guaranteed under the Right to Education (RTE) is basic school level infrastructure. For Poonam Choudhary, PAISA Associate, Rajasthan it is the limitations in the provision of this right that have struck her the most. Based on her field level experience she paints a vivid picture of the status of infrastructure facilities and reflects on the question of who is responsible for the status of such facilities.

I have only ever known a school with all the necessary infrastructure facilities: boundary walls, playground, drinking water facilities, toilets and sufficient classrooms. During the course of the PAISA pilot survey, I found myself questioning this perspective.  While conducting the pilot exercise in Chaksu Block I came across two schools whose story left a deep impression on me. In both schools the status of infrastructure facilities was extremely poor. One school was located on the main road but didn’t have a boundary wall. According to teachers the absence of such facilities made it extremely difficult to secure the school premises and equipment. In fact there have been occasions where the school building was used as a casino by local men who gambled there. One morning teachers and students arrived at  school to find it strewn with liquor bottles and cigarette butts. Another time, a dead body was kept in the building due to lack of space. The school building it seems was the only building large enough to store the body!

The second school was located literally in the backyard of a house. The school lacked all the basic facilities. An asbestos shed served as a makeshift classroom. The only piece of furniture that the school had was a table for the head master. All school related material was kept in the granary. Piles of teaching-learning equipment and student registers were stacked near bags of wheat. There were no toilet facilities and the only drinking water facility was a hand pump that belonged to the family in whose house the school was located. Despite several applications sent by one of the only two teachers who taught in the school, the administration had not done anything to relocate the school and provide it with the necessary infrastructure facilities.

The combination of these two experiences raised questions in my mind. It provoked me to question whether it really made a difference that students were not getting what they should from our government. If yes, then who is accountable?  In my view policy makers, government officials, teachers, students and the community are all accountable.

Teacher Absenteeism and Community Action

This story by Dinesh Kumar, PAISA Associate, Bihar documents the problems associated with the practice of officially sanctioned teacher absenteeism. Dinesh’s story also highlights the importance of community mobilization and the critical role that an active citizenry can play in demanding accountability from government officials.

My story relates to the school management committee of a government girls’ upper primary school, Karzahar village in Rohtas district, Bihar. This incident took place during the State assembly elections. Teachers were placed on election duty and as a consequence, schools across the state were operating below their full strength. In Karzahar village, out of the six teachers appointed, four were sent on election duty. As a result, children were attending school only to  record their attendance!  Concerned with the low level of teacher attendance, the Village Education Committee (VEC)(or School Management Committee as they are now referred to) complained to the Block Education Office (BEO) and filed an application requesting them to close the school for the period of the elections, since there were no teachers, what was the point of sending children to school – part from keeping attendance numbers high? The complaint lodged by the VEC, however, was summarily ignored and the school continued to operate.

I was made aware of this problem during an interview with the chairman of a VEC. The chairman explained that despite several attempts, the BEO had rejected their requests. The problem, it was later discovered, was that the BEO lacked the authority to respond to their requests, as it was the Block Development Officer who was responsible for assigning teachers on election duty.

Confronted with the problem, I decided, as a first step, to call for a meeting of the VEC. At this meeting it was decided that until such time that teachers did not return from election duty, all the literate members of the village would contribute their time and teach in schools. In addition we decided to explore alternate means to pressurize the local administration.

Following the meeting, a rally was launched at the Block Office. During the rally, the participants, particularly the children cornered the Block Education Officer and refused to let him leave until he promised to meet their demands. Hearing the ruckus, the Block Development Officer came out of his office only to be surrounded by the students who refused to listen to his platitudes. In the end, faced with enormous amount of pressure from the students and the community, the BDO finally relented and agreed to call back all the teachers who had been sent for election duty. The highlight of this story was that one of most active students in the protest was also the BDO’s daughter.

Lessons from a Participatory Planning Exercise

In her story of Sehore, Swapna Ramtake, PAISA Associate, Madhya Pradesh, highlights some of the most important lessons relating to the capacity of School Management Committees to plan and spend their resources. In her final analysis, she emphasizes the importance of both community participation and administrative support as critical elements for strengthening school level planning.

This story is about a school in Palaspani village, Narsulganj block in Sehore district where we conducted some preliminary work on strengthening the capacity of school based committees to make plans for meeting their needs.

When we first visited the village we did not have an inkling of the task that was before us. We were under the impression that once members of the school based committee (Village Education Committee) were identified, it would be a relatively simple affair to conduct a participatory planning exercise for the development of a school plan. How naive we were. In truth the greatest challenge was to motivate members of the community on the importance of education and their involvement in ensuring its delivery. Located in one of the poorest areas of the state of MP, the village suffered from a variety of problems associated with scarcity of drinking water, lack of Anganwadi Centre’s and absence of employment.

Faced with this situation, we decided to change our strategy by first helping the community to address some of these more urgent problems. Our first step was to file applications with the block administration demanding the provision of these basic services. To our surprise and relief, the demands were addressed; a new Anganwadi centre was established, water problems were resolved and new works were opened up under Mahatma Gandhi National Rural Employment Guarantee Act (MGNREGA).

These efforts won us the support of the community who were now convinced of our intentions and were willing to work with us on developing a plan for addressing school needs. Adequate infrastructure facilities was the first need identified by parent. The teaching area in the school consisted of two classrooms and a veranda. The state of the classroom was especially deplorable, as the floors were riddled with potholes. The school also lacked basic drinking water facilities.

To address these problems members of the Village Education Committee (VEC) developed a Plan for repairing the classroom floors and constructing drinking water facilities. To fund both activities it was decided that funds from the previous year’s school maintenance grant, which had not been used, would be combined with this year’s grant. Both activities were slotted to start in September, which was also the period just after the rains when it would be possible to construct water harvesting facilities as well as initiate repair work of classrooms. To complete these activities the community members volunteered to donate their labour.

Thus all plans were made to start work in September. However, there were delays in the transfer of grants and by September the school had yet to receive their funds. When the block level officials were asked about the delay in the transfer of funds, they replied that funds would be transferred soon. The transfers, however, did not take place till January and the Plan which had been made with so much effort was never implemented.

Through this exercise we learnt a number of lessons. The most important however was the lesson that school level planning is a complex process, which involves both the participation and the support of the community and the administration. Thus in mobilizing the community it is important to keep the institutional environment in mind and to ensure that funds arrive on time.

Strengthening School Management Committees

Picking up on Swapna’s analysis is Ram Ratan Jat, PAISA associate, Udaipur District draws a roadmap for strengthening SMC participation.

In the course of my work with the PAISA project I have found that School Management Commitees (SMC) have only been  formed on paper. The level of interest taken both by the administration and the community continues to be low. The problem is rooted in the way the administration and the community view the role of the SMC. Administrative officials and Head Masters treat the SMC as a body that they are forced to engage with under the Right To Education (RTE). They do not understand the value of the SMC.  Community members, as well, do not consider it important to forgo their earnings and other household responsibilities for participating in SMC meetings.

In this scenario, it is very important to explain to community members and officials the purpose, and importance of participating in and engaging with SMCs. In doing so, one of the most important responsibilities to emphasize is the role of the SMC in managing and monitoring school finances and expenses. It is necessary to highlight that the money that reaches schools is essentially public money. Every person in one way or another pays taxes to the government which is collected and used to fund various government programmes including education.

In my opinion then, it is important to ensure that the community and the school level administration work together to strengthen the role of the SMC. This can be done by;
1) Involving the SMC and the school administration in making of the school plan,
2) Encouraging the SMC to monitor children’s learning levels
3) Emphasizing the role of the SMC in monitoring teacher’s attendance.

1. Authors are PAISA Associates, Accountability Initiative, CPR

FAQs on Fund Transfer (Part I) – The Treasury Mode

The Report of the High-Level Expert Committee on Efficient Management of Public Expenditure chaired by Dr. C. Rangarajan (and better known as the Rangarajan Committee Report) was tabled in Parliament in July 2011 and I had been waiting for it to be publicly available since then. The Report finally found its way to the internet (this is the link). To those concerned about the “High Level” and “Expert” adjectives, the Report does not disappoint. I had earlier blogged on why the committee was mulling over merging plan and non-plan expenditure. This time I summarise the Rangarajan Committee’s take on fund flows in centrally sponsored schemes (CSS).

As you would be aware, CSSs are specific transfers from the central government (GOI) to the state government and are meant to help the latter “to plan and implement programmes that help attain national goals and objectives”1. A case in point is the Sarva Shiksha Abhiyan whose aim is to achieve universal enrolment in elementary education. Other examples include the goal of livelihood security through the National Rural Employment Guarantee Scheme and of rural housing through the Indira Awaas Yojana. While the GOI is responsible for formulation and (to a considerable extent) financing, state governments are in charge of implementation. Many schemes also require a financial contribution from the state (eg. SSA funding is split between GOI and states in a 60:40 ratio).

CSSs can be classified in 2 types – Treasury mode or Society mode depending on the fund flow mechanism. In this blog, I will describe the Treasury mode of fund transfer, institutional measures to keep track fund flows and finally, issues with the transfer system.

What does the fund flow mechanism look like in the Treasury mode?

The treasury mode gets its name from the fact that funds to implementing agencies are are routed through respective state budgets, or the state treasuries. An example of such a CSS is the ICDS. Fund flow occurs as follows:

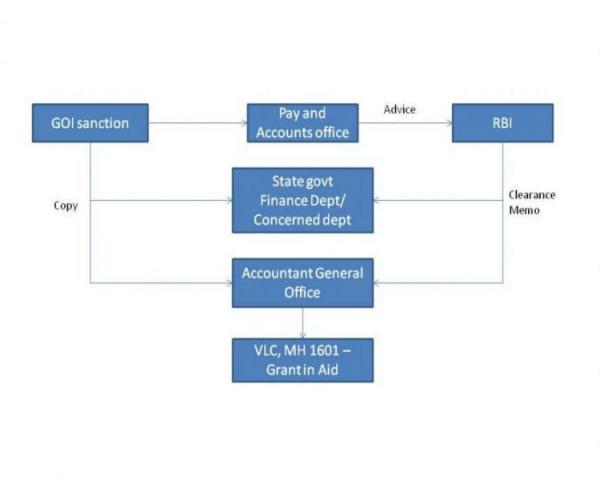
  1. The approved amount is first sanctioned by the concerned administrative ministry (for instance, the Ministry of Human Resource Development in the case of education, or the Ministry of Health and Family Welfare in the case of health) or the central government’s Ministry of Finance.

  2. A sanction letter is issued by the GOI and copies are sent to the State government and state Accountant General (AG).

  3. The Pay and Account office of the GOI then issues an advice letter to the RBI asking it to transfer funds to the State government’s treasury.

  4. RBI completes the transfer and confirms this by issuing a clearance memo to the State Government and the AG.

  5. The state finance department now approves the budgetary allocation and sanctions the withdrawal of funds.

  6. Finally, the concerned department/agency withdraws funds

The flow chart below summarises the process described above. The last box is simply an example of a voucher (more on vouchers in the next section).

How are funds tracked? Is there a monitoring mechanism?

Funds are tracked through a system of vouchers. Expenditures are routed through the treasury and vouchers have to be submitted to the AG for all expenditures incurred. Since computerisation of account compilation, funds can be tracked till the state government spends through state departments or transfers the fund to the Implementing Agencies (usually local bodies) for various schemes.

Interestingly, the AG’s office captures funds transferred to local bodies by the state treasury at the time of release and books it as expenditure. However the treasury system does not capture actual expenditure by local bodies.

Hence, in a nutshell there is a fairly effective monitoring system but it does not track expenditure at the last mile.

What are the pros and cons of the Treasury mode of fund transfer?

Pros

  1. The system can track expenditure to the object level (the economic type of expenditure – details here) as vouchers for each transaction are available with the treasury or the AG.

  2. Expenditure is compiled by the Auditor General, and is audited by the Comptroller and Auditor General’s office.

  3. There is a well-defined system of cash management and bank reconciliation which provides information on cash flows at any point of time. Hence the system is amenable to monitoring and review at all stages barring the last.

Cons

  1. Releases are booked as expenditure in central and state government accounts – GOI accounts treat transfer to states as Grants-in-Aid and book them as final expenditure. Similarly, releases by States to IAs are treated as final expenditure in State accounts. Since actual expenditure cannot be tracked, one does not have complete information on end use of funds in real time.

  2. Money not released by the government (GOI or state) by the end of the financial year gets lapsed, i.e., does not get carried over to the next year. This often results in GOI and states pushing funds out without looking at actual utilisation.

  3. The exact dates of interim stages like administrative or financial sanction in the state Government that often involve concurrence of the Finance Department are almost impossible to obtain.

  4. Statements don’t match! Department accounts and expenditure statements provided to GOI by states are often not reconciled with accounting records of the AG, sometimes for years. This raises concerns about the accuracy of data and thereby of actual expenditure reported.

This just about sums it up for the Treasury mode. My next blog will be about the Society mode of transfer, which if possible, is way more complicated. Watch this space!

References

Report of the High-Level Expert Committee on Efficient Management of Public Expenditure, July 2011, Government of India, Planning Commission, New Delhi available here

Policy Note on Public Financial Management and Accountability in Centrally Sponsored Schemes (Draft), May 2005, The World Bank, India available here

1 Policy Note on Public Financial Management and Accountability in Centrally Sponsored Schemes (Draft), May 2005, The World Bank

Empowering schools and school management committees (SMCs): Unpacking decision-making in India’s schools.

Since the early 1990’s School Based Management (SBM) has gained increasing popularity as a strategy for improving responsiveness and accountability in the delivery of education services. As a form of decentralization, the SBM approach involves the transfer of decision making authority over school operations to local agents (2). One of the principle function’s which is delegated to local agents is the responsibility for managing the school’s finances. In several countries, including Brazil, Nepal, Mexico, and Czech Republic, authority is devolved to school based committees who are given varying levels of financial autonomy for 1) determining school needs, 2) preparing budgets and plans, and 3) procuring items and incurring expenditure for meeting such needs (3). 

In India as well, the involvement of community members in school functioning has been institutionalized under the Right to Education (RTE) (4) Act 2010 (5). Under the RTE, School Management Committee’s (SMCs) are required to be constituted in every government owned/run elementary school in the country. Consisting primarily of teachers, parents/guardians and members of the community, SMCs are empowered with the responsibility of monitoring school functioning and managing its finances.

In practice, SMCs have complete financial power over three annual grants (Teacher learning Material or TLM, School Development Grant or SDG, and School Maintenance Grant or SMG). These mount to approximately 6% of the Sarva Shiksha Abhiyan (SSA) budget (SSA is the programmatic vehicle for implementing RTE).  In addition, the SMCs have some powers over decision making on other monies that arrive in schools including infrastructure funds. To facilitate grant utilization, SMCs are expected to follow the norms laid down in SSA framework (6) and the procurement policies enshrined in the Revised Manual on Financial Management and Procurement for SSA (7). The combination of these two policies determines the extent of financial autonomy enjoyed by the SMCs especially with regard to their ability to meet school needs and requirements.

How do these norms play out in practice? To what extent do these norms enable SMCs to take decisions for schools? Drawing on the procurement policies for SMCs, this article attempts to answer these questions. To examine how SMCs work in practice, this article reports on findings of a micro study undertaken in Khaitrabad Mandal, Hyderabad in Andhra Pradesh.

Unpacking procurement policies

Central level Guidelines

Levels of Procurement: The Revised Manual on Financial Management and Procurement for SSA assigns the SMC responsibility for procuring items to meet the recurring needs of the school. This includes:

  • Procurement of goods for the up gradation, repair and maintenance of the school,
  • Utilization of the school grant, teaching learning equipment, KGBV and NPEGEL activities (8).

Procurement of other items which may be required by the school is assigned to the district level. This includes textbooks, learning enhancement aids, requirements for disabled children. The rationale is that many of these items can be purchased in bulk and thus ought to be procured centrally, by the district education administration.

Method of Procurement: According to the rules, items purchased at the school level are to be purchased on the basis of a limited tender system i.e. by comparing price quotations obtained from several suppliers, usually three to ensure competitive prices. Limited tender enquiries are issued to those firms which are on the list of approved contracts. For the construction of school based infrastructure the Manual makes it mandatory for procurement to be done with the participation of the community, usually through the SMC. The specific role for the SMC includes: a) carrying out the work directly and organizing labour and b) procuring material.

The procurement policies in the Manual are only indicative and subject to a) procurement policies of the State government or the Panchayati Raj Institutions for the procurement of civil works, goods and services under SSA, b) policies of the State Implementing Society (SIS) recommending the powers of procurement to districts and sub districts. Thus for defining the levels of procurement at the state level, the Manual suggests that States develop a Procurement Plan. The Procurement plan is to be made on an annual basis within one month of the approval of the Annual Work Plan (9).

State level Guidelines

AP Procurement Plan: The Procurement Plan for 2010-11 (10) defines the method of procurement, the quantity of items to be procured and their estimated cost. In addition, the procurement plan specifies the month by which procurement processes ought to be completed.

The Plan, however, does not provide a clear understanding of the role of the SMC in procurement. This is primarily for two reasons; 1) while the Plan defines the method of procurement it does not specify the level at which procurement is required to be undertaken, 2) the Plan provides details based on item wise procurement and not on basis of grant amounts, as is done in other states. For instance, the Rajasthan plan assigns specific responsibility to the SMC for procuring items under the three annual grants (11).

The section on infrastructure (civil works) provides some guidelines for SMCs. Accordingly, the SMC is required to follow a method of procurement which includes; 1) preparation of specifications and bid documents, 2) issue of invitation for bids, 2) evaluation of bids, 4) reward of contract to the bidder with the lowest price. Once the contract is awarded, the Plan specifies a four month period during which works are required to be completed. For instance, for the construction of toilet facilities; contracts are required to be awarded by August and work is slotted for completion within a four month period (September to December).

Utilisation Guidelines

For the annual grants, item-wise utilization details have been issued by the SSA District Office (District Programme Officer). Details are as follows:


Table 1: Utilisation guidelines for annual grants
Teaching Learning Material School Development Grant School Maintenance Grant
50% of grant amount on
temporary material
Priority for internal wiring for
electrification
Minor repairs of floor, roof,
compound wall, gate furniture
50% of grant amount on
permanent material
50% purchase of library books Maintenance of toilet up to
a ceiling of  Rs 400
Xeroxing of question paper Schools which have electricity supply may use it for; payment of electricity bill, procurement of trays for preserving SLIM cards, stationary, procurement of radio, repair of radio, purchase of TV. Cost of electricity connection
and meter charges.

 De-facto Financial Autonomy

To understand how these guidelines structure the SMCs capacity to meet their needs, we conducted a series of interviews with Acting Head Masters (HMs) in Khairtabad Mandal, Hyderabad city, Andhra Pradesh. Our conversations with HMs revealed the following:

From the HMs point of view, the SMC has real decision making autonomy, at least when it comes to the schools grants. Of course, it is important to note that this only indicates that the HM is taking decisions – the extent to which these decisions involve other SMC members is unknown. According to the HMs School needs and requirements dictated the manner in which school grants were to be utilized and primacy is given to needs determined by the school in the event that they did not correspond with the utilization guidelines. For instance, the acting HM of Government Primary School (GPS) Hanuman Stone Cutter, explained that they utilized a part of the school development grant for funding the travel cost for a class trip.

Despite such autonomy, interviews revealed several factors which limit the capacity of the school’s to procure items on the basis of their needs. These can be divided into constraints experienced in meeting recurring needs and those relating to civil work requirement.

Recurring needs

Additional guidelines issued by the administration mandating all schools to purchase specific items, thereby limiting the SMCs capacity to plan its expenses. For instance, in FY 2009-10 all schools in AP were asked to purchase a radio from the School Development Grant for the Interactive Radio Instruction Programme (Learning Enhancement Programme).

Financial norms which limit the capacity of the school to incur expenditure exceeding a specific amount. The guidelines place financial ceilings on expenditure to be incurred under specific items such as maintenance of toilet facility and the procurement of library books.

Civil work based need

Inadequate authority: while the procurement guideline define the SMC as the authority responsible for procurement of civil works, in practice the final sanctioning rests with the office of the District Programme Officer, which takes decisions based on a number of factors; District Information System for Education (DISE) estimates and applications submitted by HMs.

Delays in processing of sanctions: Schools that filed applications reported considerable delays in receiving approvals. For instance, the acting HM of GPS Mahatmanagar stated that she had sent a request to the Deputy Inspection Officer (DIO) for the construction of classrooms in December. However, two months later in February (when interviews were conducted) she had not received any information on the status of this request.

Implementing responsibility rests with District: HMs reported that the construction of civil works in Hyderabad is usually undertaken through the district office, that awards contracts to the tenders. Thus while SMCs are required to be involved in the construction of civil works according to the procurement plan, their actual involvement appears to be fairly limited.

Thus in considering several aspects of the procurement policies, we find that while central norms assign broad powers to the SMC to procure items and incur expenditure, the AP procurement Plan and Guidelines seeks to define these powers in more specific ways. The practical effect of such policies is then that while SMCs may have some authority to procure items to meet their needs; they do not enjoy complete autonomy. This has implications not only on the extent to which SMCs can be responsive to school needs but also on their capacity to develop school plans for meeting their requirements in a timely and efficient manner.


1. Gayatri Sahgal is a Research Analyst with Accountability Initiative, CPR

2. Local agents include a combination of principals, parents, teachers, students and other community members

3. Bruns, B., Filmer, D., and Patrinos, H. (2011) ‘Making Schools Work: New Evidence on Accountability Reform’, HumanDevelopment Perspectives, World Bank, Washington

4. RTE is implemented through the programmatic of Sarva shiksha Abhiyan (SSA)

5. Right to Children to Free and Compulsory Education Act 2010. Available at: http://www.delta.org.in/form/rte.pdf

6. Revised SSA Framework (2011). Available at:

http://ssa.nic.in/ssa-framework/SSA%20Frame%20work%20(revised)%20%209-6-2011.pdf/view

7. For more details see:

http://ssa.nic.in/financial-management/manual-on-financial-management-and-procurement/manual-on-financial-management-and-procurement-unit

8. Manual on Financial Management and Procurement, (2010), SSA, pp. 83.

9. Annual Work Plan and Budget is the primary planning and budgetary document under SSA.

10. For details see: http://ssa.ap.nic.in/Proce_schedule2010-11/Procurement%20plan%202010-11.pdf

11. For more details see: http://rajssa.nic.in/Circular/17.pdf

Understanding Local Dynamics and Tracking Fraud/Corruption in NREGS: Notes from the 2nd field visit.

Continuing with our study on Social Audits in NREGS in Andhra Pradesh, I visited the Medak and Papannapet Mandals in March. The study aims to analyse the efficacy of the social audits as a platform to capture the universe of complaints and whether it leads to effective grievance redressal.  My part in the study is to understand the local dynamics in the selected GPs and to track corruption and fraud.

Based on the data from the Society Social Audits, Accountability and Transparency (SSAAT) website, we selected Medak and Papannpet Mandals as they were the front runners in terms of total misappropriated amount in Medak district.

Within each of the 2 Mandals, we choose 4 Gram Panchayats (GP) broadly based on the following two criteria

  • The various types of complaints and the sum of misappropriated amount across the Field Assistant (FA), Technical Assistant (TA), Additional Program Officer (APO) and Branch Post Master (BPM) cadres.
  • The % decrease/ increase in the misappropriated amount from Round 2 to Round 3 of social audits.

Based on the above criteria we selected the following GPs

Medak Mandal: Magta Bhoopathipur, Nagapur, Madulwai and Jakkannapet.

Papannapet Mandal: Cheekode, Arkela, Kurthiwada and Narsingi.

In my previous visit to Medak and Papannapet Mandals in February 2012, we conducted a survey in the 8 GPs to capture the impact of social audit. More information about my previous visit can be found here.

This time, we wanted to dive deeper into the local dynamics and corruption/ fraud in NREGS at a Gram Panchayat. Though we were not able to uncover the ‘insider’s details’ about corruption and fraud, we did uncover some interesting information during this field visit. Some snippets from the field visit are below.

Tractor trips:  In NREGS, small farmers, those who own 5 acres or less land, are eligible to receive black soil, free of cost under NREGS, to increase the fertility of the land. This is mainly targeted at the SC/ST communities to convert their infertile land for farming. The black soil is dug by the wage seekers at the work site and transported to the sanctioned farms. A tractor is assigned to each group of wage seekers for transportation.

Each trip should carry a load not more than 2.5 m3.  The payment for tractor trips is based on the distance between the work site and the farm as shown in the table below.

Km Radius Rate Per m3 Rate per 2.5 m3
1 58.5 146.25
2 68.25 170.62
3 78 195
4 87.75 219.37
5 104 260

So how are the funds misappropriated? The FA negotiates with the tractor owner about the per trip costs. By default, it is assumed that each trip would carry a ‘super load’, also known as ‘paper load’, (i.e, as much as they can) and for each trip, the payment is negotiated between Rs 80 to Rs 100, depending on the distance from the work site. Since there are many tractors and less demand, the tractor owners generally concede to the ‘revised’ prices set by the FA/TA.

Each group is assigned a tractor. The tractor driver is given a chit for each trip and at the end of the day the number of trips is noted down.  Within 15 days, the payment is made.  When the payment is made, either of the two scenarios takes place.

I.  Irrespective of the negotiated price and the number of trips made by the tractor driver, the proper payment, based on the 2.5 m3 per trip estimate, would be transferred to the bank account of the tractor owner. Out of this, the tractor owner would get his share, based on the agreed amount per trip, and the FA would take the remainder. This scenario would most likely occur only if the FA or TA knows the tractor owner well. If not, then most likely the second scenario would occur.

II.  The wages, based on the negotiated per trip price, would be transferred to the tractor owner’s bank account and the remainder to a ‘benami’ account. For example, let us assume that a tractor owner/driver ‘A’ has transported about 100 m3 of soil and that the agreed amount is about Rs 80 per trip. So if A transports ‘super load’ every time, then he/she transported the 100 m3 in 25 trips. So the agreed payment would be Rs 2,000 (25 trips @ Rs 80 per trip). However, the proper payment should have been Rs 5850 (40 trips @ Rs 146.25 per 2.5 m3 per trip). So the ‘balance’ Rs 3850 would be accounted under a ‘benami’ tractor owner and the money transferred to the ‘benami’ account.

After enquiring, we discovered that most tractor owners were not aware of the actual terms of payment. However, the few who did know the actual rates agreed to the terms set by the FA/TA since they had little bargaining power and if they refuse, the job would be given to others. Thinking about it now, I wonder why the tractor owners have not formed a union to overcome this.

When we asked the EGS staff about the irregularities in tractor payments, they obviously denied that such practice was going on. While they conceded that the tractor owners/driver’s carry ‘super load’, they claim that the owners/driver indulge in such practices to save fuel costs. At the end of the day, the tractor owners calculate the payment based on the quantity of soil they transported and not the number of trips.

The EGS staff also defended themselves by claiming that sometimes in the case of long distance trips, tractor owner/drivers dump the soil at nearby locations. These trips were not considered for payment. However, tractor owners/drivers later claimed at the social audit that they have not received complete wages.

To try and reduce corruption and procedural lapse in tractor trips, the AP government has mandated that tractors have to be ‘registered’ before they can be utilised in NREGS. To register their tractor, the owners have to submit the RC (registration certificate) book, a bank account number and driver’s license. If the name of the applicant matches the name on the RC and the account holder’s name, and if the road tax has been paid, then the system will process the application. Only then will the applicant be eligible to use his/her tractor in NREGS. The Additional Program Officer[i] (APO) of Papannapet Mandal told me that he received about 150 applications, in the past few months, out of which only 30 were successfully registered. Mostly, the reasons for such a low rate of registration were that the RC (of second or third hand tractors) did not match the name of the applicant or the account holder’s name. According to him, “when one buys a second hand tractor, they don’t get the RC updated. The seller just signs on a paper reflecting the sale of the tractor.”

It will be interesting to see how this change in the procedure will affect the playing field. Would this curb on the supply side (registered tractors) allow the tractor owners to demand full and proper payment? What about those who have not been able to ‘register’ their tractors; would they be willing to fulfill the requirements to get work in NREGS or would they pressurise the government to revert this procedure of ‘registration’?

Shelved work (sanctioned works that have not been started): While analyzing the secondary data from the NREGS website, we noticed that in both Medak and Papannapet mandals there were a lot of sanctioned works that have been shelved. For example, in 2010-11, in Medak Mandal, out of the 6502 sanctioned works, 5191 works have been shelved[ii].  One of the reasons for this was that in September 2010-11, the government started a new system of identifying works. They employed two 10th standard students from the SC/ST community to identify the non cultivable land in the SC/ST community. The idea was to convert this land to cultivable land. Many of the SC/ST people had small pieces of lands in different locations within the village. Each piece of land was sanctioned a Work ID (WID). Because of the small size of the land, each WID was not sufficient to generate work for a group. Hence, they did not initiate such small works.

Another reason for the works not being initiated was that in 2010, each group was associated with a WID before the work got initiated.  This was done after consulting the groups on the type of works they would like to work on. Based on this, the groups were tagged to each WID. But, when the works were initiated, some of the groups changed their mind. Since the groups were already tagged with a WID in the system, the system considered the groups to have completed the stipulated person days. So those groups that have ‘completed’ (virtually) 100 days of work were not allowed to work on another WID.

Realising the impracticality of these two procedures, the government has abandoned these procedures.

Vigilance Cell: In 2010, the Vigilance Cell was set up to follow up on the findings of the social audits. For more information about the vigilance cell, go to section 4.2 of our policy brief “A guide to conducting social audit”. Click here for the link to the document.

The Social audit findings and decisions are sent to the corresponding District Vigilance Officer (DVO) for follow-up action (recovery). The vigilance cell does not take up all the findings of the social audit. It only focuses on the financial irregularities and it does not concern itself with the procedural irregularities.  Once it has identified the financial irregularities, the DVO would send show cause notice to the accused and calls for a personal hearing. If the accused is able to produce written proof, showing that the finding(s) of the social audit is wrong then the charges are dropped. If not, then the accused is given 15 days to repay the misappropriated amount. If the accused is still working as an EGS staff then the amount is deducted from his/her monthly salary. If not, the money is recovered through the Revenue Recovery (RR) Act. A recovery order is sent to the Tehsildar[iii] and he/she’ll use appropriate means (like confiscating the property) to recover the amount.

The DVO of Medak district stated that after filtering through the findings of the social audit, the ‘determined’ misappropriated amount identified by the District Vigilance Cell is about 1.35 crores (out of the Rs 13.34 crores[iv]  identified by the social audit), out of which 40% has been recovered. According to the DVO, the use of technology like using mobile phones to upload muster details and using smart cards for payment of wages has reduced the scale of misappropriation in NREGS.


[i] Employment Guarantee Staff responsible for supervising the MGNREGS works at the Mandal level.

[ii] Data obtained from the AP NREGS web site – works menu: http://nrega.ap.gov.in/Nregs/FrontServlet?requestType=Common_Ajax_engRH&actionVal=Display&page=WorksMain_eng

[iii] Tehsildar is a revenue administrative officer in charge of obtaining taxation from a Mandal/Teshil.

[iv] Data obtained from the AP NREGS social audit website: http://117.240.247.24/ATR/reportshome.do.

As of 3/05/2012

Teacher Absence, The result of prioritising inputs over outcomes

Teacher absence in India’s government schools is a well documented problem. Since the late 1990s, a number of independent studies such as the Public Report on Basic Education (1999 and 2009) and  Kremer, Muralidharan et al’s 2004 World Bank report on teacher and health worker absence in developing countries have conducted surveys which assessed the degree of teacher absence in government schools. Reported absence rates range from between 14% in some states to up to 44% in others. Longer term and repeat studies such as ASER and PROBE Revisited have reported national absence rates to be fairly consistent since 2007 and between 1996 and 2006 respectively.

A range of studies have also sought to investigate the causes of teacher absence and what can be done to mitigate them considering its contribution to poor learning outcomes. A recent study by Accountability Initiative in two districts – Sagar (Madhya Pradesh) and Nalanda (Bihar) – sought to investigate the issue through a focus on the administration and its monitoring mechanisms. Our report is based on desk research, documents sourced directly from officials and interviews with just over 50 teachers, officials and independent agents throughout the elementary education system in both Sagar and Nalanda.

The study maps the current teacher recruitment and monitoring processes and identifies challenges faced by existing monitoring mechanisms in tackling and reducing rates of teacher absence. In this article, we discuss one of the biggest challenges – the difference in priority allocated to teacher absence by researchers and administrators due to the allowances available in the system for sanctioned absence.

Components of teacher absence

ASER 2011 suggests that rates of teacher absence in MP and Bihar are 17% and 15% respectively, figures supported by AI’s PAISA District Studies (2011) which found that in Sagar and Nalanda, absence rates are 19% and 22% respectively. However, when officials and teaching staff were asked to suggest what they perceived teacher absence to be and what their understanding of how much of a problem this is, the majority replied that rates were negligible and not in need of urgent attention. Those most critical of the system argued that absenteeism rates were no more than 10%.

This discrepancy between the results of independent studies and the reports and testimonies of officials is largely explained by the perceptions of officials about the different components of absence; leave, official non-teaching work, illness and non-attendance. Independent studies generally report absolute absence rates, irrespective of which component(s) may be responsible. They conduct surprise visits to schools and record the numbers of teachers physically present to the number of teachers officially enlisted at that school. In MP and Bihar, the administrations also record teacher absence but their figures tend to exclude any absence caused by sanctioned leave, non-teaching work or illness. Thus, they focus on the fourth component – teacher non-attendance.

An example:  Say in a school of five teachers, if two were on sanctioned leave due to official duties and one remained absent without prior permission, independent surveyors would prioritise and record teacher absence (60%) but officials would prioritise and record teacher absenteeism (20%), a component of teacher absence. In this way, independent studies prioritise the question of whether teachers are present to teach while the administration is more focussed on whether teachers are following the rules it has set governing their presence, a logic that may make sense from a bureaucratic perspective but ultimately does not maximize the use of the teaching resource. 

Sanctioned allowances for absence

The impact of this difference in prioritisation can be roughly quantified by looking more carefully at the administrative in the two districts.

Teachers in both states are broadly entitled to four types of leave during term time – earned leave, casual leave, leave on account of being delegated official duties and sick leave. Earned leave is leave teachers are legally entitled to take and is 10 days in MP and 11-14 days in Bihar. If this is not taken, it can be converted into cash at the time of retirement. Casual leave is more discretionary, intended for short periods of time. Teachers in MP are entitled to 13 days earned leave while Bihar’s teachers are entitled to 16 days of earned leave. There is no limit on leave for official, non-teaching duties as the amount granted is based on need.  Sick leave needs to be verified by a doctor’s note and the allowance (for certain pay conditions) is 20 days in MP and up to six months in Bihar.

This information can then be combined with the total number of days schools are open to devise baseline absence rates. Theoretically, RTE entitles pupils in primary and middle school to 200 and 220 days tuition respectively every year. A review of the Bihar government’s official 2012 calendar as well as its academic calendar reveals that this academic year, schools should be open for 244 days. If we account for the fact that schools invariably also have to close for unplanned reasons throughout the year, a safe estimate of the total number of school days is 220. In addition to the baseline rate, we can also consider rates in other scenarios which include leave due to personal reasons, non-teaching duties and illness. The figures used in these scenarios are based on feedback from teachers and officials; that i) teachers will take all their casual leave ii) teachers will try to minimize the amount of earned leave they take iii) most teachers are required for at least 8-10 days of non-teaching tasks per year and iv) some sickness leave is either unavoidable or fraudulently taken.

Table: Sanctioned teacher absence rate under different scenarios (as measured by independent surveyors)

Scenarios

[Teacher takes…]

Casual Leave Earned Leave Non-teaching Leave Sickness Leave Total Leave Absence Rate (total/220)
MP BASELINE. All CL / no EL / no non-teaching duties / no illness 13 0 0 0 13 6%
A. All CL / 33% of EL / no non-teaching duties / no illness  13 3 0 0 16 7%
B. All CL / 33% of EL / some non-teaching duties / no illness 13 3 10 0 26 12%
C. All CL /33% of EL / some non-teaching duties / some illness 13 3 10 10 36 16%
BIHAR BASELINE. All CL / no EL / no non-teaching duties / no illness 16 0 0 0 16 7%
A. All CL / 33% of EL / no non-teaching duties / no illness 16 4 0 0 20 9%
B. All CL / 33% of EL / some non-teaching duties / no illness 16 4 10 0 30 14%
C. All CL / 33% of EL / some non-teaching duties / some illness 16 4 10 10 40 18%


In both districts, the baseline scenario is where a teacher only takes the leave he/she is entitled to and incentivized to take. This results in minimum absence rates of 6% in MP and 7% in Bihar. Scenario A accounts for teachers taking 33% of their earned leave entitlement, resulting in absence rates of 7% in MP and 9% in Bihar. Scenario B includes 10 days of non-teaching duties, pushing the absence rates up to 12% in MP and 14% in Bihar[1]. Finally, scenario C includes a further  10 days of leave due to illness, pushing absence rates up even further to 16% and 18% in MP and Bihar respectively.  The important point to note here is that these levels of absence are sanctioned by the rules of the administration and do not account for cases of ‘absence without permission’ (or absenteeism).

Considering the lack of any system to provide replacement teachers on days when enlisted teachers are absent, this also illuminates the fact that the education systems is prepared to ask headmasters to adjust class sizes to compensate – a strategy guaranteed to inflate the pupil: teacher ratio on a given day to much beyond acceptable standards given that they are already high in both districts (in 2010 the pupil:teacher ratios were 1:62 in Nalanda an 1:44 in Sagar).

A final observation is that the degree of non-teaching tasks appears to vary significantly for different teachers. In Nalanda, around a quarter of the teachers interviewed were also appointed Booth Level Officers (BLO), responsible for executing a variety of activities related to polling, voter cards and other administrative tasks. In interview after interview, these teachers reported that they were required to attend weekly BLO meetings and had to dedicate one day a week to carry out their duties. According to the teachers, their meetings and other work often overlapped with school times. Thus, one crude estimate is that for 8 out of 22 teaching days in the month (36%), these teachers are absent from their schools. This statistic is particularly significant considering, for example, in Silao block, Nalanda district, 94 of its 418 teachers are BLOs meaning that in a given month, almost a quarter of the teachers in one block in Nalanda are absent from school 36% of the time before factoring in leave for either illness or personal reasons.

Going forward

Of the four components of absence – leave, non-teaching duties, illness and non-attendance – our findings reveal the extent of teacher absence that can be accounted for by looking carefully at the administration’s rules about the first three. Due to prevailing rules and practices, the administration in Sagar and Nalanda does not view teacher absence as a significant issue and, therefore, allocates less priority to addressing it.

The levels of casual, earned and sickness leave teachers are entitled to are the products of prior negotiations with powerful teaching unions. Any changes to these rules will require new negotiations with unions and a re-focusing of the administration to prioritise outcomes over bureaucracy. As for non-teaching duties of teachers, the RTE acknowledges their prevalence and clarifies the conditions under which they are permissible. However, as illustrated by the situation in Nalanda, the law is yet to be properly followed and enforced despite high levels of awareness amongst officials.

Re-visiting the rules and associated administrative policies will not be easy. It will require political will, supported by clear evidence of the cost of a system that denies pupils consistency in their teachers or class sizes and of the extent to which increasingly significant amounts of taxpayer’s money does not get utilized towards ensuring teachers are consistently doing what they have been hired to do – teach.


[1] Despite RTE limiting the non-teaching duties of teachers to the decennial census, disaster relief and elections, officials admitted that it was difficult to adhere to the rules because alternative resourcing arrangements had yet to be made.

Do Gram Panchayats get their money?

It was exactly nineteen years ago, on April 24, 1993, that the Constitution (73rd Amendment Act), 1992, came into force. Two decades have passed since then but efforts to devolve real powers to the Panchayati Raj Institutions (PRIs) have been limited. Various reports have indicated that fiscal devolution has lagged behind functional devolution, making the latter meaningless. Fiscal devolution is further hampered by severe delays and unpredictability in fund flows to PRIs, implying that PRIs do not receive their allocated budgetary provisions. Further, they have little autonomy over their finances as the bulk of the funds received are tied to clearly-specified expenditure guidelines. The inefficiencies are exacerbated by the lack of regular and reliable data on Panchayat finances. The 13th Finance Commission notes that data provided to the Commission from state governments was sparse and inconsistent with data furnished to previous Commissions.

In this context, our study, Do Gram Panchayats Get Their Money? PAISA Report, assumes considerable significance. The study asks, and attempts to answer, the following key questions:

  • Do Gram Panchayats (GPs) get their money? That is, do GPs receive funds allocated to them through various funding sources?
  • If so, do GPs get their entire entitlement?
  • When do GPs receive their funds? That is,  do funds arrive on time?
  • Do GPs spend their money?
  • If so, what do GPs spend their money on? And does this expenditure reflect local needs and priorities?


GPs are the last unit of governance in the PRI system. This is the point at which expenditures on the actual provision of services to citizens are incurred. Hence, we focus on GP-level fund flows and expenditures; more specifically, on untied funds, which constitute only around 10% of total GP allocations. Though small in size, untied funds are the only discretionary funds available to GPs.1 These funds can potentially be utilized to fulfil local needs and priorities as and when they are felt, thereby fulfilling the raison d’être of decentralization.

The analysis and results in this study are based on a random sample of 20 GPs in Birbhum district of West Bengal. These GPs received three types of untied funds: 12th Finance Commission (TFC) grants; 2nd State Finance Commission (2nd SFC) grants; and funds provided under the Backward Regions Grant Fund (BRGF) programme. We have tracked these funds over a five-year period, 2005-06 to 2009-10.

We find that the sample GPs received 70% of their untied fund entitlement: 55% of their 2nd SFC entitlement and 61% of their BRGF entitlement; TFC performed best with GPs receiving 94% of their entitlement. Further, there are year-to-year fluctuations in fund receipts. TFC and BRGF were slow starters, with GPs receiving less than their entitlement in initial years of the period under consideration. On the other hand, SFC performed better in 2005-06 and slipped in later years.

Apart from low receipts, fund flows are also characterized by delays and irregularities. The first TFC instalment was released in October 2005 – beginning of the third quarter of the financial year, creating a vicious cycle of delays for the entire fund cycle. The State, once it had received funds from the Centre, was quick to release the TFC funds to districts and, yet, GPs received their entitlements nearly four months from the date of release by the State. SFC had a good start, with GPs receiving both instalments for 2005-06 on time. But only five instalments were issued in the next four years, instead of the stipulated eight. On average, it took two months for funds to reach GPs from the State. There were significant delays in BRGF as well, starting from Government of India (GoI) and flowing all the way down the chain to GPs. Overall, it took anywhere between 2.5 to 6 months for funds to reach GPs from GoI.

On average, GPs reported spending 64% of their untied funds. However, there seems to be a preference for spending tied funds: 80% of tied funds were spent by GPs in the sample. In addition to yearly fluctuations, there is substantial variation across fund type and across GPs in the sample. On average, 69% of TFC funds, 73% of SFC funds and only 53% of BRGF funds were spent.

The untied funds are spent mostly on activities related to the provision of drinking water and roads. A common thread across all GP expenditures is a preference for infrastructure-related and guideline-driven expenditure, which is ironic considering that these funds are meant to be ‘untied’. This is partly due to periodic guidelines issued by GoI and the Government of West Bengal (GoWB), leaving GPs with little to choose from. It is also an indicator of the weak planning capacity of GPs, which prefer to spend as per the guidelines.

Our analysis also throws some light on the specific points in the system where inefficiencies exist. An important, yet often-ignored, fact highlighted in the study is that there are significant bottlenecks at the district level, affecting the ability of the district to disburse funds to GPs.2  In West Bengal, these bottlenecks are exacerbated by poor record keeping at all levels. Accessing basic documents, such as allotment and sanction letters, was a challenge, even at the state and the district levels. At the GP-level, entries in cashbooks and project registers were often incomplete. Introduction of the Gram Panchayat Management System (GPMS), a sophisticated accounting system, in 2007 has improved record-keeping post 2007-08. However, data generated through GPMS is not networked to higher levels in the system, thereby limiting its usefulness in improving the overall Panchayat finance system.

Interactions with officers across various levels of government highlighted a variety of factors for such a state of affairs. These include the following: low priority accorded to Panchayat finances; cumbersome procedures, including negotiating with different levels of government to access funds released, managing multiple bank accounts and reporting requirements at the district- and GP-level; complex conditionalities, including the submission of utilization certificates to access funds, and limited staff capacity.  Together, these factors contribute to process inefficiencies in Panchayat finances.

The study also highlights some key areas of reform that could help to strengthen the state of Panchayat finances in West Bengal. These include: improvements in record-keeping such that there is greater transparency, which in turn enables real-time tracking and monitoring of GP funds; simplifying transactions so that cumbersome procedures and other process-related delays can be curtailed; finally, transitioning to a ‘Just-in-Time’ fund flow system where GPs get funding based on their individual expenditure capacity, rather than on overall performance of a district. Such a system would help create positive incentives for improved planning and expenditures at the GP level.

What is the Per Child Expenditure in Government Schools?

Ambrish Dongre, Accountability Initiative

The Supreme Court, in its landmark judgment, upheld the constitutional validity of a controversial provision in the Right to Education (RTE) Act- reservation of at least 25% of admissions in  class I / the entry level, ‘for children belonging to weaker sections and disadvantaged groups in the neighborhood, and provide free and compulsory education…’

Now that the Court has delivered its judgment, focus should be on the implementation of this provision.

As per the RTE act, the private unaided schools ‘shall be reimbursed expenditure so incurred by it to the extent of per child expenditure incurred by the State, or the actual amount charged from the child, whichever is less’. So if the State spends Rs. 1500 per child and a private school spends Rs. 2000, such a school would be reimbursed Rs. 1500 per child admitted under the 25% reservation policy. But to implement this clause effectively, we need to know precisely how much both the State and private schools spend on a per child basis.

The Government of India (GoI) funds elementary education through the Sarva Shiksha Abhiyaan (SSA), the flagship scheme for universalizing elementary education in the country. SSA accounts for 67% of total elementary education budget of the GoI in FY 2012-12[1]. As per calculations of my colleague, Shailey, per child allocation at an all India level under SSA stood at Rs. 4,269 for financial year 2011-12. This number varies from state to state- Rs. 7037 for Chattisgarh, Rs. 3,049 for Gujarat, Rs. 27,451 for Meghalaya to give just a few examples[2]. But traditionally, elementary education in India has been primarily financed by the state governments. Our previous research shows that as per 2009-10 estimates, 74% of total education budget was financed by the state governments[3]. Hence one has to include their share to get a better sense of true allocation and spending on every child enrolled in government schools. Per Child Allocation after including the state budgets for seven ‘PAISA’ states is indicated in the following table.

State Per Child Allocation(Rs. 2009-10)
Andhra Pradesh 8,390
Bihar 4,705
Himachal Pradesh 19,111
Madhya Pradesh 4,423
Maharasthra 12,075
Rajasthan 9,192
West Bengal 3,982


It’s quite natural that per child allocation and expenditure will vary across the districts within a state. So it’s absolutely essential to calculate such allocation and expenditure at district level, so that these numbers could be used while deciding payment to the private schools. But calculating district level per child numbers is quite tricky. There are no district level budget documents. Hence my colleagues, Avani & Anirvan, with help from Prof. Anit Mukherjee (NIPFP), devised alternative ways of calculating these numbers for 9 districts in the 7 states mentioned above. Wherever the State treasuries have been computerized, such as Andhra Pradesh and Himachal Pradesh, data on treasury flow to bank accounts of the designated officers at the district level (Drawing and Disbursing Officers (DDOs) was collected to derive the exact allocations. In remaining 5 states, where the treasury account information could not be accessed, district budget was estimated on the basis of proportion of schools, teachers and students in a given district compared to a state[4].

District(State) Per Child Allocation(Rs. 2009-10)
Medak(Andhra Pradesh) 7,588
Nalanda(Bihar) 5,719
Purnea(Bihar) 4,841
Kangra(Himachal Pradesh) 19,574
Sagar(Madhya Pradesh) 3,616
Satara(Maharasthra) 14,766
Jaipur(Rajasthan) 8,289
Udaipur(Rajasthan) 9,426
Jalpaiguri(West Bengal) 4,935

The table clearly reveals that there is variation across districts in per child allocations even within a state. The difference is Rs. 1,137 in case of Jaipur and Udaipur, and Rs. 878 in case of Nalanda and Purnea in Bihar. Note that we have excluded allocations for implementing ‘Mid Day Meal’ scheme from these calculations. Once they are added, the numbers are bound to go up quite substantially.

These calculations must be done for every district in the country to get some sense about how much every district is allocating for every child enrolled in government school, and accordingly, payment to unaided private schools should be decided. In order to make sure that calculations are robust, all underlying data should be publicly available so that one can replicate these calculations.

So far we have been talking only about per child allocation, while the act talks about per child expenditure. When it comes to expenditure, there is an additional complication that audited expenditure data becomes available only after a lag of 2-3 years, and expenditure performance of governments fluctuates wildly from one year to another, which makes the task of estimating expenditure even more difficult.

There is even more ignorance when it comes to functioning of private schools and fees charged by them. In fact, what most do not know is that private schools in much of India spend far less than per child allocation in government schools.  A recent study by India Institute, based on a census of schools in Patna, shows that 69% of these private unaided schools charge less than Rs. 300 per month. This is far lower than per child allocation of Rs. 4,705 in Bihar[5]. But these fees are likely to change dramatically in the context of RTE norms regarding teacher wages and infrastructure which every school has to follow.

Given the potentially large transfer of public resources to private unaided schools in the next few years, public availability of information regarding the fees charged by private schools and the manner in which these are determined are essentital for ensuring scrutiny of public expenses.

It goes without saying that the education departments should display list of all private unaided schools admitting students under 25% reservation category along with the fees they charge, on their web-pages. Delhi government’s department of education has already taken the first step. Going further, schools should be required to submit a statement indicating their costs under different heads and fees charged, at least on annual basis, which again, should be displayed on the education department’s webpage. The government should come up with a standardized format for such a statement, which will facilitate scrutiny of expenditure undertaken by private schools and meaningful comparisons across private schools.

This shows that a lot more work needs to be done to ensure effective implementation of such a landmark judgment.


[1] Sarva Shiksha Abhiyan, GoI 2012-13Budget Briefs, Accountability Initiative

 [2] Do Schools Get Their Money (PAISA 2011), Accountability Initiative

[3] The sample consisted of 7 states of Andhra Pradesh, Bihar, Himachal Pradesh, Madhya Pradesh, Maharashtra, Rajasthan and West Bengal. (Analysis of State Budgets: Elementary Education, Avani Kapur (2011), Accountability Initiative.) 

[4] Details of methodology are given in ‘PAISA District Studies (Rural) 2011available on our webpage,  

[5]The Private School Revolution in Bihar: Findings from a Survey in Patna Urban, Baladevan Rangaraju, James Tooley & Pauline Dixon, India Institute, 2012

PAISA 2011 Highlights

Background

The PAISA survey is conducted annually through the Annual Survey of Education –Rural. This is the second PAISA report. In 2009, the survey covered a total of 14231 Primary and Upper Primary Schools in rural India. The 2010 survey covered 14240 schools and the PAISA 2011 survey covered 14,283 schools across rural India. The ASER survey is a citizen led survey conducted through students, district education institutes, community organisations and non-governmental organisations. PAISA is thus the first and only national level, citizen led effort to track public expenditures.

PAISA’s specific point of investigation is the school grants in Sarva Shiksha Abhiyan (SSA). SSA is currently the Government of India’s primary vehicle for implementing the Right to Education Act (RTE). SSA is thus the most crucial vehicle for the overall provision of elementary education in the country today. In 2010-11, school grants accounted for 5% percent of the total SSA allocation. Small as they are, these are the only monies over which School Management Committees (SMC) can exercise some expenditure control. Consequently, school grants have a significant bearing on the day to day functioning of the school – whether school infrastructure is maintained properly, administrative expenses are catered for and teaching materials (apart from textbooks) are available. In the context of RTE, these grants take on an even greater relevance. The RTE mandates that all SMC make school development plans. The intent behind these plans is to create a bottom-up, school based funding structure where individual school needs are prioritised.

In the last two years, three types of grants have been provided for all elementary schools in the country.[1] These are: a) Maintenance grant; (ii) Development grant or School grant; and (iii) Teaching Learning Material grant (these go directly to teachers). The grants arrive at schools with very clear expenditure guidelines. The Maintenance grant is for infrastructure upkeep, the Development/ School grant is meant for operation and administration and Teacher Learning Material is for extra instructional aids that may be required for teaching. Apart from this, grants are also provided for building additional classrooms. In PAISA 2012, we have attempted to track the classroom grant as well.

The PAISA survey focuses on the following key questions:

(a)  Do schools get their money?

(b)  When did schools get their money (i.e. did funds arrive on time)?

(c)   Did schools get their entire entitlement (i.e. the set of grants that are meant to arrive in school bank accounts as per the norms)?

(d)  Do schools spend their money?

(e)  If so, what are the outputs of this expenditure?

To contextualise school level expenditures and provide a flavour of the larger planning and budgeting process, PAISA 2011 also reports on overall trends in Sarva Shiksha Abhiyan (SSA) allocations and expenditures across three years: 2009-10 and 2011-12.

Findings from the PAISA Survey

SSA allocations and expenditures

  • India’s SSA budget (Government of India and State share) has more than doubled between 2009-10 and 2011-12, up from Rs. 26,169 to Rs. 55,746.  
  • Across India, per child allocation has more than doubled from Rs. 2,004 in 2009-10 to Rs. 4,285 in 2011-12.
  • There are state variations in outlays. Outlays in Andhra Pradesh and West Bengal doubled while outlays in Haryana and Jharkhand had a minimal increase of 39% and 30%, respectively.
  • In 2010-11, per child allocation ranged from `3,100 and `3,600. Per child allocations for Nagaland were highest at `12,556, followed by Sikkim and Chhattisgarh at `5,723 and `5,511, respectively.
  • Allocations to teachers (salaries, training and teaching inputs such as Teacher Learning Equipment) accounted for the largest share of the SSA budget. In 2011-12, teachers accounted for 44% of the budget. School infrastructure accounted for the second largest share with an allocation of 36% while children (entitlement and special programs) accounted for 10% of the SSA budget.
  • There are variations in allocations across states. In 2011-12, Bihar allocated 32% of its SSA budget to teachers. 51% of Bihar’s budget was allocated to school infrastructure. Uttar Pradesh and Rajasthan allocated 72% and 74%, respectively to teachers.
  • In 2010-11, India spent 70% of its SSA budget. Spending was low for quality related activities at 73% and community mobilization and training was the lowest at 63%.

School grants

Do schools get their money?

  • Overall, grant receipts to schools have improved from 77% in 2008-09 to 82% in 2010-11. 2010-11 figures show a marginal decline from 2009-10 when 84% schools reported receiving grants.
  • There some differences across grant type. In 2010-11, 84% schools reported receiving the maintenance grant; 87% received the teacher learning material grant and 77% received the development grant.
  • Grant receipts vary by state. Uttar Pradesh’s schools report the largest improvements in grant receipts from 67% in 2008-09 to 78% in 2010-11. Grant receipts in Bihar fluctuated over the three years. In 2008-09, 73% schools reported receiving grants. This improved to 87% in 2009-10 and dropped, marginally to 82% in 2010-11. Jharkhand’s schools also reported similar fluctuations. In 2008-09, 76% schools received grants. This improved to 91% in 2009-10 but dropped to 85% in 2010-11.

Does money reach on time?

To assess speed of fund flows, schools were asked whether they received grants for the current fiscal year (2011-12 in this case) at the time of the survey. The survey is conducted between October and November which is half way through the fiscal year.

  • Overall, there has been little change in the timing of grant receipts. In 2009-10, 59% schools reported receiving grants. This dropped marginally to 53% in 2011-12.
  • Unsurprisingly, there are variations in timing across states.  Punjab’s schools reported the most dramatic fluctuations. In 2009-10, 80% schools reported receiving their grants by November. This dropped to 91% in 2010 and a further 32% in 2011. Bihar’s schools also reported similar variations. In 2009, 77% schools reported grant receipts by November. This increased to 60% in 2010 but dropped to 30% in 2011.

Do schools get all their money?

While schools get money, data suggests that they don’t always report receiving their entire entitlement. It is important to note that on close examination of the data, there were cases where respondents did not indicate types of grants and instead reported receipt of one consolidated figure. Therefore, this data could also be taken as a proxy for awareness levels amongst headmasters (the primary respondents of this survey).

  • Overall, the quantum of grants received in schools has improved. In 2008-09, 55% schools reported receiving all 3 grants. This improved to 70% in 2010-11.
  • There are state variations. Grant receipts in Rajasthan improved from 38% schools that reported receiving all 3 grants in 2008-09 to 54%. Himachal Pradesh also saw a significant improvement from 71% schools receiving all 3 grants in 2008-09 to 90% in 2010-11.

Do schools spend their money?

  • On average about 90% schools that receive money report spending their money.
  • Schools spend the bulk of their money on essential supplies. Between April 2010 and November 2011, 68% of India’s schools whitewashed their walls and 69% used some of their money to fund school events. 

Links between outlays and outcomes 

It is widely recognized that increased outlays in elementary education have not led to improved outcomes. To examine this in greater detail, PAISA 2011 undertook a preliminary analysis of the links between per child expenditure under specific categories (teachers, school, children, quality) and learning outcomes. To do this, PAISA analysed per child expenditure data for 2009-10 and ASER learning level data for 2010. This analysis points to a positive correlation between per child expenditure on quality and learning levels. This correlation merits further analysis, especially because expenditure on quality is relatively low and is usually incurred towards the end of the financial year. Interestingly, PAISA did not find any correlation between expenditure on teachers and children’s learning levels.


[1] With the implementation of RTE for the 2010-11 fiscal year some states introduced new grants such as a transport grant and uniform grant. In the interests of developing a comparative picture both across fiscal years and across states, we have restricted our tracking exercise to these 3 grants. In PAISA 2011, we will track these new grants.

Supreme Court Judgment on the RTE

In a landmark judgment on April 12, 2012, the Supreme Court upheld the constitutional validity of the provision in the Right to Education Act, 2009 that makes it mandatory for all schools (government and private) except private, unaided minority schools to reserve 25% of their seats for children belonging to “weaker section and disadvantaged group”. Here’s the link to the judgement.

Open Government Platform – A few thoughts on it

Laina Emmanuel, Accountability Initiative

On 30th March 2012, I attended the release of the Open Government Platform (OGPL) in New Delhi. Launched by Shri Kapil Sibal, Hon’ble Minister of Communications and Information Technology and Human Resource Development, GOI, this platform is a “A joint effort from India and the United States to promote transparency and greater citizen engagement by making more government data, documents, applications, tools and services publicly available” You can see the entire press release here

A little about the history of the initiative: Most of our readers would know about the ambitious, but now largely defunded open government platform Data.gov in the US. The project has inspired Open Data Sites across the world. As of now, there are 30 country-specific Open Data websites [You can explore all of them here].

To help more countries set up their own Open Data sites, the United States and the Indian Government decided to collaborate on building an easily-deployable, open-source data platform, which would combine the best features of India’s “India.gov.in” and the U.S “Data.gov”. And that is what the OGPL is all about – a template which governments can deploy. The first set of source code for this platform, built on Drupal, is now available on GitHub. (Drupal is an extremely popular platform powering millions of websites and applications on the web. Thus the OGPL is a platform built over another platform and governments can use this platform or template to quickly deploy their own site.)

There are a few points that immediately struck me, and this blog post is about those.

The Platform vs The Data: First off, I think there is a confusion that needs to be addressed. The OGPL is not that one-stop data portal India has been waiting for, where citizens can find government data-sets, documents etc. Instead it is a platform (and the word is used very specifically), which could be used for putting out data and documents, if a department chooses to deploy it. This very important distinction, I think was lost during the conference. People were mistaking the template for the actual thing. Which is why the questions at the end tended to be about when can the data be downloaded, what’s the timeline for downloading and so on?

A good way to think of this distinction would be to compare it with blogs – Every Government Department can choose to have a blog by deploying WordPress on their servers, but whether they do or not is their choice. Similarly any department can choose to make their data ‘open’ by deploying the ‘Data.gov-in-a-box or OGPL’ on their servers, but whether they do it or not is their choice.

The collaboration model: During the release, a significant amount of time was spent on showcasing the innovative model of collaboration between the US based team and the India based team who built this platform. The collaboration essentially consisted of using open source technologies and project management tools, such as Skype and Google Doc. Now, those who are coming in from an IT background, would be very non-plussed to see such trivial details being highlighted. Video conferencing, document collaboration etc are now hygiene requirements for remote collaboration in the IT industry.

However, before dismissing these as publicity gimmicks, one needs to see how bold these moves are, by comparing it with other government collaborations. I don’t have statistics on it, but my sense is that most inter-governmental collaboration goes through layers of bureaucracy and permissions. It’s in this context that using open-source and real-time tools for collaboration is revolutionary for the governance space.

And AI would certainly be in the best place to say that! Though not in the international space, we have been introducing such collaborative technologies for project management and knowledge sharing in the local governance space since November 2011.  In our PAISA course, we have been teaching our  governance field associates (PAISA associates) to use Facebook,  Skype and SabseBolo to network and learn from each other; Google set of apps such as Google Doc, Google Calendar to manage projects and Freemind to brainstorm. Through these tools, we are slowly building a culture of peer learning and best practice sharing at the ground level. The peer learning that has started is exhilarating especially when you consider that just a few years ago, seeing what’s happening in a district and sharing it in real-time with peers sitting in another district was an insurmountable challenge. That’s when I realized that a lot of IT folks have probably lost the magical feeling they first felt when they were introduced to technologies such as Orkut, Facebook, Skype etc. They now take these technologies for granted. But working with these very technologies in the local governance space and also after seeing it being used in the OGPL, shows me that their potential has not been exhausted. A lot can still be done.

Open Source and Governments: Most of our readers would be familiar with the term ‘Open Source’. For those who are not, it implies that the source code of the software product is free for anyone to examine and tinker around. Nobody would have ever imagined that open-source would work, given that at the end of the day nobody owns the code. But the amazing part is that it does, and is now a serious challenger to the likes of Microsoft, Apple etc.

But for this radical philosophy to work, there are some conditions that need to be established and some rules that need to be followed.  Eric. S. Raymond in his seminal essay “The Cathedral and the Bazaar” has very succinctly summarized some of these rules. The very first one is that “Every good work of software starts by scratching a developer’s personal itch.”

And here is where the OGPL would possibly run into troubles. The “data.gov in a box” project is trying to do two things – it’s trying to function like an open source project by posting their source code on the Internet and building a community of volunteer developers around it. On the other hand it is being driven by government bodies and individual programmers who are trying to get things off the ground and are worrying about how good it is. It’s an odd combination – developer control vs open source philosophy of  ‘no control’ fighting it out! And you do see the effects of this on the level of engagement of developers on the GitHub site. As Jeff Miccolis, a senior developer at Development Seed, says in this article – “There is no history in the git repository they have on GitHub, just 1 issue in the issue tracker, nor even an explicit license in the repository.” Clearly, people don’t flock to an open-source project just because it’s open. This lesson has been learnt the hard way by a number of businesses which have tried to marry projects with open-source. A good example is  the software ‘Chandler’, the troubles and life of which were documented in Scott Rosenbergs ‘Dreaming in code’. Is it going to be different for the marriage between Governments and Open-Source? Only time will tell.

But, all in all, a great start – a project which was much needed, and which seems to have done the correct thing by going open-source. The challenge going forward is getting the developer community involved. The world is waiting to see where it goes.