Code For India – Accountability & Transparency Camp

Accountability India is conducting a bar-camp on accountability and technology issues.

BarCamp is an ad-hoc gathering born from the desire for people to share and learn in an open environment. It is an intense event with discussions, demos, and interaction from attendees. It is based on the premise that the combined knowledge of attendees in a conference is usually greater than that of the panelists. So it makes sense for the attendees to throw up topics and lead them.

We asked for suggestions from people. And people have come up with some brilliant ideas! If you want to put in your own suggestions, you can do it in 2 ways. You can either leave it as a comment here on this blog post, or you can get on to our Facebook page and put in your suggestions there (either as a direct comment or on our poll question). Alternatively, you can join our page on barcamp.org and directly put your suggestions there (more complicated). You can also send us suggestion through twitter using the hash tag #TAC1

The consolidated list of suggestions from the community can be found here.

The Case for Incentive Payments to the Teachers in Government Schools

There has been a long debate about paying the government teachers (and public sector employees, in general) as per their performance. It has been argued that problems like high absenteeism, lack of teaching when in school, and abysmal quality of teaching might be alleviated if the teacher salary is made conditional on outcomes reflecting their performance. Given the unionization among the government teachers, wider implications for payment policies in public sector, and some legitimate concerns, this policy has been opposed vociferously. Rigorous empirical evidence on this controversial question has started coming in only recently. This post summarizes results from some of the recent research papers analyzing the impact of making the teacher salary conditional on certain observable outcomes.

Duflo, Hanna & Ryan (2007) conducted a randomized experiment in the Indian state of Rajasthan where, in 57 out of 113 randomly chosen schools, a teacher’s daily attendance was verified through photographs with time and date stamps. In the comparison schools, teachers were paid a fixed rate for the month- Rs. 1,000. The teachers in the treatment schools received Rs. 50 bonus for each additional day they attended in excess of 20 days, and Rs. 50 fine for each day of the 20 days they skipped work, in a given month. The authors find that over 30 months in which the attendance was tracked, teachers in the treatment schools had an absence rate of 21% as against 42% in the comparison schools. Thus, the program halved absenteeism. Reduction in absenteeism meant the students in the treatment schools received more days of instruction, and their test scores showed significant improvement.

The schools in the sample are run by an NGO- they are not government schools, there is only one teacher and 20 students on average in the age group of 7 to 10 years. So the schools are quite small. The treatment involves monitoring and financial incentives, so it would be difficult to separate out the effect of monitoring and of the financial incentives (thought the authors estimate a structural model with some assumptions which indicate that the effects are driven by the financial incentives).

Glewwe, Ilias and Kremer (2010) analyze the effect of providing gifts (i.e. incentives in kind not cash) to all teachers and the headmasters (i.e. group incentive, not individual incentives) in 50 out of 100 government schools if the students scored well on district exams, in two Kenyan districts. Prizes were awarded based on the average performance of all students in the school who were in grades 4-8. The average performance is calculated through a formula, which depended on the fraction of enrolled students taking the exam and their scores. The results suggest that the treatment schools do significantly better on both these counts, but the effect on number of enrolled students taking exams is much stronger than the effect on test scores. These effects seem to kick in after some lag. Once the program ended (after two years), there was no difference in the treatment and comparison schools. The authors also find that the program had no effect either on teacher attendance or the manner in which teaching is done though the test prep sessions seemed to have gone up.

Muralidharan & Sundararaman (2011) analyze a large teacher performance pay program in Andhra Pradesh (AP). The study has a representative sample of 300 government schools in rural AP- 100 in control group, 100 in individual incentive treatment group and 100 in group incentive treatment group. This design allows the authors to analyse, in a single experiment, the differential effects of individual vs. group bonuses.

The incentives were based on the average improvement in test scores (math and language) of students subject to a minimum improvement of 5%. In the schools with group incentives, all the teachers received the same bonus based on average school-level improvement in test scores, while in the schools with individual incentives, bonus for teachers was based on average test score improvement of students taught by specific teacher

The authors find that at the end of two years of the program, students in the incentive (both, individual and group incentives) schools performed significantly better than those in the control schools    . Interestingly they find that students in the schools with the group incentives and the individual incentives performed equally well in the first year, but the individual incentive schools significantly outperformed the group incentive schools after two years of the program. They also find that students in the incentive schools performed better not only in math and languages, but also in science and social studies, for which there were no incentives. Their results suggest that the main mechanism for the impact of the program was not increased teacher attendance, but greater (and more effective) teaching effort conditional on being present.

The above experiments were carried out in the developing countries. A recent NBER paper (NBER working paper no. 16850) reports results from a randomized evaluation in over 200 New York City public schools. Whether a school receives incentive amount was based on whether it met the annual performance targets based on school report card scores. These scores depended on a weighted average of variety of criteria described in detail in the paper. The author finds no evidence that the teacher incentives increase student performance, attendance or graduation rates. He also doesn’t find any change in student or teacher behavior.

Thus, the experiments in the developing countries suggest that incentive payment for teachers do work. They also suggest that if there are multiple objectives and if the incentive structure is not simple, incentive payments may not work. Further, individual incentives seem to be more powerful than the group incentives. Given that 40% of the SSA budget (Centre and the states combined, for 2009-10) is spent on teacher salaries, and the teacher salaries are also the largest component of the state education budgets, it might be worth trying out this policy.

Random- esque

In the spirit of my previous blog I have endeavoured once again to explain various phenomena, through my own tainted glasses- my home grown typologies. This time around the innocent victim is none other than the statistical technique of randomized evaluations (applause) my fascination for which I can only describe as being random-esque (louder applause please).  Positing myself at the very far end of the spectrum when it comes to all things statistical, randomized evaluations was a concept which was entirely new to me. As it would happen, I was recently given an opportunity to attend a workshop organized by J-PAL and ASER Ccentre on understanding the methodology of randomized evaluations. My experience greatly inspired me, which brings me back to why I am launching into a panegyric and going about ascribing my precious little typologies to a statistical methodology.

So let me begin my describing what exactly is meant by the concept. Randomized evaluations constitute one of the methodologies adopted to evaluate the impact of a particular programme/scheme.  More specifically the methodology seeks to measure whether programmes or policies are succeeding in achieving their goals. Take for instance a programme like the Janani Suraksha Yojana (JSY) – a conditional cash transfer aimed at reducing maternal and neo-natal mortality by promoting  safe institutional delivery among  poor pregnant women. Given the large budget of the scheme amounting Rs `1,515 crores (see Accountability Initiative Budget Brief on Health http://www.accountabilityindia.in/article/budget-health/2145-health-sector-goi-2010-11-new), it seems pertinent to assess the effectiveness of the programmes; it’s success in achieving its stated desired goal and objective. Programme effectiveness is usually evaluated by comparing outcomes of those who participated in a programme with those that did not participate in the programme. This is because when we are trying to evaluate how effective a programme has been we are really asking is what would have happened in a situation had the programme not been introduced. In statistics this is referred to as the counterfactual – a hypothetical situation, which cannot be directly observed but can only be mimicked. One way of attempting to mimic the counter factual is to compare those who participated in a programme and those who did not. The key challenge in impact evaluations is to find a group of people who did not participate, but closely resemble the participants. Measuring outcomes in this comparison group is as close as we can get to measuring how participants would have been without the intervention (for more details see http://www.povertyactionlab.org/methodology).

Comparison groups can be constructed in many ways. One of the common methods is to compare the participant group before and then after the programme to measure how the status of the participants changed over time. In the context of the JSY this would imply comparing an outcome such as the number of beneficiaries who accessed institutional delivery before the programme with the number of beneficiaries who accessed such services after the programme. Another comparison group can be those who did not participate in the programme, their status can be compared to those who did participate in the programme. For instance in the case of JSY, it would mean comparing the access of institutional facilities by beneficiaries to those of non beneficiaries.  A third way is to constitute those who did not participate in the programme as the comparison and then assess their status both before and then after the programme. Through this method it is possible to measure change in the status of the programme participants (over time) relative to the improvement or change of non participants. In the case of JSY it would imply, measuring the institutional facilities accessed by non beneficiaries both before the programme and the facilities accessed after the programme, compared with the status of beneficiaries.  Additionally it is also possible to construct a comparison group of individuals who did not participate in the programme but for whom data was collected both before and after the programme. In this case data is not collected not only on outcome indicators but also other explanatory variables.  Impact through this methodology is assessed by comparing those individuals those who participated in the programme and the difference between the two is controlled for. Here again drawing on the example of JSY this would mean considering the status of beneficiaries on a range of outcomes, not only whether they accessed institutional facilities but also indicators such as caste, income and economic status which may influence the access to such facilities.

So if there is a range of ways to create a comparison group then what exactly is the relevance of randomized evaluations? Advocates of randomized evaluations argue that in comparison to all these different methodologies, randomized evaluations do the ‘best job’ in determining the impact of a particular programme. This contention is based on the understanding that the aforementioned methods are based on certain assumption. Thus findings from such survey hold true as long as certain conditions are met with.  Take the first method, if we only compare the number of beneficiaries who accessed institutional facilities both before and after the programme then we are implying that the JSY programme was the only factor influencing any change in the access to institutional facilities. This method does not cater to the fact that it may be another variable such as an awareness campaign which might have been more influential than cash transfer in impelling women to access institutional services. The second methodology in comparison is based on the assumption that non beneficiaries are identical to the beneficiaries, except for their participation in the programme. This is a difficult proposition given the wide difference in population. In a similar vein the third method described, wherein the changes in status of the non beneficiaries before and after the programme are compared that with the change in the status of the beneficiaries is employed to evaluate the impact of the programme, relies on the assumption that if the programme had not existed then the two groups would have had identical trajectories over this period.  The fourth method which tries to control for variables which may explain the difference in the outcomes of beneficiaries and non beneficiaries, also implicitly relies on the assumption that factors that were excluded because they could not be observed such as religious beliefs which prohibit access to institutional facilities, do not bias the results because they are either uncorrelated with the outcome or do not differ between beneficiaries and non beneficiaries.

Hmm… If your anything like me your probably thinking- ‘if previous methods are all based on certain assumptions which somewhat taint and bias an assessment of a particular programme, then surely randomized evaluations must be riddled with similar problems’. To my great disenchantment my scepticism was discovered to be quiet substantially unfounded. Randomized evaluations I was pressed to recognize represent a more accurate method of constructing a comparison group which closely resembles the participant group/beneficiaries. The methodology adopted in creating this comparison group is termed random assignment. Random assignment involves selecting randomly selected a group from the larger population, say the population of women and then assigning them again randomly to a group that receives the cash transfer under JSY and those who do not received such benefits. The significance of selecting a group of beneficiaries and non beneficiaries from the larger population is that the attributes of those chosen individuals are representative of the entire group from which they are chosen. In other words what is discovered about them is also probably true for the larger group. In statistical terms when a group selected from the larger group is similar to it, they are considered to be statistically equivalent. Further since the beneficiaries and non beneficiaries are also randomly assigned then they two are considered to be statistically equivalent to each other. The group which has been randomly assigned as to receive the programme is then evaluated. Drawing on the example of JSY, this would imply that in the group of women who have been designated as the intervention group would receive cash incentive while the other group of women would not. Since the two groups began from being statistically equivalent, interventions introduced for one group would make it different from the other. Differences seen between them can then be measured and attributed to one having been given cash incentive and the other not. Thus assumptions which somewhat bias the results of the previously mentioned methodologies do not hold true in the case of randomized evaluations.

This of course is only the tip of the proverbial iceberg. Given my limited knowledge I have tried to err on the side of caution by presentation only a small aspect of what this methodology encapsulates. There is a lot more that I am yet to understand, and it would be great if I could get some more insights (this is where you all step in) to make sense of all this random-ness! But for now I am enchanted and random-esque it remains.

Unpacking the SSA Fund Flow Process: A case study of Rajasthan

An essential question that arises while tracking expenditure in public programmes such as the Sarva Shiksha Abhiyan (SSA) is how is money transferred through the system? Specifically, what are the processes through which funds are transferred from the Centre to the unit of service delivery – in this case schools? This case study tries to unpack the fund transfer process by drawing on the experience of one state- Rajasthan, to map the various levels of bureaucratic hierarchy through which funds travel before finally reaching their destination – elementary schools.

The Dejure Planning and Fund Transfer Process- What the Guidelines say

Like all government programmes, the process of fund transfers in SSA begins with the formulation of a plan. The primary planning document under SSA is the Annual Work Plan and Budget (AWP&B) which consists of budgetary proposals for prioritized activities/interventions to be undertaken in the coming year, progress made and targets achieved in the previous financial year and the spill over activities proposed to be carried over to the current year. According to SSA guidelines, AWP&B’s are prepared in each state through a decentralized participatory planning exercise. Beginning at the habitation level, School Management Committees (consisting of representatives of parents and teachers) in consultation with community members are responsible for developing plans to reflect needs and priorities at the local level. Plans made at the habitation level are then compiled by the planning team at the block level (members of the planning team include, the Block Education Officer, Panchayati Raj representatives, and NGO representatives) into block level plans. These in turn are consolidated by the district core planning team (including the District Project Officer, and representatives from various departments such as Health, Public Works, Social Welfare and Women and Child Development) into a district level AWP&B. District AWP&B’s are then aggregated at the state level for the formulation of the State AWP&B.[2]

To ensure that the planning process is completed before the close of the financial year, SSA guidelines prescribe a time table for the preparation of the state AWP&B. In accordance with the calendar, the visioning exercise and planning of activities is required to be completed at the district level every year, by January 1st. The state level AWP&B’s are then prepared and submitted to the Project Approval Board (PAB) at the Ministry of Human Resources and Development by April.[3]

Once plans are approved by the PAB, money from the central government is released to the State Project Office (SPO), the body responsible for implementing SSA at the state level. Funds are received in two instalments, once in April and then again in September. Apart from the grants-in-aid given by the centre, 35% of the total SSA budget (including KGBV and NPEGEL) is funded by the state government. According to the norms the second instalment of grants from the central government is released only after the state has transferred its matching funds to the SPO. Thus by the end of the second quarter[4] of the financial year, a significant proportion of the total allocations should be disbursed to the states[5].

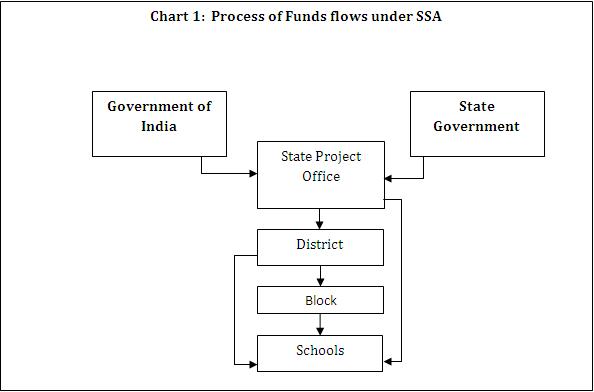
At the state level, the first instalment received from the Centre is first spent on teacher’s salary and administrative expenses. Overheads such as school grants are usually funded from the second instalment. School grants can be transferred funds in three ways. The state project office can either disburse funds through an electronic transfer to districts who release funds to the block. The block is then responsible for transferring monies to schools. Alternatively, funds can be transferred from the district directly to the school account. Increasingly, in many states with more sophisticated rural banking facilities, funds are transferred directly from the SPO to the school bank accounts. Funds when transferred from the district to the schools are treated as an advance (funds released from the district to the schools are initially classified as an advance). At the district level for reporting purposes such advances are treated as expenditures.[6] Advances are then adjusted upon receipt of utilization certificates/expenditure statements which are required to be submitted by schools within one month of the completion of the financial year[7]. Thus there are can be discrepancies between initial reportage of expenditure and final expenditures once the financial year closes.

The De-facto fund flow and planning process: The case of Rajasthan 2010-11

In Rajasthan the planning process for financial year 2010-11, began in the month of December 2009. Habitation and block level plans were prepared by the block office in consultation with the Cluster Resource Centre Facilitators (CRFC) who were responsible for assessing and compiling the school needs. The District AWP’s were subsequently prepared and submitted to the state in February, 2010. After the submission of the district level plans, the State began a process of compiling the state AWP&B which was later submitted to the PAB in May 2010. In all, there was a one month delay in the planning process.

Delays at the planning stage were followed by deferrals in the release of grants by the Centre. The first instalment which ought to have been transferred by April/May was received two months later in June on 07.06.10 owing, in part, to delays in the planning process. The second instalment was then transferred by the Centre on 22.07.10. The balance from the first instalment however was not transferred with the second instalment. Consequently, a third instalment was made by the centre to the SPO on 26.11.10. The state government in turn released its funds from the treasury to the SPO in three instalments beginning in April through till August 2010.

Table 1 below provides the details of the releases made by the Centre and the State up to December, 2010.[8]

Table 1: Fund transfer process in Rajasthan: April 2010 – December 2010

Total Outlay Approved

(in Lakhs)

GOI Share State Share
279247.81 Date of release Date of receipt Amount

(in Lakhs)

Date of release Date of receipt Amount

(in Lakhs)

25.05.10 07.06.2010 38000.00 22.04.10 29.04.10 21531.00
07.07.10 22.07.2010 40933.00 25.05.10 28.05.10 9300.00
26.11.2010 54299.00 07.07.10 07.07.10 21791.00
23.08.10 30.08.10 33091.00
133232.00 85713.00


According to the state level officials, funds were transferred to the district at the beginning of the second quarter (between august and September) of the financial year. The exact dates for fund transfer could not be ascertained. However, through an analysis of overall expenditures reported by districts at the end of third quarter (December, 2010) districts had received and reported expenditures on 78% of their total allocations of Rs 277286.52 Lakh. This is assuming that from the total funds received by the SPO on 26.11.10 which amounted to Rs 218945 lakhs, the total allocation for the SPO office was met (Rs 1961.290 Lakh) and the balance (Rs 216983.7 Lakh) was transferred to the districts[9]. During the same period, expenditure incurred at the district level was Rs 180198.565 Lakh, which accounted for 83% of the total funds transferred (Rs 216983.7 Lakhs)[10].

The total allocations for the three annual school grants amounted to Rs. 13212.515 lakh, 79% of the funds were reported spent by the end of third quarter.[11] According to the state expenditure statement dated 30.09.10 expenditure, 80% of the TLM grant, 41% of SMG grant and 82% of SDG grant had been spent.[12] By December, this expenditure recorded under the three grants accounted for approximately 86%, 65% and 90% of the total funds allocated for the three grants, respectively.[13]

Interestingly, findings from the PAISA school survey for 2009-10 paint a somewhat different picture. According to the 2009-10 data for grant receipt half way through the financial year (October/November when the survey was conducted), 41% primary schools (PS) and 28% Upper Primary schools (UPS) reported that they had not received any of the three annual grants. Only 23% of the PS and 33% of the UPS reported receipt of all three grants. The gap between these findings and expenditures reported by the states can, in part, be explained by the peculiarities of the expenditure reporting system. In the current system, funds advanced by the district to schools are reported as expenditure and adjusted only upon submission of expenditure statements, which are submitted at the end of the financial year and often much later than the end of the financial year. Hence, it is possible for districts to report expenditure under the three annual grants, without schools either having received or spent funds during the period for which expenditure is reported.

What explains delays in receipt of funds, if these have, in fact, been advanced from the districts? Anecdotal reports from schools suggest many possibilities. For one, the current system of electronic transfers is not always instantaneous due to the limited reach of the rural banking network. There may also be other reasons such as limited banking facilities at the ground level which may constrain the capacity of the Head Master to access the school account on a regular basis to check whether money has been credited to the account. Finally, lack of information on the different grants and entitlements that a school gets could also explain these results.

Table 2 Process of Fund flows- Findings from Rajasthan

  • Plans submitted to the PAB in May, 2010
  • SPO received the first instalment from the GOI in June. First instalment from the state treasury is received in April 2010.
  • By the third quarter of the financial year the SPO had received 78% of its total SSA outlay
  • Funds were transferred from the state to the district  in the second quarter of the financial year
  • By the end of December, 2010 funds 78% of total district allocation was spent.


As this case study demonstrates, the process of fund transfer is a lengthy and complex one. Funds pass through several layers of the bureaucratic labyrinth before finally reaching the frontline service delivery unit. Complicating the process further is that despite the prevalence of norms and standards to ensure the timely disbursement, delays are often experienced in the allocation of funds from one level to the next. Additionally, there are gaps in the amount of real time information of receipt and expenditure of funds at each level. The causes behind these delays and the specific nature of bottlenecks need to be understood better. To address these problems, there is a pressing need for further research.


[1] Research Analyst with Accountability Initiative, Centre for Policy Research

[2] Manual for Financial Management and Procurement unit, pp.5-50, SSA Portal, see http://ssa.nic.in/financial-management/manual-on-financial-management-and-procurement/manual-on-financial-management-and-procurement-unit/

[3]  Manual for Financial Management and Procurement unit, pp. 50, SSA Portal, see http://ssa.nic.in/financial-management/manual-on-financial-management-and-procurement/manual-on-financial-management-and-procurement-unit/

[4] Financial year is divided into four quarters of three months. The first quarter spans the period from April-June, the second quarter includes the period from July-September, the third quarter includes the period from October-December and the fourth quarter spans the period from January-March.

[5] Ibid. 65-77

[6] Although in the books of account they are treated as an advance till utilization certificates are submitted.

[7] Ibid. 65-66

[8] ‘Details of Year wise Releases since Inception for SSA by GOI & GOR’, from details of the year wise releases towards SSA2010-11bhu2/17/2011GOIGORreleasesSSA, obtained from the State project office, Rajasthan

[9] This assumption is supported by the expenditure statement obtained from the SPO Jaipur, according to which funding for all major overheads except allocations for SPO, are transferred to the districts. This includes teachers salary, free textbooks, civil works, school grants, TLE, teacher training, training for community leaders, provision for disabled children, management, innovations, etc

[10] Ibid

[11] Since we are looking at total district figures it is not possible to determine when districts transferred funds to schools because that will vary for each district

[12] State wise component wise expenditure as on 30.09.10, SSA portal, see http://ssa.nic.in/page_portletlinks?foldername=financial-managementibid

[13] Expenditure statement Sarva Shiksha Abhiyan (SSA) 2010-11, December 2010, obtained from State Project Office, Jaipur


Beyond Allocations: Expenditure Flows in Sarva Shiksha Abhiyan

On 28 February 2011, the Union Budget announced a 27 percent hike in allocations for elementary education for the 2011-12 financial year (FY). At 65 percent of the elementary education budget, the Sarva Shiksha Abhiyan (SSA) too witnessed a 40 percent hike in allocation, which now stands at Rs. 21,000 crore. This was no surprise – since  2005-06, there has been an over 3-fold increase in GOI allocation and considering SSA is the primary vehicle for delivering the Right To Education (RTE), increased allocations were inevitable.

But are these increased allocations sufficient to ensure the SSA goal that, “every child is in school and learning well”? Crucially, do these increased allocations get spent efficiently and effectively so that resources and expenditure match school needs on the ground? To answer this question, this article undertakes a trend analysis of SSA allocation and expenditure between 2005-06 and 2009-10.[2] Here is what we found:


Expenditure Performance: In the last five years, while allocations have increased significantly, overall expenditure performance has been weak with a large portion of allocated funds remaining unutilised. For example, in 2005-06, 32 percent of SSA funds were not spent, this dropped marginally to 25 percent in 2009-10, leaving an unspent balance of Rs. 6,608 crore for the year.


The extent of the problem can be better examined at the state level. For instance, Uttar Pradesh, which received the largest share of SSA allocations in 2009-10, spent 75 percent of its planned allocations. Similarly, Rajasthan with the fifth highest share of allocation spent 96 percent. Bihar, which saw a nearly five-fold jump in SSA allocation from Rs. 843 crores to Rs. 4,109 crores, saw a ten-fold increase in expenditure, yet its overall expenditure performance remained poor with only 51 percent of planned allocations being spent.


Component-wise Trends: The Right to Education lays importance on the provision of adequate infrastructure facilities in schools (including provision of boundary wall, library, playground, drinking water facility, toilets, additional classrooms, headmaster cum store room etc.) as well as the maintenance of the prescribed Pupil Teacher Ratios (PTR).  A majority of SSA allocations have been earmarked for teacher salary and infrastructure. But past experience with SSA expenditure suggests inefficiencies. For instance, in 2009-10, teacher salary and infrastructure together accounted for 72 percent of overall SSA allocation. However, expenditure performance of these two components has been variable. While expenditure on teacher salaries increased from 63 percent in 2005-06 to 85 percent in 2009-10, for infrastructure, expenditure has actually dropped from 80 percent to about 60 percent. Interestingly, despite the increase in teacher salaries, expenditure incurred on training remains low with only 63 percent of earmarked funds being utilised in 2009-10.


The RTE also has special provisions to ensure that children who have not been admitted to school or have not completed elementary education have the right to receive special training even after fourteen years of age. Here again, past expenditures in SSA shows that allocation and expenditure in these areas have been on the lower side. SSA allocates funds for interventions to mainstream out of school children, remedial teaching as well as inclusive education. However, funds for these special programmes constituted a mere 6 percent of total SSA allocations in 2009-10, down from 9 percent in 2005-06. There has been no real improvement in expenditure performance which has remained constant at about 80 percent.


Delays in Funds Flows: Apart from the problem of spending, there is also a delay in expenditure resulting in a last minute rush to spend funds. In 2008-09, only 37 percent of SSA expenditure was incurred in the first two quarters of the financial year. At the state level, with the exception of Andhra Pradesh, Gujarat and Chhattisgarh, most states incurred over 50 percent expenditure in the last two quarters. For instance, Maharashtra and Rajasthan, despite being good performers in overall spending capacity, incurred more than 70 percent of their expenditure in the latter half of the year. These delays are also reflected in PAISA’s micro level study of school grants.


So what have we learnt?  It is clear from the above analysis that while allocations have increased, expenditure performance has left a lot to be desired. With India’s schooling system now entering a new phase of implementation under the Right to Education Act (RTE) the current financial architecture requires revamping. Thus, we need to look beyond just allocations and take a closer look at expenditure performance and its translation into outputs on the ground if we are serious about making a tangible difference in education outcomes.


[1] Anirvan Chowdhury is Research Associate with the Accountability Initiative; Avani Kapur is Senior Research and Program Analyst with the Accountability Initiative.

[2] Data has been sourced from the Sarva Shiksha Abhiyan Portal: www.ssa.nic.in on March 7, 2011.

Closing the Expenditure Cycle – From Outlays to Outputs to Outcomes

Into its second year, PAISA2010 has expanded in its ambition, scope and analysis. If last year’s report was a statement of intent, this year the PAISA process has matured into a comprehensive expenditure tracking project, of which this report is only one part. There have been significant initiatives in state-level advocacy, district and block-level surveys, training and community mobilization at the school management committee level. The findings of PAISA 2009 formed the core of the advocacy agenda of this wider project.

One important lesson learnt over two years of doing PAISA is that any meaningful expenditure tracking effort needs to engage with policymakers, implementation officials at the state, district and block, and frontline providers, including the community groups tasked with oversight in implementation of large Centrally Sponsored Schemes (CSS) such as the Sarva Shiksha Abhiyan (SSA). If any of these links are weak, it would lead to a situation where outlays do not match the needs, and outputs are not adequate. To close the expenditure cycle, we need to be able to connect the outlays and outputs to outcomes.

The fundamental problem in elementary education today is that increased allocations are not translating into better outcomes. This year’s PAISA Report provides the tables for learning levels from ASER to enable a comparison of total and per child expenditure under SSA, fund flow and fund utilization, the status of basic amenities such as drinking water and toilets, and the enrolment/attendance levels in government schools in the states. What we find is interesting –allocations are on the rise, funds are reaching schools albeit with a significant lag, amenities exist but are not always usable. Crucially, funds are utilized but for very limited set of items, which are mostly concerned with office expenditure and infrastructure. And while the links between expenditures and outcomes are unclear, what this data shows is that enrolment levels in government schools is falling and learning levels remain stagnant. This is a worrying fact to say the least.

In the context of the implementation of the Right to Education, the PAISA Report has tried to estimate a baseline for the cost of compliance as per the norms laid down by the RTE. As far as we know, this method of estimating the cost of implementation of RTE has not been undertaken in India until now. Using school level indicators of infrastructure and teacher availability and unit costs for each of these items at the state level, we have arrived at a very conservative estimate of the magnitude of resources needed to close state level gaps vis-à-vis the RTE norms. We find that in some states such as Bihar, the recurring cost of teachers would be high due to the large gap still existing, while in states like Andhra Pradesh, the major cost would be on filling the infrastructure gap.

The implication is clear – implementing RTE will not be possible with a ‘one-size-fits-all’ approach. This is also true of the planning and resource allocation. States have to be given more flexibility in deciding what strategy to adopt to for their schools to be RTE compliant. Another important lesson is that information about expenditure must be available in greater detail and as close to real time as possible. The proposed Expenditure Information Network (EIN) is the first step. But an effective EIN will have to take into account not only when, but also how, expenditures are being undertaken, and some measure of its impact. That would go some way in closing the expenditure cycle and give us a handle on how outlays are translating into outputs and outcomes. PAISA 2010 is a step in that direction.


[1] Professor, National Institute of Public Finance Policy

The Wall Street Journal covers the PAISA 2010 launch

“Accountability Initiative” in partnership with ASER and NIPFP, has come out with the PAISA 2010 report. The complete text of the report can be accessed here.

The PAISA national report tracks fund flows and expenditures under the Sarva Shiksha Abhiyan. In 2010 the survey covered 13,021 primary and upper primary schools across the country. PAISA is the first country-wide citizen-led effort to track development expenditures. The annual PAISA survey is conducted through the annual ASER survey that tracks learning outcomes. For a more detailed explanation of PAISA, please check out the blog by Yamini Aiyar here.

The launch of this report was very well-attended and was followed by a panel discussion consisting of eminent personalities – Mr Nandan Nilekani, Mr B.J.Panda, Mr Madhav Chavan, Mr Raghunandan. The session was moderated by Mr Sudipto Mundle. The discussion focused on how PAISA methodogy can be used to track funds in a number of different government schemes and also on how outcomes in education can be improved. The launch was also covered by the Wall Street Journal. Their interview with Yamini Aiyar can be found here.

Findings from PAISA 2010 National Survey

The PAISA survey is conducted annually through the Annual Survey of Education (ASER) –Rural. This is the second PAISA report. In 2009, the survey covered a total of 14231 government Primary and Upper Primary Schools in rural India. The 2010 survey covers 13021 government primary and upper primary schools across rural India. The ASER survey is conducted through civil society partners. PAISA is the first and only national level, citizen led, effort to track public expenditures.

PAISA’s specific point of investigation is the school grants in Sarva Shiksha Abhiyan (SSA). SSA is currently the Government of India’s primary vehicle for implementing the Right to Education Act in India. SSA is thus the most crucial vehicle for the overall provision of elementary education in the country today. In FY 2009-10, total SSA allocation for the country (including state share) was Rs. 27, 876.29 crore. School grants accounted for Rs 1635.32 crore (about 6%) of this total allocation. Small as they are, these constitute as significant proportion of monies that actually reach school bank accounts and the only funds over which school management committees can exercise some control. Consequently, school grants have a significant bearing on the day to day functioning of the school – whether school infrastructure is maintained properly, administrative expenses are catered for and teaching materials (apart from textbooks) are available.

Over the last two years, three types of grants have been provided for all elementary schools in the country.[2] These are: a) Maintenance grant; (ii) Development grant or School grant; and (iii) Teaching Learning Material grant (these go directly to the teachers). The grants arrive at schools with very clear expenditure guidelines. The Maintenance grant is for infrastructure upkeep, the Development / School grant is meant for operation and administration, and Teacher Learning Material is meant for extra instructional aids that may be required for teaching. Apart from this, under the SSA framework, grants are also provided for building additional classrooms, but not all schools get this grant making it difficult to track. SSA grants are supplemented by other grants which are provided by the State governments for items such as school uniform, additional teaching-learning equipment like science or sports kits, extra books and study materials, and cycles for girls in upper primary schools. In the annual work plan and budget for SSA, each block, district and state provides the quantum of funds required for this purpose on the basis of need expressed and state and central guidelines, grants for activities not provided under the SSA fund are funded from the State government’s budget.

The PAISA survey focuses on the following key questions:

(a)  Do schools get their money?

(b)  When did schools get their money? i.e. did funds arrive on time?

(c)   Did schools get their entire entitlement – the set of grants that are meant to arrive in school bank accounts as per the norms?

(d)  Do schools spend their money?

(e)  If so, what are the outputs of this expenditure?


This year, we added two new elements to PAISA. First, we tried to map school level expenditures with activities at the school level. We narrowed the activity list to the specific activities that schools can undertake through the larger two of the three grants they get – School Maintenance and Development/School Grant. The effort behind this was to try and assess the quality of expenditures by using the specific activities that schools spend their money on as a proxy for planning efficiency (the extent to which plans match with school needs) and the extent to which funds available are sufficient for school needs.

The second new addition is the RTE. ASER 2010 has created the first ever citizens benchmark of compliance with RTE norms. Using this data, PAISA has tried to arrive at a rough cost estimate to assess how much money it would take for the Government of India and State Governments to ensure that schools meet RTE requirements. This, it is hoped will be the beginnings of a citizen led assessment of government compliance with RTE norms.

Findings from PAISA Survey: India Rural

1) Do schools get their money? In 2009-10, over 80% primary and upper primary schools reported receiving the three mandatory grants. There are some differences across the type of grants. In primary schools, 83% and 86% reported receiving Maintenance (SMG) and Teacher Learning Material (TLM) grants while a marginally smaller 78% reported receipt of Development/School Grant (SG).  A similar pattern is found in upper primary schools where 88% and 90% reported receiving SMG and TLM while 85% received SG. The 2009-10 results show a marginal improvement of 7 percentage points from 2008-09 for primary schools and upper primary schools (averaging across grants for each school type).

2) Does money reach on time? To assess the efficiency and timeliness of fund flows, schools were asked whether they received grants for the current fiscal (FY 2010-11 in this case) at the time of the survey. The survey is conducted between October and November which is half way through the financial year. On average about 54% primary and close to 68% upper primary schools reported receiving grants half way through the financial year. While the differences across types of grants are marginal, the difference between primary and upper primary schools is significant and merits further investigation. Here too, there is a difference between fund flows in 2009-10 and 2010-11 of 3 percentage points for primary schools and 10 percentage points for upper primary schools (averaging across grants for each school type).

3) Do schools get all their money? While schools get money, data suggests that they don’t always report receiving their entire entitlement (in terms of number of grants). It is important to note that on close examination of the data, there were cases where respondents did not indicate type of grants and instead reported receipt of one consolidated figure. Therefore, this data could also be taken as a proxy for awareness levels amongst Head Teachers (the primary respondents of this survey). In FY 2009-10 68% primary schools reported receipt of all three grants compared with 54% in 2008-09. 70% upper primary schools reported receiving all three grants up from 60% in 2008-09.

Unsurprisingly, the half year results paint a depressing picture. In 2010-11 44% primary schools reported receiving all three grants. Given that about half the schools reported receiving grants this could mean that the general pattern is that grants arrive in bulk and schools either receive all their grants at one time or nothing. Upper primary grants tell a similar story – 56% upper primary schools reporting receipt of all three grants.  Again this is a significant improvement from 2009-10 results.

4) Do schools spend their money? On average about 90% schools that receive money report spending their money. This is the good news. The bad news is that delays in receipt of funds seriously compromise the quality of expenditures. First late arrival of funds means that time bound expenditures such as pre-monsoon repairs, purchases of basic supplies in schools cannot be undertaken at the time of need. Second, late arrival of funds means that schools have to rush to spend their money which inevitably leads to poor quality expenditure.

5) What are the outputs of expenditures: what activities do schools undertake with their funds? The first step to assessing the outputs is to determine the precise activities that schools report spending their money on. To do this in PAISA 2010, we developed a list of activities that schools are entitled to undertake using SMG and SG funds. These can be broadly classified in to three types: a) essential supplies – such as purchasing registers, pens, chalks, dusters and so on, b) infrastructure – such as repair of the building, roof, playground and c) amenities – such as white washing, maintaining and repairing toilets and hand-pump amongst others. The PAISA 2010 survey found that by and large all schools (about 90%) use their funds to purchase supplies- both classroom and other supplies. White washing walls is also a popular activity with 64% primary and 72% upper primary schools reporting undertaking white washing activities in the last year. Next comes building repair at 52% for primary and 61% for upper primary schools. Clearly, most schools prioritize activities that are necessary for the day to day functioning of the school. Given that relatively few other activities are undertaken and that most of the money that arrives at schools is spent, one possibility is that this emphasis on essentials over infrastructure and amenities is a factor of insufficient funds – given the small quantum of money that actually arrives at schools it is possible that much of the money is absorbed in undertaking these necessary purchases. When it comes to non-essential activities, white washing seems to be a popular activity with all schools. This could be a factor of weak planning and that expenditures are not necessarily linked with school needs. The data suggests that approximately 70% schools white wash their schools but in reality, it is unlikely that such a large proportion of schools needed to white wash their walls over other activities in a given year or that white washing is more important than say repairing a roof or maintaining toilet and drinking water facilities. Anecdotal evidence suggests that one reason for this emphasis on white washing is that it is an easy tangible activity to undertake if funds have to be spent quickly and this is perhaps the reason that schools use the money they have left over from supply purchase for white washing their walls.

Interestingly, very few schools undertook repair and maintenance work on toilet and hand pump facilities and as we shall see in the next section, these facilities are in need of prioritization.

6) What facilities do schools have? In 2010, 74% schools reported having drinking water facilities indicated by the presence of useable handpump/ taps. The remaining 26% include schools that a) did not have any drinking water facility; b) had handpumps/ tap but these were non functional, and c) schools which have drinking water facility other than handpump/tap, which typically means water stored in containers. Calculations indicate that the proportion of schools with unusable handpump/tap is actually marginally higher at 9.22% than the proportion of schools without any drinking water facility, 7.62%. Since the government statistics do not record the usability aspect of the handpump/tap, this important fact goes unnoticed. Thus, making sure that the handpump/tap is functional is as important as providing the schools with them in the first place. What is worrisome is that the current situation is not so different from the situation a year ago.

The picture is even worse as far as toilet facilities are considered. In 2010, 11% of the schools surveyed did not have any toilet facility (neither common, nor for girls or for boys). But, having a toilet doesn’t guarantee access. In 27% schools, the toilet facility was locked. In 10% schools, toilets were unusable. Thus, in total, barely half of the schools (53%) surveyed had a usable toilet. These numbers are somewhat an improvement over 2009, when less than half of the schools had any usable toilet facilities.

7) To what extent the schools comply RTE norms and what are the cost implications of the RTE compliance? The Right to Education (RTE) Act lays down certain human resource  and physical infrastructure norms for every school in the country. Information about some of these is available in the survey. They include Pupil Teacher Ratio (PTR) in primary and upper primary schools (human infrastructure) and a) boundary wall/ fencing, b) safe and adequate drinking water, c) kitchen shed, d) library, e) playground, f) separate toilet facility for boys and girls- (physical infrastructure).

32% primary schools and 8% upper primary schools have fewer teachers than prescribed by the RTE. Only 11% government schools are in compliance with all the seven physical infrastructure norms prescribed by RTE for the country.  India needs Rs. 15,158 crore if the all schools are to become RTE- compliant. Details of the costing exercise are given in a separate article in this volume.

8) How do states compare with one another? To examine this, we have ranked states as 5 best and 5 worst based on the number of schools that received all 3 grants in full and half financial years. Comparison over two years allows us to assess improvements or lack of aross states. Nagaland, Karnataka, Andhra Pradesh, Himachal Pradesh and Maharashtra are the top 5 states (in no particular order) for the full financial year for both years. Interestingly, when it comes to timeliness (i.e. states that report grant receipt for all 3 grants at the time the survey is conducted), Andhra Pradesh and Maharashtra fall off the list. In 2009-10, Goa and Gujarat found place in the top five on timeliness. In 2010-11, Goa was replaced by Punjab. Andhra Pradesh which was amongst the worst performers in timeliness in 2009-10 improved its grant flows in 2010-11 but doesn’t reach the top 5 mark.[3]

Now to the specifics, Nagaland tops the list for both years with a marginal improvement in 2009-10. In 2008-09, 85% and in 2009-10 88% schools in the state reported receiving all 3 grants. Nagaland also does very well on timeliness with 64% schools reporting grant receipt half way through the 2009-10 financial year. This improved significantly in 2010 with 84% schools reporting grant receipt half way through the year. Karnataka comes second in the list with 76% schools reporting receipt of all 3 grants in 2008-09. This improved to 87% in 2009-10. In the current fiscal (2010-11) Karnataka improved its grant speed with as many as 82% schools reporting grant receipt half way through the year compared with 53% half way through FY 2009-10. Himachal Pradesh dropped from third position in 2008-09 to fifth in 2009-10 owing to an overall improvement across states in grant flows. In 2008-09 70% schools reported receiving all three grants and this improved to 83% in 2009-10. On the half way mark, although the state improved its flow of funds from 55% schools receiving all 3 grants to 78%, Himachal dropped its overall position from 2nd to 3rd in 2009-10. Maharashtra improved its position from 5th in 2008-09 with 67% schools reporting receipt of all 3 grants to 4th position in 2009-10 with 85% schools reporting receipt of all 3 grants. Andhra Pradesh moved from 4th position at 69% in 2008-09 to 3rd position at 85% in 2009-10.

Meghalaya, is the worst performer both in 2008-09 and 2009-10 with an average of 23% schools reporting receiving all 3 grants in both years. Meghalaya also does poorly in terms of timeliness with a mere 2% schools reporting receipt of all 3 grants in 2009-10. This improved only somewhat to 10% in 20010-11. Rajasthan which was the 5th worst performer at 37% in 2008-09 improved its performance to 55% in 2009-10. In terms of timeliness, the state has shown some improvement over the last two years. In 2009-10 Rajasthan was the 5th worst performer at 12% this has improved to about 30% in 2010-11. Other poor performers for 2008-09 were Mizoram at 35%, Tripura at 34% and Manipur at 27%.  In 2009-10, the worst performers were Arunachal Pradesh at 60%, Sikkim at 57%, Rajasthan at 55%, Tripura at 47% and Meghalaya at 24%.


[1] Yamini Aiyar is Director, Accountability Initiative, CPR. Ambrish Dongre is Senior Researcher, Accountability Initiative, CPR.

[2] With the implementation of RTE for the 2010-11 fiscal some states introduced new grants such as a transport grant and uniform grant. In the interests of developing a comparative picture both across years fiscal years and across states, we have restricted our tracking exercise to these 3 grants. In PAISA 2011, we will track these new grants.

[3] Important to note that we have removed Tamil Nadu from this comparison because Tamil Nadu does not report separately on the TLM grant. It also excludes Union Territories.

Hamara Gaon, Hamara School (My village, My school)

Madiyahu block, Jaunpur district, Uttar Pradesh:

I sat with a group of village women under a tree in the compound of a government primary school.   Most of the women had children who were enrolled in this school.  Many of these mothers had never been to school themselves.  But they were interested in talking about children’s education in general and their children’s education in particular.  We discussed many issues.  What kind of education were children getting? Was it good enough? Why was it not better? How had the school been in the past and what was it like now?

At a particular stage in the conversation,  I asked.  “Yeh kiska school hai? (Whose school is this?)”.  “Yeh sarkari school hai (This is a government school)”, they answered instantly.  One of them went on to explain, that because the school was a government school, it was not good.  “You see”, she said “the sarkar should come and see what is happening here – then they will know that their money is getting wasted.  Anyway, since it is free, we don’t expect much from the government schools anyway.”   All the women agreed.

“Where do you think the money for running the school comes from? Who pays the teachers? Who pays for the books, for the building, for the midday meal?” I asked.  “Sarkar se aata hai (It comes from the government)”.  “Where does the sarkar get money from?” I persisted.  One woman looked disparagingly at me, as if I was asking a really silly question. “Sarkar ke paas paisa hota hai (The government has money)” she stated firmly.  “Those who rule have money”, she elaborated.

I tried to counter the woman’s statement; “Sarkar ke paas apne aap se paisa nahi hota hai.  Janta sarkar ko paisa deti hai (The government does not have money by itself.  People give the government money).  My own words rang hollow. I could see that this logic made no sense to the women.  They looked incredulous at the thought that people give government money.  I kept going, “Aap aur hum jaise logon se paisa jata hai sarkar ko (It is from people like you and me that money goes to the government).  Now I had the full attention of the entire group of village women. The woman who had spoken earlier stood her ground. “I don’t give any money to the government.” She looked around at everyone and almost challenged them. “Hum kyon de sarkar ko hamara paisa (Why should I give my money to the government)?”, she emphatically challenged me to answer.

For the next half an hour I worked hard to persuade the women that their money funded the school. But I made very little headway.  Being agricultural people, they did not pay any income tax.  They did not buy branded products.  They did not travel much by train or bus and often when they did, they did not buy tickets.  I found it impossible to convince anyone that any of their money ever went to the government, leave alone reached the school.  I finally tried to explain using cell phones as an example. “Do you know that when you pay for the cell phone usage, some portion of that money goes to the government and the government spends it on schools?” I said. The women looked back at me. From the look in their eyes, I could see that no one was buying this argument.

This encounter in Jaunpur happened a few years ago. It bothered me enormously.  Since then I have had the similar conversations with parents of school children in many other villages in Uttar Pradesh, in Bihar and in Madhya Pradesh as well.  The script is almost identical each time.  Always with the same ending.  In every discussion, people conclude that the school belongs to the “sarkar”. The money running the school comes from the government.  Government has its own money and is neglectful of how it spends its money.  So there is waste. And so the teacher does not teach and the children don’t learn.  The village or individuals in the village do not contribute any money to the running of the school. But their children are entitled to schooling. At some level, the entire conversation ends with people being beneficiaries who receive or should receive entitlements. The delivery of the entitlements is weak and faulty. Monitoring is weak; people’s complaints are not heard or acted on. The government either does not know how to do deliver or does not care. The process of government and the nature of politics in many parts of India has left deep legacies upon people.  We believe that we are the receivers and the government is the giver, like the ‘sarkar’ – the feudal lord.

Hapjan block, Tinsukia district, Assam:

I was in Tinsukia a few days ago.  I happened to go to a rural school – a government lower primary school or “LP” as they call it in Assam. The village was not far from the border between Dibrugarh and Tinsukia.  The school was established in 1903 and has stood solidly by the side of the road since then.  Two long corridors with flanking classrooms run at right angles to one another.  The teachers proudly show me around the school. There are pictures painted on the walls and charts hanging too.  Children are busy working on different tasks in different classes. They seem to know what they are doing.  The classrooms have a cane and bamboo ceiling, high above this ceiling is the actual roof.

An elderly member of the school management committee tells me the history of the school.  A few years before 1900, his grandfather donated the land on which the school building stands.  His father studied in this school, so did he, his children and now his grandchildren study there. Well maintained and well painted, there is not a crack in the wall.  The building has survived earthquakes and other calamities.  Over time, the Panchayat has contributed to the construction of new classrooms as has the local Member of Parliament.  The head mistress proudly says that she does not allow any outsider, whether from the government or elsewhere, to do any construction in the school. Anything that has to be built is funded and supervised by members of the community.

The school has an enrollment of over 250 children – very high for a typical LP school in Assam.  In the head mistress’s office there is a board on the wall. On one side it lists the names of the head master or head mistresses since 1903. On the other side, it names the children who have been awarded scholarships in the district level Std 4 scholarship exam.  On both sides, there are many names of illustrious head-teachers and talented children.  This school is well known to have good learning levels.

A small boy in Std 2 is learning to write. He sounds out the words and then starts to write.  A teacher looks on fondly. I watch the child struggle and succeed.  “He is doing a great job” I say to the teacher who is looking on.  The teacher looks bashful for a minute and then says, “I did not know he could write!” Then in a low voice full of pride he continues, “He is my son. My children study in my school”.

This is the biggest challenge that we face in our schools.  How to convert the “sarkari” school into “my school”, into “our school”.   We, the citizens, are not beneficiaries.  We are the funders and the owners of the school.  And we must behave as such.  Only when something belongs to me, do I care. Only when it is mine, do I engage. If I realize that it is my money that funds the school, then I will watch carefully to see how it is being spent and what my children get out of it.  Ownership is the key to engagement; holding others responsible or accountable comes later. It is only then that we will be able to give our children the education they deserve.


[1] Director ASER Centre and Director, North India Programs, Pratham

What is PAISA – Contextualizing PAISA

Since 2004, India’s education budget has more than doubled, increasing from Rs. 83,564 crore in 2004-05 to Rs. 1,91,946 crore in 2009-10. About 50% of this budget has been spent on elementary education. For the same period, ASER has been tracking learning outcomes to find that learning levels have remained depressingly stagnant. Nearly half the children in standard 5 are still unable to read a standard 2 text. This problem is not unique to education. Almost every social sector program in India suffers the same fate. What explains this status quo? Why have increased outlays failed to translate in to improved outcomes?

The crux of the problem is well known – India’s delivery systems are writ large with administrative inefficiencies that make accountability for outcomes near impossible.  The result: a system with high implementation costs and serious leakages so much so that only a small fraction of development monies reach their intended beneficiary.

Despite widespread recognition of the problem, there is surprisingly little empirical data and analysis on the specific processes by which outlays translate in to action on the ground. Very little is known in the public domain about planning processes and mechanisms through which expenditure priorities are determined – particularly at the district level. Following on from this, information on fund flows- the processes through which monies flow through the system and arrive at their final destinations – is scarce and perhaps even harder to get to than an analysis of planning process (for a detailed analysis of the difficulties with accessing information see last year’s PAISA report).  Curiously, this information is hard to access not just for citizens but also for policy makers and decision makers within the system. And so, plans are made without adequate data and consideration of local realities, needs and priorities. Consequently, we have a delivery system where annual plans are poorly designed, expenditure priorities are not grounded in local needs and inefficiencies of one year simply translate on to the next.

A second consequence of this lack of information and data is that parents, who are often part of local committees tasked with managing funds, making plans and monitoring the day to day functioning of service providers, are unable to engage effectively, identify expenditure priorities and demand accountability from schools. Moreover, the absence of data and information also creates disincentives for participation and a lack of ownership further compromising accountability for outcomes.

The PAISA exercise is located in this larger framework of outlays and outcomes. It is an effort to use information on expenditures as a starting point to engage citizens and policy makers with data on processes such as fund flows and on the ground expenditures which can be leveraged to improve the planning process. In its essence PAISA is an exercise that tries to connect the micro (local level implementation) with the macro (national level resource allocation decisions).

PAISA’s current focus is on elementary education. Tracking school grants (through reports like this one) is the first step. Our objective is to create a data bank on how monies flow through the system with a view to a) highlighting inefficiencies and bottlenecks for macro level policy makers to take cognizance of b) sharing information on school level expenditures on the ground with parents and frontline service providers to encourage a process of effective planning and engagement at the school level.

Over time, PAISA aims to track fund flow and decision making process all the way from the school to the district (where annual work plans are made) to develop a broader understanding and data base of what happens once a program hits the ground. The overarching aim of this work is to encourage greater transparency in governance processes particularly financing and planning and thereby strengthen the delivery system. But most of all, it hopes that by providing data and building capacity amongst citizens and frontline service providers to use PAISA and like tools to regularly collect such data, PAISA can begin a process of strengthening greater leadership and innovation on the ground. Through this PAISA hopes to plant the seeds for creating a delivery system that is bottom up, grounded in innovation and truly reflective of people’s needs and priorities. It is PAISA’s hypothesis that such a system holds the key to improved outcomes for service delivery.

A final note on where PAISA stands today. In 2010, PAISA underwent a significant expansion.  Apart from the annual PAISA report prepared in conjunction with the ASER process, PAISA is now undertaking in-depth tracking exercises in 10 districts spread across 7 states in the country. These tracking exercises will enable a far more detailed analysis (one that is not feasible in a national survey at the scale of ASER) of fund flows and school level processes. Importantly, in these districts our focus is not just on SSA but also on state level schemes (the extended tool is available in an annexure in this report). The effort is to develop tools and a data base of fund flows, institutional processes and decision making structures at the block and district level. As we proceed, we hope to extend our mandate in these districts beyond education to other key social sector schemes. Apart from tool development and data collection, PAISA is undertaking an experimental effort to leverage its data bank on fund flows to strengthen planning process. The School Management Committee is the first level at which this work is being undertaken. Lastly, we are working to build a network of people that can use PAISA tools and engage with the questions of process and implementation of government programs. To this end, PAISA is developing a capacity building course. The course is currently being administered with the PAISA Associates. This course is PAISA’s small way of creating a movement of informed citizens and policy makers demanding accountability for improved services.


[1] Director, Accountability Initiative, CPR