Do informed citizens hold governments accountable? It depends…

A lot is said about how increased information in the public domain would lead to greater accountability. Community radio, internet, community video etc are all touted to be powerful solutions to increased accountability.

But is this really true? Research into the impact of community radio on Benin’s education system has come up with some surrpising results. The researchers found that advertising about education services on community radio did not necessarily lead to higher government accountability. It led to higher literacy rates for sure, but not in government schools! People instead started investing more private resources to educate their children.

This lack of effect is not uniform across the board. The mass media in India and US have in contrast led to greater public participation in demanding government accountability. Where lies the difference? And how can we ensure that information campaigns lead to greater government accountability?


Budget briefs – 2011

The Accountability Initiative, Centre for Policy Research is pleased to launch its Budget Briefs Series 2011.

The 8 briefs in this series examine trends in social sector allocations and expenditures. 2 briefs have already been published. These are the ones on National Rural Health Mission and Sarva Shiksha Abhiyan. 6 more are in the offing, which we would be publishing over the course of this week. These include the ones on Food Subsidy, Mid-day Meal Scheme, Mahatama Gandhi National Rual Employment Guarantee Act, Pradhan Mantri Gram Sadak Yojna, Total Sanitation Campaign and ICDS.

Corruption as a wicked problem?

The Indian polity is increasingly being exposed to corruption and other breaches of accountability. As Yamini had pointed out in an earlier blog, there is an increased public clamour for institutional reform, public accountability and reduction of corruption.

In this blog post, I argue that corruption as well as ensuring accountability in an organization and a nation, are “wicked problems” and the first step to solving a “wicked problem” is to recognize its “wickedness” and use the corresponding problem-solving techniques. Not recognizing this fact would lead to inefficient solutions at the best, and counterproductive solutions at the worst.

At this point let me clarify what I mean by wicked. I am not using it in the sense of being evil, but rather as a problem which is very resistant to solution. This terminology was originally proposed by H. W. J. Rittel and M. M. Webber, both urban planners at the University of California, Berkeley, USA in 1973.

In a landmark article, the authors observed that there is a whole realm of social planning problems that cannot be successfully treated with traditional linear, analytical approaches. They called these issues wicked problems and contrasted them with ‘tame’ problems. Tame problems are not necessarily simple—they can be very technically complex—but the problem can be tightly defined and a solution fairly readily identified or worked through.

Some of the famous problems identified as wicked problems over the years are “Climate change”, “Obesity etc”. I will explain how corruption also shows almost all the characteristics of wicked problems.

Wicked problems are difficult to clearly define – The nature and extent of problem depends on who has been asked. In the case of corruption and accountability, this paper talks about the great definition debate of corruption. The author has talked about various failed attempt at developing a universal definition of corruption. For example, there’s been a raging debate between public-office, market- and public-interest-centered definitions.

Wicked problems are often not stable : In the case of corruption, in addition to being subject to unclear definitions, the definition of corruption has also evolved over time. For example, what might be considered perfectly acceptable behavior today may be considered corrupt tomorrow. The earlier corruption-academicians like Leff 1964, Bayley 1966 etc considered corruption to be a necessary part of adjustment for developing democracies. Leff even argued that corruption could be promote efficiency. This view of corruption was challenged by a new generation of scholars such as Anne Krueger and Susan-Rose-Ackerman who recast corruption as an individual choice.

Some wicked problems are characterised by chronic policy failure – Corruption as a problem has been around since time immemorial. The Arthashastra talks about it, the Roman & Greek empires talk about it. In fact, corruption was enough of a problem in the Athenian democracy that an investigatory institution, the Council of Areopagus, had as one of its duties the reporting of corrupt behavior. However, it still remains as burning an issue now, as it was before

Wicked problems have many interdependencies and often multi-causal – There are also internally conflicting goals or objectives within the broader wicked problem. For example, some scholars have viewed corruption as oiling the wheels of democracy and thus found reducing it detrimental to a nation, while others have viewed corruption as grit in the wheels of an organization.

Wicked problems usually have no clear solution : There is no magic bullet solution which has come out of all the research on corruption. In India itself, computerization of records has helped in reducing corruption in some places, while in others people have found ways to circumvent it. In some places, 0 Rs notes have been able to shame corrupt officials into not taking bribes, while in others it is laughed away. In some places, social audits have helped in reducing corruption, while in others it has been subject to a lot of political pressure.

Wicked problems hardly ever sit conveniently within the responsibility of any one organisation : For example, if we have to reduce corruption in the PDS system, it would involve the local governments at all levels, the fair price shops, the consumers etc. Wicked problems are thus socially complex

Wicked problems involve changing behaviour : Corruption involves changing the behavior of some if not all citizens of a country or the world. It involves a behavioral change in the bribe-giver and the receiver. It involves a change in the politician who grants favors and the citizens who asks for it. It involves a change in the cousin who uses his relatives influence to get things done, and also involves change in the relatives behavior who does not condone such behavior.

Attempts to address wicked problems often lead to unforeseen consequences : I couldn’t find any papers to substantiate this as yet.


Now that it seems that corruption is a wicked problem, what next? Are there any processes developed for tackling wicked problems. Unfortunately no. Wicked problems is a developing field (it started in the 1970’s) and tackling them is an evolving art. Most solutions involve a collaborative approach and so the focus has been to develop mechanisms which would foster collaborative and fruitful dialogue. Other authoritative and competitive approaches have also been advocated, but most literature on wicked problems advocate a collaborative approach.

My next blog post would talk about how our current way of formulating public policy is not the best way to solve wicked problems and how Accountability Initiative of monitoring and responding may be a better way to develop policy. I will also in a later blog post talk about how technology can be used to facilitate solving the wicked problem of corruption

Undermining Institutions

The United Progressive Alliance’s (UPA) response to the crisis caused by the 2 G scam is monumentally shortsighted and runs the risk of losing what could well be a real opportunity for restoring institutional credibility and creating effective systems of accountability in our governance structures.Let’s look at the most recent of events. In the last few weeks the Telecom Minister, Kapil Sibal and the Comptroller Auditor General (CAG) have locked horns over the findings of the CAG report on the allocation of 2 G Licenses. The Telecom Ministry is arguing that the report – especially in its calculations of the estimated loss to the government – is fraught with ‘serious errors.’ In a television interview, Mr. Sibal also suggested that someone in the CAG was responsible for the leaks that preceded the tabling of the report in Parliament. Most commentators agree that question of the magnitude of the loss is open to debate. And there is little doubt that a report being leaked is a matter of serious concern. But this on-going battle between the government and the CAG points to a much bigger set of issues that must be debated.

First and foremost, in critiquing the CAG report, the government has significantly undermined the constitutional authority of the institution of the CAG.  As the supreme audit institution of India, the CAG is constitutionally mandated to act as a watch dog and ensure accountability and transparency in government finances. The constitution accords the CAG a great degree of autonomy so as to free the institution from political pressures. The CAG can only be removed by the same process as that of a Supreme Court judge. CAG reports are submitted to the Public Accounts Committee (PAC) of Parliament that scrutinizes these reports and follow up on action taken by ministries. In challenging the findings of the CAG report and questioning its conduct in the 2 G case, the government has made the CAG vulnerable to political manipulation and attack of its formal powers. This is ironic especially given that the government has put its political weight behind the PAC whose investigation into the 2 G scam is based on the very CAG report that the government is seeking to debunk!

But perhaps what is most worrying is that this critique of the CAG comes at a time when most of our institutions are facing a crisis of credibility. Whether it’s the judiciary, the CBI, the Information Commission or the CVC, these institutions are seen to be  steeped in inefficiency and corruption and public trust has hit an all time low. By attacking the credibility of the CAG, perhaps the last of our public institutions to command public respect, the government has displayed monumental short sightedness.  After all, if the CAG cannot ensure financial probity, who can?

In undermining the CAG, the UPA is also losing what could have been a historical opportunity to restore institutional probity. If there is one positive outcome of the current crisis it is the increased public clamour for institutional reform and public accountability. Responding to this pressure, the UPA has even come up with a menu of reform solutions ranging from the creation of new agencies to checking discretionary powers and state funding of elections. But these solutions simply miss the point. What we need are not new agencies or procedures. After all, the constitution already provides us with an array of institutional checks and balances. What we need is a real commitment to strengthen the day to day functioning of these institutions and ensuring that they are embedded in norms of accountability and transparency. Rather than resort to a battle of wits to score political points and challenge institutional credibility the UPA could well have chosen to set an example by accepting responsibility and submitting itself to a transparent investigation. But then, perhaps there would have been no crisis!

Yamini Aiyar is Director of the Accountability Initiative.


The Scheme-ing behind Government Schemes

With the plethora of schemes doing the rounds, wouldn’t it be simpler if we could refer to the whole enterprise of making schemes as “scheme-ing”. Consider this –  the enviable act of making schemes could be termed scheme-ing, the people who engage in scheme-ing and those with the covetous role of implementing the schemes could be jointly consecrated as scheme-ers, while the people with the not so desirable task of analyzing schemes could be labelled scheme analysts.  Sounds about right?  I shall assume you agree with me and hasten forward to share some real life examples of how it all pans out in practice.

Last week a colleague and I sat down to do some ‘scheme analysis’, of  the Prime Ministers New 15 Point Programme. The scheme-ing of the scheme as the name suggests was done by the Central Government in response to the Sachar Committee Report ,  which pointed out that despite the various programmes, minorities continue to lag behind the general population on most indicators. Those enjoined as the scheme-ers of the plan were the state and district administrations who as per the plan were required to, 1) make a Multi Sectoral Plan Development Plan (MSDP) in minority concentrated districts (MCD’s) to improve the status of minorities and bring them at par with the national average, 2) Earmark 15% of total outlays in central government schemes for minorities and locate a certain proportion of projects in minority concentrated districts (MCD’s).

In a nutshell then; a report is released, the government responds with alacrity and a new scheme is born, which seems to (at least in theory) address the problem.  Sounds fairly simple? As keen ‘scheme analysts’ however we were not to be dissuaded so easily,  we were convinced scheme-ing was a more complicated exercise. The scheme-ers of the fifteen point programme were also of the same opinion. In their attempt to ensure that the programme remain a pan Indian exercise rather than specifically target minorities, the guidelines of the MSDP specify that interventions proposed under the plan should be limited to only those which are infrastructure oriented. Thus in a certain sense, the MSDP attempted to address the development deficits of minorities which are not being met through existing programmes, by proposing infrastructure projects which apply to the population as a whole rather than adopting a targeted approach.

Having discovered the first caveat, we probed further and tried to understand how the programme had been implemented at the ground level and whether it had been successful in achieving its desired impact. Time constraints however impelled us to analyze the plan in only one district- Darbhanga in Bihar and focus our analysis on one particular sector- elementary education.  After spending several days, gleaning through two reports, the Annual work plan of Sarva Shiksha Abhiyan (SSA) and MSDP of Darbhanga District we discovered that the scheme which had been introduced to address minority specific concerns was riddled with several limitations, principal amongst these were:

a) Lack of effective targeting of minorities: Muslim girls appear to benefit less from hostel facilities (Kasturba Gandhi Balika Vidyalay (KGBV’s) in comparison to girls from SC and ST backgrounds.  In 2009-10, the total enrolment in KGBV’s in the district was 1370, of which SC’s account for 602 (44%), while the representation of ST’s was 404 (29%) and that of Muslims was as low as 364 (27%).

b) Inability to match interventions with needs on the ground: The MSDP identifies lack of infrastructure facilities in schools as one of the primary reasons contributing towards high rates of drop outs. In response to this issue, the annual work plan proposes the construction of new primary school building and construction of additional classrooms. Such proposals however appear to be incommensurate with needs at the ground level on two counts. One, amongst the various infrastructure facilities missing in schools the plan prioritizes the construction of a school building which is lacking only in 12% of primary schools as opposed to facilities such as toilets and boundary wall which are missing in a larger number of schools. Second, though the plan does not specify the kinds of facilities which are insufficient and are contributing to children dropping out of school, it nevertheless prioritizes two types of interventions which in the absence of such information may be disproportionate.

c) Ineffective achievement in physical/ financial targets: Despite this excessive focus on infrastructure to address minority specific deficits, progress on the ground, even towards fulfilling these targets is slow. Out of the total approved outlay of Rs 706 lakh for establishing KGBV’s in Darbhanga district for 2009-10, only 28% of the funds were utilized as on 31st January 2010. The physical target for the construction of new Madras’s for financial year 2009-10 in Darbhanga was 5,942 and financial target was Rs. 91.21 lakh. Till January 31st 2010, neither the physical nor financial targets were achieved. Measures to provide teaching Urdu is another example. In Darbhanga district however, while a total of 1214 Urdu teachers were sanctioned till 2006, only 855 (equivalent to 70% of the target) were appointed till 2006. In 2008-09, of the sanctioned 527 post, only 52 Urdu teachers were appointed (10%). Since 2008, no new teachers have been recruited.

In conclusion then, scheme-ing is a confounding exercise for both the schemer-s and scheme analysts. Schemes such as the new fifteen point programme try to solve the problem by means which they themselves recognize is the cause of the problem in the first instance.

 Gayatri Sahgal is a Research Analyst with the Accountability Initiative.


Breaking out of the Input Trap


The recently released Annual Survey of Education Report 2010 serves as an important reminder of India’s greatest challenge – converting increased financial outlays to improved development outcomes.  Since 2004, India’s education budget has more than doubled, increasing from Rs 152,947 crore in 2004-05 to Rs. 372,813 crore in 2009-10. For the same period, ASER has been tracking learning outcomes to find that learning levels have remained depressingly stagnant. Nearly half the children in standard 5 are still unable to read a standard 2 text. This outcome failure is not unique to education nearly every social sector suffers the same fate.

What explains the status quo? The crux of the problem is well known: service delivery is governed by an incentive structure that privileges inputs – infrastructure creation – over quality and performance on actual outcomes. This input emphasis has created a target driven, rule-book governed bureaucratic culture where quality problems are invariably reduced to input deficits addressed through guideline driven expenditures. Consequently, government infrastructure is simply not geared to deal with the more complex task of actually delivering services and ensuring a minimum qualiy: making sure infrastructure is maintained and operational; trained staff are motivated and present.  So deep is this problem that not only do regular investments fail to yield results, but well meaning reform efforts to improve quality also flounder.


Take the instance of the National Rural Health Mission (NRHM). To improve health services, the scheme introduced a system for providing discretionary funds to district societies. The objective is to incentivize local innovation and ensure that spending matches local needs. To facilitate expenditures the rule-book offers a ‘suggested’ list of activities on which money can be spent. A recent evaluation by the Planning Commission looked at the use of these funds in Bihar Rajasthan and Uttar Pradesh and tells a depressing story. The study found that funds when spent usually go towards fulfilling infrastructure needs at the health facilities. But more interestingly it also found that officials and society members expressed a clear preference for using funds for suggested items in the rules rather than exercising their discretion.


The Nirmal Gram Puruskar (NGP) is another example. Launched in 2003, the NGP is an incentive scheme that offers a reward of up to 50 Lakhs for Panchayats that have achieved total sanitation. The NGP is a sincere effort by the government to move away from the earlier target driven sanitation policy that emphasized building toilets – which were rarely used for its intended purpose – to one that focuses on changing people’s behavior toward toilet use through local government innovation, awareness raising and generating demand for better sanitary facilities in rural areas.  In its early years, NGP managed to achieve some success but the program did not invest in building capacity and motivating implementation officials.  As a result, the input approach has crept right back in. While there is no serious research, anecdotal evidence indicates that officers are driven by incentives to win awards rather than create sustained behavior change and an increasing number of Panchayats have not been able to maintain their total sanitation status.


So, how do we break the input trap to ensure improved outcomes from increased outlays? This is a difficult question to answer. If international experience is anything to go by, service delivery systems in most countries are locked in the input trap. But there is some good news. Going back to elementary education, this year’s ASER report highlights the case of Punjab, which has seen significant improvements in learning outcomes. This was a result of strong leadership that chose to break the input trap by focusing on learning goals and experimenting with changes in pedagogy. One simple innovation was to group children according to their ability levels. Punjab focused on fostering leadership amongst teachers thereby addressing the input problem.


Bihar too has experimented with, amongst other things, improving access to teaching materials. In 2008 the government launched a Rs. 30 crore campaign for schools to buy text books over a two month period. With political weight behind the program, a traditionally slow bureaucracy managed to get money flowing at lightning speed and books were bought within two months. Hyderabad city’s district administration is yet another example. The administration is trying to improve education by strengthening parent teacher interaction by mobilizing school management committees to make school development plans. Motivating frontline officials to work with the committees is critical to this effort.


These experiences show that it is possible to break the input trap. Punjab and Bihar show that change is most effective when state governments take ownership and are willing to innovate and experiment. Ironically, the current architecture of service delivery is dominated by schemes that are centrally funded, centrally designed and controlled which creates disincentives to achieve this. Moving away from such a system to one where states are incentivized to take leadership and produce innovation is critical. But above all, these experiments demonstrate the importance of investing in building local leadership at the district, block and community level. As the NRHM and NGP experience shows, the success of a program depends on local providers, their motivations and incentives. The guideline culture will only be broken when service providers are encouraged to take leadership, to ask questions and to act autonomously.


To ensure quality, increasing local autonomy needs to go hand in hand  with regular performance monitoring and reporting on outcomes. This is how accountability for outcomes is ensured. Credible and easily accessible performance indicators both generates public pressure for action on outcomes but also enables providers to see the results of their choices and thus encourage innovation. For years now the government of India has promised outcome monitoring from the outcomes budget in 2005 to the Presidential speech in 2009 when the UPA promised to set up an independent evaluation office and prepare annual reports on social sector performance. But these promises remain unfulfilled fulfilled.  Rather than investing in new input driven efforts, the UPA would do well the focus its energies on fulfilling these promises, only then will outlays translate into outcomes.


Yamini Aiyar is the Director of the Accountability Initiative. This article was published in the Indian Express on 31 January 2011. Click here to read the Express article.

All too many School Inspectors saying “all is well”?


Teacher absenteeism has been documented to be widespread and while the motivational reasons and drivers of this are complex (Ramachandran et al, 2005; Kremer et al., 2004), one factor that has permitted this is weak supervision or absence of inspections. Monitoring providers of services to hold them accountable is an important part of any service delivery system. Governments have acknowledged this and inspections have been taken particularly seriously by the government primary education system of Madhya Pradesh (MP) I recently visited (and more generally across states by the centrally sponsored Sarva Shiksha Abhiyan scheme). Has it worked? On paper at least, it has. Assigned to undertake inspections of teachers in schools within a district are the following list of officials in MP: the Cluster Academic Coordinator (CAC or Jan Shikshak), the principal of the Higher Secondary School who functions as Cluster Drawing-Disbursing Officer (DDO), the Block Education Officer (BEO), Block Academic Coordinator (BAC), Block Resource Centre Coordinator (BRCC), Assistant Project Coordinator (APC) at the district-level, District-Project Coordinator (DPC), District Education Officer (DEO) and his Assistant, the Joint Director (JD) as well as the CEO Block and CEO District from within the Rural Development Department. Considering that there are usually 3 BACs in any BRC Office, 4-5 APCs at the DPC Office and several more CACs, the number of officials functioning as inspectors at any block or district are consequently many more. Do teachers however feel that they are functioning in an Inspector Raj system? Thankfully for them at least, this is not necessarily the case.

The reason is that in practice not all officials are able to meet their inspection targets or make the time available for travel to undertake inspections at the cost of other work they are also tasked to undertake. For, of the list of officials mentioned, much fewer of them (CAC, BAC, BRCC) are in fact tasked principally with the inspection responsibility. The challenge then is not that inspectors do not exist or have not been assigned duties with clear formats; rather the challenge is inadequate implementation of inspectorial duties. The obvious question that then comes to mind is this: who inspects the inspectors?

There was for a long time a single vertical structure that made answering this question somewhat easier. From the Zila Shiksha Basic Adhikari to the Sub-Deputy Inspectors of Schools, each district used to have one line reporting structure. With the District Primary Education Programme (DPEP) of the 1990s that was scaled up to the Sarva Shiksha Abhiyan (SSA), a separate vertical of contractual posts was also created that covered monitoring functions.

Parallel to the existing administrative system in the state, this implementation of the now decade-old SSA has consequently created a separate management structure engaged in supervisory activities as well. Drawing attention to this two-dimensional system currently present, the recent Anil Bordia Committee has proposed integration of educational administration at different levels. This same report notes that during the last few decades “school supervision has grievously suffered due to insufficiency of staff and administrative neglect”. While acknowledging that the SSA may have “improved matters”, it still concluded that “the situation has remained essentially unchanged” and more damningly that “the functioning of schools has deteriorated and quality of the teaching-learning process has shown no improvement” (Bordia Committee Report, p.83). The solution suggested: better supervision and more periodic inspections.

In MP recently to develop a PAISA Tool for institutional analysis, I found in fact three vertical structures existing. Why does this adversely effect inspections? To illustrate: if the present full-time inspector in the Jan Shikshak (CAC) finds an incidence of teacher absence in a school, this is reported to the BRCC, which moves further up the same vertical to the DPC, who then reports this absenteeism to the DEO in a different vertical. But in order for any action on the concerned teacher, the DEO must report the same to the District CEO from yet a separate vertical (Rural Development Line Department), who is the designated appointing authority of the teacher and the only official with the powers to terminate the appointment. The length of steps to reach the appointing authority translates into a time lag between an inspection and any action. This may be further delayed because the CEO orders his own inspection or simply because he is in-charge of 21 divisions with Education being only one of these. Secondly, the Jan Shikshak can draw his pay from the BRCC by reporting “all is well” from all his required quota of inspections, which is an incentive that also drives the BRCC to report “all is well” as he too has 30 inspections to complete in a month alongside attending mandatory official meetings and other work to draw his pay. The “all is well” mantra popularized by a recent Bollywood film therefore keeps everyone in the system happy, from the Jan Shikshak and BRCC to the teacher and anganwadi worker in this collusion.

Interestingly, a way to bring better accountability to the inspections of the Jan Shikshak is not to wholly change the current arrangements, but to modify it in important ways. At present, officials in different verticals do not hold the other accountable to the extent they potentially can. The Sankul Pracharya is the Principal of a Higher Secondary School who is the Drawing & Disbursing Officer paying teacher salaries for a designated number of 7-8 schools in the area. He falls under the Line Education Department vertical. Currently no rule states that the Jan Shikshak (a SSA vertical officer) must a priori inform the Sankul Pracharya of his inspection schedule of the schools in his purview so that the latter can hold the former accountable for having undertaken them. Nor is the Jan Shikshak also reporting his inspection findings to the Sankul Pracharya, who can then use the report to cut the wages of absent teachers, which he is authorized to carry out with evidence. If the BRCC (also a SSA vertical officer)was further required to have a mandatory countersign of the Sankul Pracharya as a precondition for releasing pay to the Jan Shikshak, there is a further built-in “triangulating” accountability measure of the inspections having been undertaken as planned and the information shared for necessary immediate action on absent teachers through docking wages. The BRCC can then even hold the Sankul Pracharya accountable.

Triangulating Reporting for Better Accountability


The lesson I took away from MP is that rather than creating more inspectors higher up the vertical who find themselves too busy with routine other work to travel for inspections, there is a case to be made for many more Jan Shikshaks. Unlike the present system, their sanctioned numbers at the block-level should be determined by a fixed ratio to the density of schools in the area to be monitored. We need more full-time inspectors who are held more accountable for their work.

Finally, can the inspector of inspectors also be at times from outside of the government system? The 1954 ‘Report of the Committee on the Relationship between State Governments and Local Bodies in the Administration of Primary Education’ was categorical that “all inspecting officers should be directly under the government and that the Local bodies should have no control over them” (1954 Report, paragraph 61). In the changed circumstances of today when we have an active Rights-based movement and the 74th Constitutional Amendment, it will be interesting to see whether in practice envisaged local bodies such as the School Management Committees will be empowered to hold inspectors accountable. Or would the Committee Members of the 1954 Report, if still alive, have not much change to worry about.

Shomikho Raha is Lead, Implementation Research at the Accountability Initiative.

Unpacking India’s Education Budget: PAISA 2010


India’s education budget more than doubled in the last five years increasing from Rs. 152,847 crores in FY 2004-05 to Rs. 372,813 crores in FY 2009-10. An estimated 45 percent (figures for FY 2008-09) of education expenditures are now dedicated to elementary education. However, close scrutiny of India’s education system reveals a sobering truth – that this large investment has been spent poorly. And as the ASER report reminds us year after year, increased investments have failed to improve education outcomes. Despite significant financial investments, India’s education system is in fact, as characterized rather aptly by economist Lant Pritchett, in a ‘big Stuck’. What explains this ‘Stuck’? and how do we reverse this trend? To answer this question we need to understand the processes through which increased investments translate in to action. Critical to this are the links between plans, allocations and expenditures: how are resources allocated to states? What are the links between allocations and plans? How do funds flow through the system to arrive at their final destination? What are the links between school needs and increased expenditures?

To answer these questions, for the last two years, ASER has been implementing PAISA (an effort to track school level funds in partnership with Accountability Initiative and NIPFP). This year, PAISA undertook a macro level analysis of school finances and linked it, through the ASER-PAISA survey, to fund flows and decision making at the elementary school level. Preliminary analysis suggests that the links between allocations, plans and expenditures are seriously damaged. This is evidenced in three ways 1) States that have seen the highest increases in investments in recent years are also the poorest spenders. 2) Funds flows are extremely slow breaking the link between planning and expenditures and 3) There is no clear correlation between school needs and increased expenditure indicating that the links between school needs, plans, allocation and expenditures are weak. Below are some of the highlights of this analysis:

Allocation Trends: The Government of India’s (GOI) primary vehicle for the delivering elementary education is the Sarva Shiksha Abhiyaan (a centrally sponsored scheme that has been in operation since 2001). Reflecting the overall trend of increased investment, the Sarva Shiksha Abhiyaan (SSA) budget too has increased significantly in the last few years from Rs.7,156 crores in 2005-06 to Rs.15,000 crores in 2010-11. This overall increase has been distributed unevenly across the country with a greater share of resources going to the lagging states indicating a clear link between resource allocations and perceived school needs. GOI’s SSA share for Bihar has nearly doubled in the last four years from Rs. 2,414 crore in FY 2006-07 to Rs. 4,295 crores in 2009-10. Rajasthan’s budget increased from Rs. 1,253 crores to Rs. 2241 crores and West Bengal’s from Rs. 1,465 crores to Rs. 2,194 crores.

An important aside: Despite significant increases in GOI investments in education, state governments contribute the major share of India’s education budget. In FY 2009-10, state government budgets amounted to 74 percent of the total education budget for India. State government investment too has seen a dramatic increase in recent year. Uttar Pradesh, Bihar, Rajasthan and Andhra Pradesh, State governments nearly doubled their share of the elementary education budget between 2006-07 and 2009-10, while Jharkhand has seen a three-fold increase in the same period. Interestingly, Uttar Pradesh, saw the largest overall increase in its elementary education state budget from Rs. 6,439 crores in 2006-07 to Rs. 11,185 crores in 2009-10. This increase was far greater than GOI’s increased share for SSA.

Allocation trends and expenditure efficiency: Countrywide, SSA expenditures have been fairly low – data from 2006-07 to 2008-09 shows that on average 30 percent funds remain unspent every year. This persistent gap in an overall environment of increased investments indicates that that links between planning, expenditure capacity and allocations are weak.

The problem is exacerbated at the state level. State level analysis highlights that there is no clear  correlation between increased investments and actual expenditures on the ground suggesting that the links between planning, allocations and absorption capacity are somewhat weak.

Bihar, which has received the highest increase in GOI SSA allocations, is also the poorest spender. In FY 2009-10, Bihar spent 51 percent of its allocated funds. Interestingly, these figures show a slight deterioration when compared with FY 2008-09 when Bihar spent 62 percent of its total allocations. West Bengal although significantly better than Bihar, spent 74 percent of its SSA allocations for FY 2009-10. West Bengal has shown some minor improvements over the last two years with a jump from 66 percent expenditures in FY 2008-09 to 74 percent for FY 2009-10. Rajasthan is the exception having spent 89 percent of its SSA allocations for the same period. Interestingly Rajasthan witnessed a small dip in its expenditure performance despite rising investments from last year when it reported an expenditure of 91 percent.

Links between plans and expenditure: For expenditures to be efficient and effective, they must be incurred in a manner that meets needs and priorities. This would imply that funds must arrive at their destinations on time to ensure that specific, time bound needs are met. Macro analysis of education expenditures suggests that this is not the case and in fact expenditures tend to be highest towards the end of the financial year.

Why does this occur? The PAISA survey in ASER suggests that the delayed expenditures are a consequence of delays in fund flows. And in fact the problem is acute at the school level.

The 2010 ASER report, analyzes grant receipts for primary schools across two financial years – 2008-09 and 2009-10. Since the survey is conducted in October-November and the financial year runs from April 1 to March 31st, schools were asked to provide information for one full financial year (the year preceding the survey) and one half of the financial year (the year during which the survey was being undertaken). Comparison of this half year and full year data enables analysis of timeliness of funds. Overall, the results indicate fund flows are extremely slow and money usually reaches schools at the end of the financial. These delays result in a mismatch between needs and expenditures. So, if a school needs funds to repair its blackboard at the start of the school year but maintenance money only arrives in December, the specific requirements of the school remain unfulfilled. Late arrival of funds also results in schools rushing to incur expenditures to meet reporting deadlines without giving adequate consideration to specific needs and plans. Consequently, funds get spent poorly and the link to plans is broken.

PAISA data suggests that inefficiencies do not affect allocation decisions. A detailed analysis of states with increased SSA investments tells an interesting story.  The good news first: states which have seen significant increases in education investment have also seen some improvements in fund flows. Notably, Bihar and Jharkhand have seen some improvement both in the timing of fund flows and in overall receipt of grants between 2008-09 and 2010-11. On the other hand, West Bengal and Rajasthan have shown improvements in overall receipt of grants between 2008-09 and 2009-10 but remain poor performers when it comes to ensuring timeliness of fund flows. Other States such as Uttar Pradesh, whose overall education budget has increased significantly performs poorly when it comes to timeliness of fund flows. And finally states like Chattisgarh and Uttarakhand seem to have performed far worse than the previous year when it comes to timeliness of fund flows.

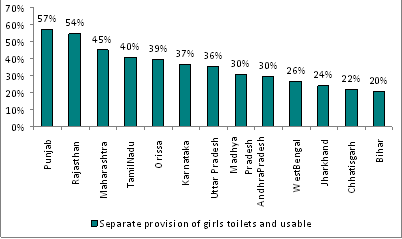
Links between increased investments and school needs: To the extent that more money is being pumped in to poorer states with a historically poor record in education, the links between increased investments and school needs seem strong. But closer scrutiny reveals that at the school level this is not necessarily the case. ASER 2010 collected data school infrastructure including toilet facilities and drinking water. When correlated with expenditures it seems that states with increased investment continue to have serious infrastructure deficits.  In Bihar a mere 37 percent schools had usable toilet facilities, West Bengal did somewhat better with 56 percent schools that had usable toilets and Rajasthan topped the list at 70 percent. Bihar does better on drinking water facilities with 79 percent schools reporting availability of usable drinking water facilities. Rajasthan and West Bengal reported 68 and 67 percent schools that had available usable drinking water facilities. This could mean either that the money available is simply not enough or that increased investments are not being directed at physical infrastructure.

Figure 1. Percentage of Schools Having Separate and Usable Girl’s Toilets

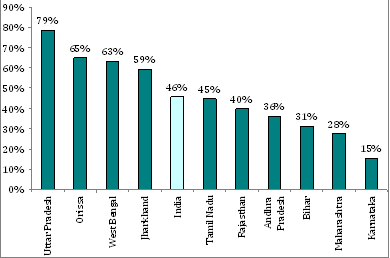
If physical infrastructure is not a priority are human resources the priority? Given that almost 80 percent of India’s education budget is tied to teacher wages, one could safely assume that a significant portion of the increased investment is going towards hiring teachers. ASER 2010 has collected data on pupil teacher ratios. When correlated with expenditure data we find interesting trends about state expenditure priorities. Uttar Pradesh, which has seen a large increase in financial investments (and some improvements in infrastructure) also has a very high Pupil teacher ratio with 79 percent schools reporting more than current norms of 1 teacher to 30 students. Interestingly, Uttar Pradesh has also had a drop in enrolment numbers from 22,508,818 in 2007 to 21,487,653.  But Uttar Pradesh performs better than Bihar on infrastructure facilities – 49 percent schools have usable toilets compared with Bihar’s 37. 82 schools have drinking water facilities compared with Rajasthan’s 68 and West Bengal’s 67 percent. Perhaps then, one can infer that Uttar Pradesh has prioritized infrastructure over human resources even though human resources are a critical gap.


Figure 2 Percentage of Schools with PTR above the RTE Norm 

Bihar on the other hand does relatively better on this count with 30 percent schools reported having more students than teachers as prescribed under the norms. This suggests that Bihar has been using its increased investments to hire teachers a fact verified by recent data which shows that Bihar hired 2.5 lakh teachers since 2007.

So what have we learnt? Clearly the links between. the links between planning, allocations, schools needs and expenditures are damaged weak resulting in the Big Stuck. With India’s schooling system now entering a new phase of implementation under the Right to Education Act (RTE) the current financial architecture needs a serious rethink. Strengthening the annual planning process could be the first step. In January every year every district is supposed to make an annual plan based on school development plans made with parental participation. Concentrating on strengthening this process could not only strengthen links between school needs, plans and allocations but also ensure greater citizen involvement.  It is only when citizens get involved and demand accountability for increased investments that outlays will translate to outcomes.

Yamini Aiyar and Avani Kapur are with the Accountability Initiative, Centre for Policy Research. Anit Mukherjee is with the National Institute of Public Finance and Policy.

Education Survey Shows RTE Has a Long Way To Go

The Annual Survey of Education Report (ASER) 2010 report was launched by Vice President, Hamid Ansari on 14 January 2011 in New Delhi. Conducted every year since 2005, ASER is the largest annual survey of children in rural India. Facilitated by Pratham, ASER is conducted each year by local organizations and concerned citizens. In 2010, ASER reached 522 districts, over 14,000 villages, 3,00,000 households and almost 7,00,000 children. Every year, ASER finds out whether children in rural India go to school, how well they can read in their own language and whether they can do basic arithmetic. ASER 2010 also included a visit to over 13,000 government schools to assess compliance with those norms and standards specified in the Right to Education Act that are easy to measure.

The key findings of this year’s reports are as follows:

  • Enrollment: In 2010, ASER found that 96.5% of children in the 6 to 14 age group in rural India are enrolled in school.
  • Out of school girls: 5.9% of girls in the 11-14 age group are still out of school. However, this percentage has gone down as compared to 6.8% in 2009.
  • Rise in private school enrolment: Enrollment in private schools in rural India increased from 21.8% in 2009 to 24.3% in 2010. This number has risen steadily since 2005 when it was 16.3% nationally.
  • Increasing numbers of five year olds enrolled in school: Nationally, the percentage of five year olds enrolled in schools increased from 54.6% in 2009 to 62.8% in 2010.
  • Nationally, not much change in reading ability, except in some states: Even after five years in school, close to half of all children are not even at the level expected of them after two years in school.
  • Math ability shows a declining trend: On average, there has been a decrease in children’s ability to do simple mathematics. The proportion of Std I children who could recognize numbers from 1-9 declined from 69.3% in 2009 to 65.8% in 2010.
  • RTE compliance: ASER 2010 found that over 60% of the 13,000 schools visited satisfied the infrastructure norms specified by the RTE. However, more than half of these schools will need more teachers. A third will need more classrooms. The all India percentage of primary schools (Std 1-4/5) with all teachers present on the day of the visit shows a consistent decrease over three years, falling from 73.7% in 2007 to 69.2% in 2009 and 63.4% in 2010.
    For rural India as a whole, children’s attendance shows no change over the period 2007- 2010. Attendance remained at around 73% during this period. But there is considerable variation across states.

For more information about the ASER Report 2010 click on the attachments below.


Surveys Assess the State of Global Freedom

A trio of major surveys assessing the state of civil, political and economic freedom across the world have recently been released.The 3 surveys are Freedom House’s “Freedom in the World 2010: Erosion of Freedom Intensifies“; Reporters without Borders’ “Press Freedom Index 2010“; and the Heritage Foundation’s “ The Link Between Economic Opportunity and Prosperity: The 2010 Index of Economic Freedom“.

Freedom in the World 2010”  is an annual survey conducted by Freedom House to assess political rights and civil liberties around the world. The report notes a steady decline in the state of global freedom. Freedom House has described 2009 as a year “marked by intensified repression against human rights defenders and democracy activists by many of the world’s most powerful authoritarian regimes, including Russia and China.”  In the “Press Freedom Index 2010,” while fourteen European states received very low rankings, twenty, led by Finland, Iceland, Netherlands, Norway, Sweden and Switzerland were singled out as “engines of press freedom.” The report states that traditional underperformers, such as Rwanda, Yemen, Syria, Burma, and North Korea, have all taken “harsher lines” against press freedoms over the last year as well.

The “2010 Index of Economic Freedom,” compiled by the Heritage Foundation, assesses the level of overall economic freedom in 183 countries by ranking ten dimensions including business freedom, trade freedom, fiscal freedom, government spending, monetary freedom, investment freedom, financial freedom, property rights, freedom from corruption and labor freedom. These dimensions measure factors which include regulatory barriers to doing business, regulatory efficiency, rule of law, levels of corruption, and economic openness. The 2010 Index ranks Hong Kong, Singapore, Australia, and New Zealand as first, second, third and fourth, respectively, in the world. Heritage found only seven global economies to be “free” with the United States dropping out of the group of free economies this year and Switzerland joining it.