

Dr. Karthik Muralidharan, Dr. M. Govinda Rao, and Mr. Ashish Dhawan, share their views in a panel moderated by Mr.Michael Walton at the launch of the annual PAISA report ‘Do Schools Get Their Money?’ (PAISA 2012)
Archives: Blog
Community participation and School functioning- Evidence from DRC Survey data
Community participation is deeply interwoven in the implementation of the The Right of Children to Free and Compulsory Education (RTE) Act, 2009. Every school has to have a School Management Committee (SMC) which consists of members from the local community and in theory; this SMC approves plans, signs cheques and monitors the school performance[1]. The SMC (and the local community as a whole) form an important part of the accountability chain as they supplement inspections by higher rung officials, with their regular monitoring. However, anecdotal evidence, based on my field visits, suggests that most teachers do not come to school regularly as parents and community members are not concerned about the school’s functioning. The only time the community approaches the school is to ask for entitlements or to check on Mid-day meals. In some of the cases that I encountered, the SMCs were largely non functional, with the Headmaster (HM) handling most of its affairs[2]. The SMC members stated that they were not aware of their roles and all they did was sign cheques. They wondered why they should concern themselves with anything further when they weren’t getting any monetary or physical incentive. This lack of community participation seemed to be hampering the school’s output by allowing teachers to neglect their duties.
Does data from the District Report Cards survey conducted in 2011 help further this argument? I used two variables (one on the functioning of SMCs and the other on community contributions) to test if more community participation leads to better school performance. In our survey, we had asked the HMs to tell us how often SMCs met. If we correlate the frequency of the SMC meetings with student and teacher attendance, we find that those schools where SMCs met very rarely (once in six months) had lower teacher attendance as compared to those which met more frequently (once in a month or once in two-three months). SMC meetings, however, did not appear to have an impact on student attendance. These results were observed even after controlling for district fixed effects and other variables like frequency of officials visiting the school, infrastructure etc. It appears to be the case that well functioning SMCs can help in monitoring teachers and increasing their attendance.
We had also asked the HMs whether the community contributed to the school and in what form (monetary, supervision, material or labour). We found that, overall, around 26% of schools had received some contribution from the community (in 2010-11). Do these contributions improve school functioning? The hypothesis here is that a community which contributes to the school would be more interested in its outcomes and thus we would see higher teacher and student attendance. However, there seemed to be no relation between these variables. To check if any specific type of contribution had an impact on school performance, these contributions were broken up into the type of contributions, we found that monetary and material contributions were correlated with higher student and teacher attendance, though these results were not robust after controlling for fixed effects and other variables. However, without details on the manner in which these contributions have been utilised, it is hard to ascertain the total extent of local level involvement. It would thus be interesting to see how a community interacts with the school when it makes contributions, are the monetary contributions just token amounts or are they used for actual learning/infrastructure purposes? Is the community actually interested in how their money is used?
There is ample literature on the importance of community participation on service delivery[3]. But, as we can see in the case of education, simply institutionalising community participation does not ensure that they will participate. In a control trial on Village Education Committees (VECs)[4] in Uttar Pradesh conducted in 2005-06, it was found that informing members of the community about their responsibilities and equipping them with ways to actually gauge the learning levels of their children, did not prove to be an incentive for greater participation. Engaging the community does not seem to be as simple as providing information[5]. As we saw from the anecdotal evidence, SMC members could not find any incentive to participate and it seems like information is not a sufficient condition to bring about a behavioural change[6].
Currently, most SMC trainings by states focus on equipping them with the necessary understanding of their roles and responsibilities. While, this is an important first step, it may not be enough to equip them to fully participate in the learning process. Considering the important role that the community has been given, it is essential that states continue to come up with innovative ways to develop the capability and capacity of the people to engage constructively.
[1] An earlier blog provides a summary of the roles and responsibilities of SMCs- http://www.accountabilityindia.in/accountabilityblog/2263-school-management-committees-smcs-guardian-institution-elementary-education-
[2] The annual meetings to discuss the implementation of the right to education at the state level repeatedly discuss this problem in their minutes. These minutes can be found here- http://www.ssa.nic.in/planning/pab-minutes/pab-minutes-2012-13
[3] Empowering local communities to monitor teachers and providing them with funds to hire local contract teachers was found to have a strong impact on learning levels in Kenya. The paper can be found here- http://www.nber.org/papers/w17939. Similarly, Community monitoring of health services in Uganda were found to be correlated with improved with improved health worker performance. This can be found here- http://www.cid.harvard.edu/neudc07/docs/neudc07_s2_p11_bjorkman.pdf.
[4] VECs were precursors to School Management Committees
[5] Interestingly, the researchers found that remedial classes by local volunteers had a positive impact on the learning levels. A community which is engaged and has the capacity to provide supplementary teaching post school hours could have a great impact on learning levels.
[6] Some other methods to improve SMC functioning are explored in earlier blogs, for example http://www.accountabilityindia.in/accountabilityblog/2522-empowering-school-management-committees-helping-smc-members-plan-better and http://www.accountabilityindia.in/accountabilityblog/2532-decentralised-education-delivery-do-gps-holds-lessons-smcs-part-1
Data in the dark
If government offices could exist virtually, they would be remarkably similar to government websites, waiting/loading time included. Most information is available but not easily accessible, like a cabinet full of files stacked somewhere.
Moreover, accessibility to government data does not ensure accuracy; in fact too much information can also lead to a misrepresentation of facts. This blog post seeks to highlight the various obstacles faced while researching Government of India (GOI) schemes purely using government data available online. For an insightful account of missing records in government offices, have a look at this AI post (Link).
According to the Open Data Foundation (Link), a data user should ideally be able to:
- Discover the existence of data.
- Access data for research and analysis.
- Find detailed information describing data and its production process.
- Effectively communicate with the agencies involved.
- Share knowledge with other users.
Ideally. In reality however, there are many impediments to cogent data analysis.
The Indian government has taken several steps towards providing accessible information online. Extensive official guidelines explain what GOI websites should look like[1](Link), some pointers even address problems we’ve encountered. There’s also an analytics page(Link) rating these websites on the basis of their user interface and accessibility (the Indian Navy website is ranked highest). However, whether GOI departments take heed to these suggestionsis debatable.
We can spot various issues in data while analysing schemes such as the Nirmal Bharat Abhiyan (NBA/TSC), Jannani Suraksha Yojana (JSY) and the Indira Awaas Yojana (IAY). Discrepancies are evident in their documents for Centre and State financial spending, physical achievements, State guidelines, Annual Action plans, Panchayat reports and question lists in the Houses of Parliament. This by no means covers the gamut of government data available online, it is simply a selection based on schemes we are currently interested in. Let us look at some of the problems faced while analysing government data.
Information Mismanagement: Data on government websites is not well organised.Basic documents such as ‘State guidelines for the implementation of the JSY’ are extremely hard to locate. It is unclear whether information exists at the Central or State level, on the Ministry of Health and Family Welfare’s website, or a specific National Rural Health Mission (NRHM) page, or even whether specific guidelines exist at all. Documents are not dated properly and oftentimes the fate of Recommendations is left to our imagination. Most documents are not published in machine-readable formats such as Excel or Word that are conducive to further use. They are usually in a non-editable PDF format, where some say,“data goes to die” (Link). After much metaphorical running around, one is still unsure about the information they have accumulated, largely due to data not being presented in a consistent and sequential manner.
Sometimes these websites provide so many permutations and combinations for viewing data that extracting the required information becomes quite challenging. Certain data heavy pages promise information that is still about 8 clicks away, which only leads to another new set of pages to examine. For example, while checking entries for toilets constructed since 2001, we looked at Panchayat-wise data on the NBA website (Link):
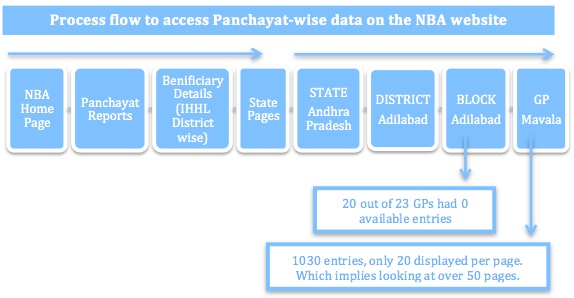
This ten-minute process is for one GP, in one Block, in one District, in one State. Even if we analyse GP entries for just one State, it takes over a week to collate.
One can argue that this is precisely why datasheets have been compiled on these websites: to gather and present data in one place, but when inconsistencies such as double counting appear, we have no choice but to check the numbers ourselves. We undertook this more in-depth analysis precisely because in another GP; Anukunta (Link) 2 cases of identical BPL card numbers existed. This is also an example of data discrepancy, because the identical numbers exist only in the downloaded Excel version of the GP data and were different numbers on the NBA website.
Lack of standardisation of units and terms: Units of measurement especially for financial reports are not standardised across documents. It requires limited skill but a considerable amount of time to convert the lakhs to crores and vice-versa. However, a more tedious process is figuring out what the exact time period of a year is for different government ministries.
For example,figures for funds “released during the year” (2011-2012) according to NBA (Central government) data (Link)in 9 states is exactly double the figure given in the individual State Annual Action plans (2012-2013).Further fact checkingrevealed that theseAction plans did not include the grant received in March because the plans are prepared for April-January. While this explains difference innumbers, it also illustrates that a very substantial grant amount remains unaccounted for in the State plans. Excluding such vital information can mean incomplete research analysis and conclusions.
Data Discrepancies: Another shortcoming in data stems from data inconsistencies within and across different government sites.For example NBA numbers for physical achievement on one page might not match another NBA datasheet, technically providing the same information. Perhaps different calculation methods were employed, but usually no explanation is provided.This leads to uncertainty regarding which data is correct, since achievement is measured inconsistently. Another discrepancy is related to BPL/Antyodayacard numbers. Sometimes they’re an amalgam of 15 alphabetic and numeric characters (Link), sometimes the name of the beneficiary is identical to their card number (Link)and sometimes the numbers area sequence starting from 01 (Link).
Lastly, while an impressive amount of information is available on the websites of the Houses of Parliament, their Questions Search still needs refining. For example, searching for the ‘Indira Awaas Yojana’ does not bring up any hits for irregularities in the scheme, unless the term ‘irregularities’ is specifically mentioned. Additionally, IAY and ‘Indira Awaas Yojana’ bring up separate results, and when the terms are combined, the search bears no results whatsoever. Ideally, it should pull up any question with the term IAY in it; otherwise this can result in the omission of critical questions. Nonetheless, the inclusion of a ‘Wit and Humour’ page (Link) gets a nod of approval.
Data needs to be organised, synchronised and standardised in such a way that it is simpler, cleaner and faster, and serves its primary purpose of providing accessible and correct information. Promoting accountability requires access to information. Even though the Indian government has taken some measures towards providing better access to data, an overall upgrade and clean up of GOI websites is urgently required.
[1]For an example of an effective, user-friendly interface take a look at the UK governments website (Link).
Highlights from the CAG Performance Audit of MGNREGA
Launched in 2005-06, the Mahatma Gandhi National Rural Employment Guarantee Act is Government of India’s most expensive flagship scheme costing Rs. 192322.33 crores since its launch[1].However, despite 7 years of operation, the latest performance audit by the Comptroller and Auditor General (CAG)[2] – points to the same implementation inefficiencies consistent with most social sector programmes[3].
Some of the findings of the CAG are highlighted below:
Inefficient Planning
According to the MGNREGA guidelines, the responsibility for the implementation of the scheme and the primary unit of planning is the Gram Panchayat (GP). Annual plans made by the GP, are consolidated first at the block and then at the district level to prepare the district plan/labour budgets. These labour budgets are an important basis for estimating employment to be generated and also form the basis of fund allocation to states/UTs. The CAG audit however found a number of inefficiencies with this planning process. These included:
- In 1201 GPs (31% of the sampled GPs) across 11 states, annual plans at the GP level were either not prepared or prepared in an incomplete manner. Interestingly, in 3 states, including Andhra Pradesh – none of the sampled GPs had made annual plans.
- District Labour budgets were not prepared in 49 districts (26% of sampled districts).
- Even when plans were made – they did not always have the requisite information. In 58 districts (31%) – the projected employment generation wasn’t included. Many plans also did not include the shelf of works or list of assets to be built.
- The CAG also noted significant delays at every level in the submission of the annual plans. Delays were highest at the GP level –difference between the target date of submission to the block and actual submission ranged from 1 month to as high as 21 months!
Shortfall and Delays in Execution of Works
The effectiveness of the planning has to be measured against the actual execution.
- The audit report observed large variations in some states between planned employment generations (as per the labour budget) and actual employment generated. ( See Table 1 for more details)
Table 1: Shortfall between actual employment generated and projections in the labour budget
| S. No. | State/UT | Range of shortfall |
| 1. | Bihar | 27% – 98% |
| 2. | Gujarat | 2% – 62% |
| 3. | Jharkhand | 40%-59% |
| 4. | Madhya Pradesh | 27%-94% |
| 5. | Maharashtra | 30%-100% |
| 6. | Rajasthan | 13%-50% |
| 7. | Tamil Nadu | 17%-59% |
Source: Table 5 of the report
- Moreover, in 14 states and 1 UT , 129.22 lakh works amounting to Rs. 126,961.11 crore were approved in the annual plans but only 38.65 lakh works ( 30% of planned works) amounting to Rs. 27,792.13 crore were completed during the audit period indicating significant inefficiencies in implementation of annual plans. In fact, in 25 sampled districts, across 9 states – 4,907 works amounting to Rs. 158.83 crores was executed outside the annual plans
Human Resource Shortfall and Capacity
The MGNREGA guidelines envisage Gram Rozgar Sahayaks (GRS) appointed at the village level to assist the GP in the implementation of the scheme. These GRS are responsible for maintaining all documents, overseeing the process of registration, distribution of job cards, allocation of works, payment of wages and ensuring monitoring of the scheme through social audits.
- The audit report found widespread shortages in GRS posts across 9 states ranging from 20% in Uttar Pradesh to as high as 93% in Punjab. In 4 states including Tamil Nadu and Kerala no dedicated GRS had been appointed.
- Further, funds for training personnel were highly underutilised in many states. In Uttar Pradesh for instance, 74% of funds for training in 2010-11 had not been utilised.
Delays, shortfall in release of funds
As with other schemes[4], the last few years has seen an increasing gap between allocations made for MGNREGA and the actual release of funds. (See table 2 for more details)
Table 2: Difference between Allocations (BE) and Actual Release of Funds
| Allocation (Budget Estimates (BE)) | Actual Release | |
| 2007-08 | 12000 | 12661.22 |
| 2008-09 | 16000 | 30000.19 |
| 2009-10 | 39100 | 39539.38 |
| 2010-11 | 40100 | 35841.49 |
| 2011-12 | 40000 | 29215.05 |
Source: Chart 8 of the report
Funds for MGNREGA are to be released in two instalments by GOI. The first tranche is based on the percentage of persondays projected for the first six months of the year in the labour budget (not exceeding 50% of the total approved budget). The second instalment is released only after utilising 60% of the previous funds released and, submission of Utilization Certificates (UCs) of the previous years. The audit however observed instances of:-
- Release of an additional 10% of approved allocations by GOI in some states. Further, excess funds of Rs. 2374.86 crores were released to six states either due to wrong calculations or without taking into account balances available in these states. Further, in 2010-11, GOI released Rs. 6,733.25 crores to states without taking into account the unspent balances of Rs. 10,104.71 crores as on 31st March 2010. Similarly, in 2011-12, GOI released Rs. 2,440 crores to four states without taking into account unspent balances amounting to Rs. 3758.91 crores.
- Funds (amounting to Rs. 4072.99 crores) were also released by GOI for the next financial year in March of the previous year.
- With respect to state shares, the audit found instances of shortfall in release of state share amounting to Rs. 456.55 crores between 2007 and 2012. In a number of instances, delays in the release of state share ranged from only 3 days to as high as 354 days. (See annex 5E of the report for more details).
Specific problems related to wages and MGNREGA works
Below are some of the problems specific to the implementation of MGNREGA.
- Job cards were not issued to 12,455 households in six states. Photographs on 4.33 lakh job cards (an important identifier against fraud and misrepresentation) were missing in 7 states. Non-payment or under payment of wages of Rs. 36.97 crores was noticed in 14 states. In 55 GPs, payment was made in cash violating the guidelines which prescribes payment through banks or post offices. Other issues included, suspected misappropriation of wages through engagement of ghost works, incomplete or improperly filled “muster rolls” non-payment of unemployment allowance, delays in receipt of wages, amongst others
- While the guidelines prescribe that the material cost should not exceed 40% of the total work cost, in 12 states and 1 UT, the material cost was seen to be exceeding the prescribed level by Rs. 1,594.37 crores.
- Moreover, 1,02,100 inadmissible works amounting to Rs. 2,252,43 crores were undertaken. A significant number of works (amounting to Rs. 4070.76 crores) have also remained incomplete for a long time.
Record Keeping and Monitoring
- The audit found poor record maintenance at not just the GP level but also at the block and district levels. Deficiencies relating to both non-maintenance and/or incorrect maintenance of prescribed basic records were noticed in 18%-54% of all tested GPs.
- While rules require state governments to identify or establish independent social audit units to facilitate the process of conducting regular social audits – in 10 states and 4 UTs, these units had not been constituted. Moreover, in 11 states, significantly fewer social audits had been conducted than as prescribed by the norms.
- Further, monitoring at all levels (including central level) was found to be unsatisfactory.
Beneficiary Analysis
Finally, the audit report also analysed the correlation between rural poverty and the average number of households provided employment during 2009-10 till 2011-12. While at an aggregate level, the report found that there appears to be a correlation between poverty and employment given under MGNREGS, there were some notable exceptions. Bihar, Maharashtra and Uttar Pradesh which together accounted for 46% of the rural poor[5] utilised only 20% of GOI funds. In contrast, Andhra Pradesh, Chhattisgarh, Rajasthan, Tamil Nadu and West Bengal utilised more funds as compared to their poverty levels.
The report further sampled 38,376 beneficiaries across 27 states to assess their perception, awareness and experiences with the scheme. The main highlights from this survey are given below:-
- While at an all India level the total women beneficiaries is 33% (as per the norm), this ratio was less than 1/5th in Gujarat, Madhya Pradesh, Odisha, Uttar Pradesh, West Bengal, Jammu and Kashmir and Mizoram.
- On average about 72% of beneficiaries were aware of the number of days of employment to which they were entitled. Awareness levels were highest in some of the smaller states/UTs – Kerala, Meghalaya, Mizoram, Tripura and Pondicherry. In contrast, it was 28% in Gujarat, 43% in Odisha, 52% in Bihar and 57% in Maharashtra.
- Around 70% of respondents were aware of the timeliness within which wages are to be paid.
- Only half of the interviewed beneficiaries were aware of the prescribed quantum of work which entitled them to full wage payment. Similarly only around 56% were aware of the manner of wage calculations.
- A positive finding was that on average work was provided after 9 days of the job request (the guidelines say within 15 days of job application). However 99% of beneficiaries who were not provided work within 15 days were not paid the unemployment allowance.
- 78% of beneficiaries reported that muster rolls were maintained at the work site and attendance was marked on it.
- 65% reported that they received wages within 15 days, 16% within 1 month, 11 % between 1-2 months, 4% within 2-3 months and 2% reported delays of more than 2 months.
- A significant number of cash payments were reported in Tamil Nadu (98%), Arunachal Pradesh (73%) and Meghalaya (70%).
For more details please see:
http://saiindia.gov.in/english/home/Our_Products/Audit_Report/Government_Wise/union_audit/recent_reports/union_performance/2013/Civil/Report_6/Report_6.html
[1] The figure is the actual expenditure from 2006-07 till 31/12/2012. Calculated from: Ministry of Rural Development, MGNREGA, Report to the People, February 2013. Available online at: http://nrega.nic.in/netnrega/WriteReaddata/circulars/Report_to_the_people_English2013.pdf
[2] The audit covers the period from April 2007 to April 2013 and across 182 districts, 458 blocks and 3848 Gram Panchayats across 28 states and 4 Union Territories. The audit is available online at:http://saiindia.gov.in/english/home/Our_Products/Audit_Report/Government_Wise/union_audit/recent_reports/union_performance/2013/Civil/Report_6/Report_6.html
[3] For more details on performance of social sector schemes, please see Budget Briefs. Available at: http://www.accountabilityindia.in/expenditure_track
[4] For instance, in Sarva Shiksha Abhiyan, out of the total approved plans (GOI and state) of Rs. 61.722 crores, only 69% was released.
[5] Based on poverty estimates by the Planning Commission
Placing public back in public procurement
The disproportionate diversion of public funds that have taken public attention by storm, calls for an immediate adoption of preventive measures and strengthening of regulatory foundations. The Parliamentary Standing Committee on Coal recently asked for a screening of the decision making process in the coal block allocation (see their report ‘Review of allotment, development and performance of coal/lignite blocks’ here). With the political and business links in this particular scam becoming more apparent when looking at the layers of individuals involved, as well as more elusive, in terms of its widespread implications, there is a larger, darker cloud that is set above this particular situation- to what extent does our legal system account for a mechanism which allows for concrete preventive action against this type of malfeasance?
In 2011, India ratified a document known as the United Nations Convention against Corruption (UNCAC 2005), joining 160 other countries who aim to address corruption, create awareness and assess national legislations to check compliance with the UNCAC. The UNCAC, as part of its mandate, seeks to create a structure that looks at national level policy frameworks on tackling corruption (on ‘Probity in Public Procurement’ and ‘Incentives to Corporate Integrity’)while also advising governments to create/implement a legal foundation based on international standards. Towards this effort, the ‘Probity in Public Procurement’ (see link here) survey covered areas such as a) the compliance of Indian laws with the UNCAC, specifically under the Public procurement and management of public finances article and b)to analyse current practices & challenges, and means to make (a) stronger.
Looking at the enormous arrangements made for PPP’s[1] across sectors in India by the government (see link), its importance as a type of public procurement has garnered much attention. While existing generic procedures address some elements of procurement behavior, there is no central law yet that regulates this process. This makes it susceptible to inefficiencies and low transparency, thereby leading to (in many cases) unwarranted behaviour from politicians and corporate honchos towards the field and mid management staff. This report looked into the Draft National PPP Policy of 2011, the General Financial Rules 2005, Public Procurement Bill 2012, Draft PPP rules 2011, and the Company Bill 2012. Karnataka, having one of the highest PPP projects as against any other state, as well as being one of the first states to introduce a public procurement legislation (the Karnataka Transparency in Public Procurement – KTPP Act 1999), warranted a look into state level understanding of public procurement as well.
A thorough look into these legislations[2] will show that India, contrary to what many critics claim, actually has well thought-out and reasonably structured legislations regarding public procurement and PPP’s at the state (Karnataka) as well as at the centre. Besides classifying the recognized methods of procurement, the laws create a framework for regulating the process. For example, The Public Procurement Bill 2012, looks at the procuring entity (need, cost of procurement, etc), the pre-qualification process for inviting the bids, identifying reliable bidders, evaluation criteria of the procurement, exclusion & debarring clauses and penalties for offences. The Bill is especially noted for stating sanctions against public and private entities to be regulated for bribe taking and bribe giving.
Despite this, some of the main challenges that can be seen are:
a) Many of these legislations, while well articulated, are still Drafts and are yet to be passed at the centre. This has not only held up the time frame from which they can be implemented, but have also resulted in a lack of planning (keeping legislative norms in mind) when it comes to hundreds of projects currently functioning or those that have occurred in the past.
b)It is not necessary that compliance with laws connect directly with implementation strategies of the central or the state government. It is one thing to build a bridge between the corporate and government but it takes efficient, strong and vigilant ground staff and processes that will allow for enforcement mechanisms to have an impact.
c) Roads, power, infrastructure not only have the most PPP projects and highest value in monetary terms, but are also known to be rent-thick sectors that may be vulnerable to risks in the execution of projects. Performance standards have not yet been set so as to minimize risks within these sectors.
d) Legislations like the Right to Information Act 2005 and the Public Interest Disclosure and Protection of Persons Making the Disclosure Bill 2010 does not recognize private entities that work under PPP’s to be eligible. This makes performance assessments difficult and may lay more responsibility on the public official than the private entity.
e) There is a serious lack of information trickling down the pipe regarding even these Drafts when it comes to establishing protocols under PPP’s. Creating awareness amongst all the levels of officials involved- be it private or public, is crucial.
f) When it comes to the state level processes, very few states have laws in place to look at public procurement or PPP’s. These states are Andhra Pradesh, Maharashtra, Karnataka, Gujarat, UP, Kerala, Tamil Nadu, Sikkim, Rajasthan and Madhya Pradesh. Surprisingly, small or no steps have been taken in the other states, considering that a total of over 700 PPP projects currently are recorded over the country, totaling to about Rs 383,332 crore (state wise breakdown of PPP projects is available here).
The strength of public procurements is laid out in its end form- in the quality of services that are to be provided to the public. It is high time that the public entities keep their eye on the ball, businesses become honest about their responsibilities and not dip their fingers in the honey pot, and finally, for the public to question and track the outcomes of failed and successful public private partnerships. Legislative scrutiny and a strong implementing structure will allow for the above to take place.
[1] To know more on PPP developing and implementation processes, view http://toolkit.pppinindia.com/urban-transport/module1-intro.php?links=intro1
[2] Refer to ‘Probity in Public Procurement’ report Pg 24-33
Why decentralization matters
This article was also published in the Financial Express on May 11, 2013.
On the 24th of April 2013, India celebrated the 20th anniversary of the passage of the 73rd and 74th constitutional amendments mandating the creation of a third tier of elected government -Panchayati Raj Institutions (PRIs) in rural areas and municipal councils in urban India. When passed, these amendments embodied the aspiration of transforming India’s top-down, District Magistrate Raj babu culture through greater decentralization. However, 20 years on, there is little argument that this aspiration remains unfulfilled and efforts to decentralize government, despite the constitutional provisions have been halfhearted at best. Very few powers and responsibilities have been actually devolved – local government expenditure in India accounts for just about 7% of total government spending in India. And even when monies have been devolved, such as in the MGNREGA which mandates that 50% of the total district expenditure be undertaken through the Gram Panchayat, implementation continues to be the domain of the local bureaucracy which is accountable to the district administration and not to Panchayats.
Against this halfhearted devolution is a raging debate in India over whether decentralization is in fact the right instrument through which to initiate the transformation of the Indian state. Corruption, elite capture and incompetence are often furnished asreasons not to empower local governments. But actual evidence of India’s experience with decentralization presents a far more nuanced picture. No doubt corruption and elite capture are serious problems but local governments also offer ordinary citizens the only real platform through which they can meaningfully participate in government and this participation, despite the threat of elite capture, hasthe potential both for improving access to government services but also for improving the quality of democracy more generally. There is an important caveat to the evidence I am going to present below – it deals entirely with rural local governments or Panchayats. This is because research on urban local bodies is extremely thin.
Now to the evidence. One of the simplest and most widely supported arguments for decentralization reforms is that decentralization brings governments closer to people and in so doing enables governments to better respond to citizens’ needs and priorities. Proximity to citizens’ also increases the potential of scrutiny and thus greater decentralization can, at least in theory, result in greater accountability.
In the absence of any serious devolution of powers and responsibilities to local governments in India, it is difficult to assess the validity of this claim in the Indian context. However, evidence does suggest that when citizens’ participate in local government processes like gram sabhas we do see improvements in access to government resources. For instance, a 2005 study by Timothy Besely, Rohini Pande and Vijayendra Rao finds that gram sabha meetings are positively correlated with better targeting of BPL cards to the poorer villagers. Interestingly, they also find that the odds of a politician’s household receiving a BPL card is lower in villages where gram sabha’s were held suggesting that gram sabha’s can in fact have a “disciplinary effect” on local political behavior thus ensuring greater accountability.
Another way of evaluating decentralization is through the lens of the effects of reservations in Panchayat elections on resource allocation. One of the most interesting, and widely studied, provisions of the 73rd amendment is the mandate to reserve one-third of all seats for women. A 2004 study by Esther Duflo and Raghavendra Chattopadhyay in West Bengal and Rajasthan found that reservations for women had some effect on the nature of public goods investments – villages with women panchayat presidents had significantly more investments in drinking water facilities than villages with male presidents. Another study of 11 states by Esther Duflo and Petia Tapolova corroborated these findings. These differences in investments are associated with the fact that the presence of women in Panchayats encouraged greater female participation in government both by encouraging more women both to be present at gram sabha meetings and also to petition panchayats resulting in greater investments in public goods prioritized by women. These studies thus substantiate the view thatdecentralization can indeed improve access to the provision of public goods and ensure alignment with local needs and priorities.
But the benefits of decentralization are not limited to improvements in access to services. By creating spaces for participation like the gram sabha, decentralization reforms have the potential to transform the very rules of engagement between the poor and the state because these spaces allow ordinary people to question, petition and directly demand benefits from the state. In 2010, Vijayendra Rao and Paromita Sanyal analysed the transcripts of over 300 gram sabha meetings. Their analysis tells a fascinating story of how poor people use the gram sabha as a space to discuss routine problems, access public goods and on occasion even challenge local inequalities. Most importantly, through these discussions, the gram sabha enables ordinary people to interact with state actors as equals. To quote Rao and Sanyal “the gram sabha allows …(ordinary people)… to momentarily discard the stigma of their ascriptive identity and low economic status and slip into their identity as citizens with equal rights in the eyes of the state.”
Of course gram sabha’s are rarely held and even when they are, discussion on public programs and beneficiary selection is rare. Moreover, it would be naive to suggest that deeply entrenched inequalities of caste, gender and economic status that mark everyday life in India miraculously disappear when citizens interact with local governments. But what the evidence does highlight is their potential for deepening democratic practice by enabling citizens to participate, question and demand from government. And in the long term it is only through greater democratic engagement that we are likely to see improvements in the quality of our democracy. The challenge for decentralization reforms in India is to strengthen these spaces of engagement. This can only be effective if local governments are in fact handed over the powers and resources needed to respond to people’s needs and priorities. And at the moment there is no evidence of political will to do just this.
Increasing transparency in aid delivery
As part of the PAISA project that tracks expenditure in elementary education in India, we collect information from state and district offices, over and above our school-level surveys. While we do face roadblocks when collecting this information, headmasters, as well as block and district and state-level officials, are usually forthcoming with their opinions and open about sharing their documents with us. I would attribute this to the assumption one makes, that if the government is spending public money to provide a public good, one can ask questions about how and when this money was spent and what the outcome was.
During a field-visit to Rajasthan, a district official from Sarva Shiksha Abhiyan (SSA), who spent a significant amount of his time liaising with civil-society representatives, felt that the same questions could not be asked of these representatives. The official spoke of the proliferation of aid agencies in the state and shared that he often found himself questioning whether their initiative to work in Rajasthan was influenced by the picturesque sights it had to offer.
This post highlights three initiatives that have attempted to bring about a more transparent system of aid delivery. It attempts to address the lacunae of information on the outcomes and efficiency of aid projects.
Internal reflection on projects
In this video called ‘Learning from Failure’ David Damberger speaks of his experience with Engineers Without Borders (EWB), and draws from an example in Malawi, where they found broken water taps that were funded by a Canadian government initiative. Of the 131 taps built, 81 did not work. Many of the taps remained broken because to fix it, communities required money for maintenance and spare parts that weren’t easily available. Next to those taps were another set of taps – which were broken too. The second set of taps was funded by an initiative by the American government, and the same mistake had been made not once, but twice. A step towards correcting such failures is the annual Failure Reports, an initiative spearheaded by EWB in 2008. These Failure Reports, as the name suggests, documents development projects that have not worked. This further led to another initiative called “Admitting Failure”, which invites civil society organisations to discuss what didn’t work for them, and what they learned from their mistakes
Feedback from beneficiaries
In another example, the Danish Refugee Council (DRC) attempts to involve beneficiaries in the development planning process. The council began an SMS programme in Somalia in 2011, through which recipients of aid from DRC projects can send an SMS to the organisation with their feedback and complaints. Complaints are forwarded to the relevant department in the Council, a response is sent to the complainant and these anonymous SMS reports are then translated and put up on their website.
At a larger scale, International Aid Transparency Initiative (IATI) aims to make information about aid spending public and accessible to donor governments, recipient governments and civil society organisations. Through the IATI standard, the initiative urges donors to publish data on aid budgets, financial flows, project activity, timelines and results, amongst other indicators. The campaign ‘Publish What You Find’ launched in 2008, rates donors on an ‘Aid Transparency Index’ based on these parameters.
Dennis Whittle recommends creating a consumer report for aid projects; a publicly available scorecard that assesses the efficacy of donor/civil-society driven projects. The examples in this post are an attempt to close the feedback loop for aid projects, thereby making the deliverers of aid more accountable to those who receive it.
DLHS 4 won’t include 9 low performing States
There has always been a criticism that government schemes and programmes are not evaluated rigorously. The idea of having an Independent Evaluation Office to provide “impartial and objective assessment of various public programmes and improve the effectiveness of public interventions” has not moved beyond interviewing a few well-known researchers. And then there were reports that the National Family Health Survey (NFHS) would be discontinued. Though that did not happen, it seems that the fourth and ongoing round of District Level Health Survey (DLHS), DLHS 4, has paid the price for keeping the NFHS.
I just discovered that the household and woman questionnaires of DLHS 4 would not be canvassed in nine ‘low performing’ States – Bihar, Jharkhand, Uttar Pradesh, Uttarakhand, Madhya Pradesh, Chhattisgarh, Orissa, Rajasthan and Assam[1]. In other words, it means that when it comes to these nine States, DLHS 4 will not tell us anything about trends in antenatal care, institutional deliveries, post-natal care, breast-feeding practices, immunization of the newborns and various other key indicators. Note that these nine States are the ‘low performing’ States (States with very poor health indicators in 2005), and account for about 48 percent of the total population, 59 percent of births, 70 percent of infant deaths, 75 percent of under 5 deaths and 62 percent of maternal deaths in the country.[2] This is bizarre since it completely goes against the very objective of DLHS 4 – “to assess the performance with regard to implementation of various programmes under NRHM at district level.”[3]
More importantly, what this means is that it won’t be possible to evaluate the effect of the National Rural Health Mission (NRHM) on any of the health outcomes it is intended to impact. The reason is as follows: DLHS 3, the previous round of DLHS, was conducted between December 2007 and December 2008. By then, the NRHM was in operation for barely 2-2.5 years. Thus, DLHS 3 would tell us, at the most, what has been the immediate impact of the NRHM. In order to understand the medium-term impact of the NRHM, one would need a survey that is carried out in a similar manner as DLHS 3. But the exclusion of the nine low performing States from DLHS 4 renders this impossible.
Instead, a much bigger ‘Annual Health Survey’ (AHS) has been launched covering all districts in these 9 States, with a sample of about 4.1 million households and 20.1 million individuals. The base-line survey happened in 2010-11, and it would be repeated every year. These numbers make AHS the largest demographic survey in the world. There is no doubt that the AHS would be crucial in keeping track of maternal mortality, neo-natal and infant mortality, etc., at the district-level, which was impossible till now. But its utility in analysing the effect of NRHM is, to be frank, quite limited since there was no baseline, i.e., there was no AHS or any such similar survey either before or immediately after the NRHM was launched.
What was needed was the inclusion of these nine States in DLHS 4 so that we could assess the medium-term impact of NRHM and simultaneous implementation of AHS. I guess, we have lost that opportunity now!
[1] DLHS consists of structured questionnaires for ever married women, husbands of surveyed women, households, and villages. Married women are asked about antenatal care, care during and after birth of the child, breastfeeding, immunization etc. Household questionnaire collects information about caste, religion of the household, assets of the household and household amenities. For details, see International Institute of Population Sciences (IIPS) 2010, District Level Household and Facility Survey (DLHS-3), 2007-08: India.
[2] Press Release (dated: 16.07.2012), Office of Registrar General of India, Ministry of Home Affairs, Government of India.
[3] DLHS – 4 Bid document, Invitation for the proposal for selection of field agencies for conducting District Level Household and Facility Survey, IIPS, Mumbai.
Navigating the Subsidised Grain Delivery Labyrinth
The Mid-Day Meal (MDM) Scheme, the world’s largest school-feeding programme,[1] guarantees a hot, cooked meal to each school-going child between the ages of 6 and 14 years in government elementary schools. Its main objectives are to increase enrolment, attendance and retention, while also improving the nutritional status of students. The scheme is beset with several problems in its implementation.[2]One of the most critical issues being that of delivery of quality grains to schools.We had recentlycarried out a qualitative study on the functioning of the MDMS scheme in a few districts. This blog highlights a number of issues we discovered which essentially stall the final delivery of grain to schools.
Before delving into these problems, it would be useful to briefly describe the process of lifting and delivering grain to schools. We will not describe here the complete process of allocating foodgrains to schools. Suffice it to say that the State MDM Directorate shares each district’s allocation with the District MDM Offices, State Food and Civil Supplies Corporation (SFC) and the FCI Regional Office (see flow-chart below). On the basis of these allocations,the FCI issues Release Orders (RO) to the SFC. These ROs allow the district to lift grain from the FCI base depot in the district. The SFC has to send its trucks to collect the grain from the FCI base depot. These trucks then deliver the grain to the SFC block godowns based on the allocations made by the district MDM authorities for each block. From the block godowns,the Samvedak (a contractor in charge of delivering the grain to the school) lifts the grain and delivers it onward to the school.Our findings reveal numerous bottlenecks responsible for delaying grain delivery at every step of this process.
Figure 1: Grain Flow & Organogram of Mid-Day Meal Scheme (State-level & below)
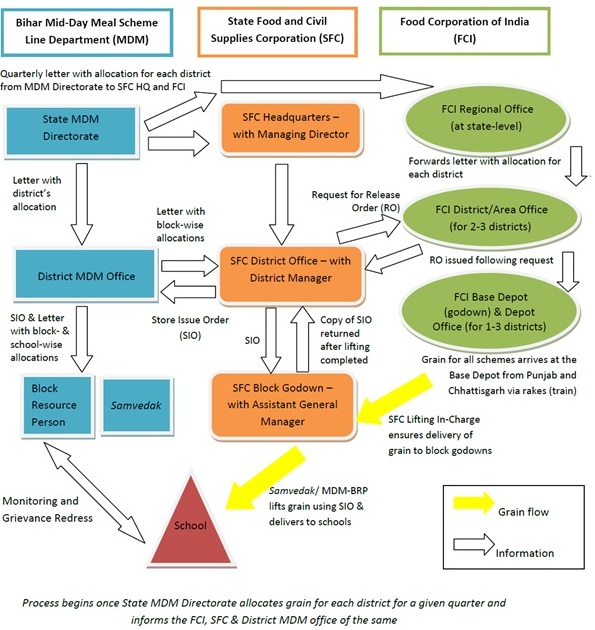
Bottlenecks at the FCI depot: Based on our interactions with the SFC District Manager, grain is not always available at the FCI base depot, due to delays in arrival from Punjab and Chhattisgarh, from where the grain is always procured. In one district during the second-half of financial year 2012-13, the FCI depot in the district headquartershad been shut down due to a pending investigation against the Depot In-Charge. So the district SFC had been reassigned to a depot in a neighbouring district. The new depot was already handling grains for three districts and, with the addition of one more, became greatly overburdened. Thus, the SFC trucks were not always able to lift the allocated amount of grain. Also, the surveyed district’s SFC had trouble transporting the grain back from the reassigned district as they were not allowed to take their own trucks to the new depot by the local truck unions. This was because the local unions demanded rangdaari tax (Protection tax) to allow the transport of grain. In another instance, the trucks which were sent to lift the grain were reassigned by an official of the new depotfor other work.
Bottlenecks at the Block godowns: To compensate for such delays, the SFC would unofficially make adjustments at the block godowns by using the grain for the Targeted Public Distribution Scheme (TPDS) for MDM. In the SFC’s parlance, this is known as “balance transfer,” or BT. While not an officially-advocated practice of the SFC or FCI, this form of “adjustment” of grain is common-place in the surveyed district.In addition, there is often pressure on the block godownsfrom PDS dealers to allow them to take the MDM grain. According to one of the Samvedaks we spoke to, the Assistant General Manager (AGM) at the block godowndoes not always inform them when the MDM grain has arrived,thereby allowing the PDS dealers to take the grain. While one AGM we spoke to, denied any practice of this sort, the Samvedaktold us that he has to keep in touch with some local people near the godown who inform him about grain arrival. A couple of times, the Samvedakreached the godown and found the MDM grain being taken by the PDS dealers. In suchcases, the Samvedak has to call the SFC district manager, who then instructs the AGM to correct the situation. Resolving this matter usually takes a long timeand the Samvedak is unable to deliver the grain to the schools on that day. The severe lack of manpower in the SFC further complicates matters. Currently, there are ten block godowns which supply grain for MDM, each of which is required to have an AGM; however, there are only three officials in charge of all ten.Despite having a schedule of days when each godown would be open, the lack of adequate human resources makes it harder for the AGMs to open the godowns as scheduled and manage the grain lifting.The Samvedak receives a Store Issue Order (SIO) from the SFC, which allows him to lift grain from the block godowns. There have been a few instances where the Samvedak has reached the block godowns with the SIO but the grain has not been available at the godown. Technically, the SIO is not supposed to be drawn unless there is grain available at the block godowns.Thus, along with the delay, the Samvedak also incurs a large cost here as he has to pay for the trucks he has taken on rent. The labour at the godowns also charge high amounts for loading the grain onto the Samvedak’s trucks, as they are not paid by the SFC for loading grain to the clients such as samvedaks or PDS dealers. The Samvedak has tried bringing his own labourers but the local labourers did not allow them to enter. Despite repeated complaints to the MDM authorities, the problems with the labour union have not been resolved as the MDM authorities have no power over the labour union. The MDM authorities have also complained to the SFC District Manager and to the District Magistrate, to no avail.
Finally, the fact that block godowns open late in the day (around 11am-12pm, according to MDM authorities and Samvedak) poses problems for Samvedaks, who are not only required to deliver the grain on the same day that they lift it, but to also inform the district MDM authorities and the MDM Directorate in Patna of the same. The SFC district administration and AGMs, however, claim that the godowns are open by 10:30am and that it is the Samvedaks who arrive late to lift grain.
Bottlenecks in final delivery to schools: Delays in lifting grain from the godown on a given day imply thatthe Samvedak is often forced to deliver them to schools late into the evening. He usually requests the teachers to stay in their schools on such a day; however, some teachers leave before the grain arrives and thus the Samvedak is forced to either take back the grain or leave it at a neighbouring school. The Samvedak also said that it is difficult to deliver grains to schools in the interior areas as the trucks and tractors cannot reach these places. Thus, local labour is required to carry the grain and they demand a high price. During the monsoon season, this problem is further exacerbated.
These were some of the issues that came up in our qualitative analysis of the grain delivery process in one of the states we studied. We can see that even after the RO has been issued, there are a number of stages that the grain goes through before finally reaching the school, and each stage has its set of bottlenecks which can delay the delivery of grains to the schools.Considering the crucial role the FCI and the SFC play in the provision of MDM, it is important to delineate accountability structures such that the schemes are not adversely affected. In the current MDM set-up, we find that the MDM department has no authority to question delays on the part of the SFC or the FCI. Similarly, the Samvedak, who has been contracted by the MDM department, has to resort to contacting the SFC District Manager in case of problems. Since there are two separate entities working together, the problems can take longer to resolve. The roles and linkages between these two entities need to be thought out more carefully so as to minimise the scope for problems.To this end, strengthening the channels of information-sharing and communication between all the stakeholders (FCI, SFC, the MDM department and schools) is imperative. Developing the capacities of district- and block-level Steering-cum-Monitoring Committees to hold each actor responsible at their own levels would alsobe a vital step in closing the accountability gap.
[1]Khera, R., 2006, “Mid-Day Meals in Primary Schools: Achievements and Challenges,” Economic and Political Weekly, Vol. 41, No. 46 (Nov. 18-24, 2006), pp. 4742-4750.
[2]For instance, see the following: 1. De, A. et al., 2010, PROBE Revisited: A report on elementary education in India, New Delhi: Oxford University Press; 2. Drèze, J. and A. Goyal, 2003, “Future of Mid Day Meals,” Economic and Political Weekly; Vol. 38, No. 44, pp. 4673-4683. And 3. Singh, A., A. Park, and S. Dercon (2012), “School Meals as a Safety Net: An Evaluation of the Mid-Day Meal Scheme in India,” Working Paper No. 75, Young Lives, Oxford, UK: University of Oxford.
The Right to (Right) Information
I attended the Fourth National Right to Information (RTI) Convention in Hyderabad, organized by the National Campaign for People’s Right to Information (NCPRI) on the 17th and 18th of February, 2013. In the midst of RTI legends, Nikhil Dey and Aruna Roy, were a large number of supporters that included social scientists, professors, government officials, and community workers. Several other genuinely-interested citizens, most of whom have used the RTI to avail public information, were also present. The Convention, in essence, was an initiative to encourage a conversation on the multiple facets around transparency, as well as help shape the priorities of the NCPRI in terms of what their focus areas for the next two years should be.
Having arrived at the end of the second day of the Convention, my colleague and I were greeted by the sounds of a mixture of folk and narrative songs (an exploration of field experiences with corrupt officials or on the positive impact of the power of information). This was indeed a unique start when compared to the conferences I have attended in the recent past This, in addition to the great conversation and networking at dinner was followed by a casual request to facilitate a workshop on ‘RTI and Youth’ the following day.
The third day of the Convention was divided between a session looking back at resolutions decided at the previous National Convention held by NCPRI in Shillong in 2011(available here), and the 15 Workshops organized under the umbrella term of ‘From Transparency to Accountability’. These workshops were centered around issues that included: Unique Identification (UID) and privacy, human rights in conflict areas, RTI and Media, RTI and basic services, Information Commissions, Proactive Disclosure on Section 4, RTI and natural resources, Social Audit , Electoral Transparency, RTI and PPP’s and the Future of RTI. The fourth day was given to a public announcement of the Hyderabad Declaration based on these Workshops and a Social Audit field experience near Hyderabad. By focusing on citizen engagement, this Convention was a great platform for several civil society members to talk about their initiatives and work, as well as to represent a small sliver of practitioners who use or want to use the RTI as a platform to monitor government processes.
The group of (approximately) 300 people, were given the freedom of attending any workshop of their choice amongst the ones noted above. While facilitating the ‘RTI and Youth Workshop’, some of the important themes that are relevant to all RTI applicants are listed below:
More RTI applications filed may not necessarily mean more information
According to Central Information Commissions Annual Report 2011-12 (see here), the number of requests received have increased from 3.62 lakh in 2008-09 to 7.05 lakh in 2011-12. This incredible increase is, however, paralleled by a jump in the number of requests rejected, from 23,954 applications in 2008-09 to 52,313 applications in 2011-12. The group gave supplementary anecdotal evidence that, in effect, questioned whether the documents received by the applicants are even relevant to what they had asked in their application. In other situations, the particular department may not even have the documents in their record or any systematic means to retrieve them- this poses a serious question on the management of data.
Access to information on the RTI may be disconnected
It is also important to add that there are information gaps on how to file and which department to file the application to, in both urban and rural areas. Who are the points of contact and how can this process be streamlined? These are important areas to identify and demystify to strengthen the RTI–user base. For the youth in college, it was suggested that RTI Forums and Clubs be formed to engage youth in constant debate. This would also help in leveraging the experiences of organizations involved in such work (as well as individuals) through a network format. In a way, that is what RTI Warriors[1] are doing through the social media.
Safeguards on paper may still lead to victimization
An interesting game during our workshop led to one topic standing out more than the others – What is the difference between an ‘RTI activist’ and everyone else? Is there a difference? Aside from me and one other person, the rest of the group really believed that there is indeed a separation. This, I believe, personifies the inherent concerns with regard to how information is accessed, who accesses it and finally, what are the effects on the person filing the RTI. Surprisingly, this view came from people who were RTI practitioners themselves or had a thorough understanding of its strengths.
This leads me to think that there is something missing in how we are approaching the RTI movement. On paper, we are all equal stakeholders. However, the level of discontent/threats/intimidation that RTI applicant’s may face when seeking particular information leads to a distinct form of victimization that may be a result of having lack of organized support and motivation from peers. Several instances were discussed wherein applicants have been sent to jail on multiple claims by politicians in power. This not only gives a picture of how protected one’s personal information is, but is also telling of how confidence in legal procedures can be broken in the minds of applicants. An interesting online forum has recently come up – the RTI Anonymous Movement (link here) tries to surpass this loop of threats. Essentially, it files RTI’s anonymously on behalf of those who do not want to give their personal information.
Conclusion
This Convention provided a space that allowed civil society members to coalesce, where the open discussion and debate on topics have left me nothing but impressed. A type of a back-to-basics approach in the active exercise of citizen participation when approaching such issues is indeed useful, and should be encouraged. For NCPRI, this is placed at the heart of their movement towards good governance and accountability.
[1] http://www.facebook.com/groups/179780035370908/?fref=ts