
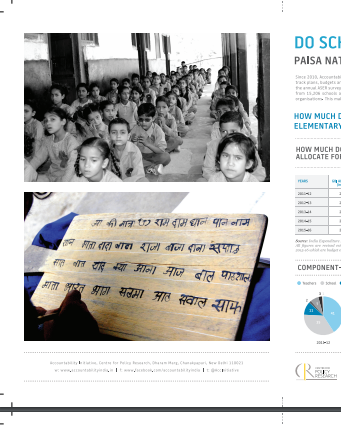
Between October and November 2014, PAISA went to over 14 thousand government run elementary schools across India to ask the following questions: Did you get your money? When did you get your money? Did you spend the money? And if so, what was the output of that expenditure? The PAISA survey is conducted as part of the annual ASER survey that tracks learning outcomes and is implemented entirely by citizen volunteers and civil society organizations. This makes it the first and only citizen led effort to track development funds. Do Schools Get Their Money? (PAISA Report 2014)” offers a snapshot of findings from the 2014 survey.
Sector Scheme Level: SSA
PAISA District Study: Bihar
This report analyses education resourcing in Bihar; and examines fund flows, entitlements, infrastructure and governance of schools in Nalanda and Purnea.
PAISA District Study: Himachal Pradesh
This report analyses education resourcing in Himachal Pradesh; and examines fund flows, entitlements, infrastructure and governance of schools in Kangra.
PAISA District Study: Maharashtra
This report analyses education resourcing in Maharashtra; and examines fund flows, entitlements, infrastructure and governance of schools in Satara.
PAISA District Study: Madhya Pradesh
This report analyses education resourcing in Madhya Pradesh; and examines fund flows, entitlements, infrastructure and governance of schools in Sagar
PAISA District Study: Rajasthan
This report analyses education resourcing in Rajasthan; and examines fund flows, entitlements, infrastructure and governance of schools in Jaipur and Udaipur.
Value Subtraction in Public Sector Production
We combine newly created data on per student government expenditure on children in government elementary schools across India, data on per student expenditure by households on students attending private elementary schools, and the ASER measure of learning achievement of students in rural areas. The combination of these three sources allows us to compare both the “accounting cost” difference of public and private schools and also the “economic cost”—what it would take public schools, at their existing efficacy in producing learning, to achieve the learning results of the private sector.
We estimate that the “accounting cost” per student in a government school in the median state in 2011/12 was Rs. 14,615 while the median child in private school cost Rs. 5,961. Hence in the typical Indian state, educating a student in government school costs more than twice as much than in private school, a gap of Rs. 7,906. Just these accounting cost gaps aggregated state by state suggests an annual excess of public over private cost of children enrolled in government schools of Rs. 50,000 crores (one crore=10 million) or .6 percent of GDP. But even that staggering estimate does not account for the observed learning differentials between public and private.
We produce a measure of inefficiency that combines both the excess accounting cost and a money metric estimate of the cost of the inefficacy of lower learning achievement. This measure is the cost at which government schools would be predicted to reach the learning levels of the private sector. Combining the calculations of accounting cost differentials plus the cost of reaching the higher levels of learning observed in the private sector state by state (as both accounting cost differences and learning differences vary widely across states) implies that the excess cost of achieving the existing private learning levels at public sector costs is Rs. 232,000 crores (2.78% of GDP, or nearly US$50 billion). It might seem counter-intuitive that the total loss to inefficiency is larger than the actual budget, but that is because the actual budget produces such low levels of learning at such high cost that when the loss from both higher expenditures and lower outputs are measured it exceeds expenditures.
How Much Does India Spend Per Student on Education?
Recent years have seen significant changes in the landscape of elementary education (EE) in India. Yet, updated estimates on public and private expenditure on EE are not available. This paper fills the gap by providing a methodology and estimates of per student public expenditure on children enrolled in government schools, and per student private expenditure on children enrolled in private unaided schools, for major states in India for the year 2011-12. The paper also provides estimates of total (public and private) expenditure on EE.
Our findings indicate that India spent 1.75% of the GDP (centre and states combined) on EE, while private expenditure was at least 0.71% of the GDP in 2011-12. Richer states spent less on EE as a % of their GDP but more in terms of absolute amounts, compared to the poorer states. Preliminary analysis indicates a strong relationship between per student public expenditure and learning levels. But this does not mean that more expenditure is needed to improve learning levels because government expenditure on EE is highly inefficient. It produces low levels of outcomes at high expenditure.
Changing this requires prioritising learning outcomes and demanding accountability toward learning outcomes from all officials, above everything else.
Achieving Transparency in Pro-poor Education Incentives
Book Chapter: Sarva Shiksha Abhiyan programme, Rajasthan, India in Achieving Transparency in Pro-poor Education Incentives edited by Muriel Poisson.
Do Schools Get their Money? PAISA 2012
Between October and November 2012, PAISA went to 14,591 government run elementary schools across India to ask the following questions: Did you get your money? When did you get your money? Did you spend the money? And if so, what was the output of that expenditure? The PAISA survey is conducted as part of the annual ASER survey that tracks learning outcomes and is implemented entirely by citizen volunteers and civil society organizations. This makes it the first and only citizen led effort to track development funds. “Do Schools Get Their Money? (PAISA 2012)” offers a snapshot of findings from the 2012 survey.