A Curious Case of Missing Children- Or is it?
9 November 2010
A recent report in the Times of India, UP’s 10 lakh ‘missing’ kids hints at huge scam, pointed out an interesting statistic:- Uttar Pradesh’s enrolment in class I to V- has fallen by 9.89 lakh children, from 2.49 crore in 2008-09 to 2.39 crore in 2009-10. On the other hand, enrolment in class VI to VIII- has gone up by two lakhs- from 74.15 lakh in 2008-09 to 76.15 lakh in 2009-10. The article points to the possibility that these figures based on the DISE data, are an indication of a huge scam.
What is DISE?:
DISE- District Information System for Education, developed by the National University of Education Planning and Administration (NUEPA) is one of the few, comprehensive data sources for the elementary education sector in India. (http://www.dise.in/dise2001.htm). All recognized schools (government and private) imparting elementary education are supposed to be covered under it. Every year, school related information is filled by headmasters or teachers in prescribed formats – making the school (the direct service provider) responsible for accurate and timely provision of data. The Cluster Resource Centre Coordinator (CRCC) is then supposed to make sure that all the schools in his/her jurisdiction are covered, there are no missing values, and the data is internally consistent. If the school is not cooperating in providing data, the CRCC can take up the matter with the district officials (DEO/ DPC).
Information Coverage:
The DISE obtains information about various aspects of the school, including geographical location, enrolment along with sex and caste-wise breakup, status of physical infrastructure in the school, receipt of grants from the government. As of now, information from more than 1.3 million schools is available online in the standard format. Such that It can be compiled at the block, district, state and national level. All this makes DISE quite unique in the Indian context.
Checks on the Data:
The DISE has instituted various mechanisms to check the quality of data at various stages of data collection and processing. The use of technology in processing and aggregating data eliminates the computational errors. The CRCCs are expected to check all the data filled by the head teacher and to cross-check by visiting some schools. The BRCCs and the District MIS coordinator are also expected to monitor the data quality by visiting 5% of the schools, and to be physically present there during the entry of the data of their respective clusters/ blocks. Manual checking of the software also provides several consistency checks to identify discrepancies at various levels. The District and the State MIS coordinators are expected to run consistency checks and take corrective steps. The data submitted by the states are further subjected to more consistency checks and all discrepancies are brought to the notice of the state authorities for explanation before merging it into the national data. This is the stage where, it seems the discrepancy in the enrolment data of UP have come to light. In addition, since 2006-07, NUEPA has made it mandatory that the data supplied by the state be merged with the national data only if it is accompanied by the report based on the Post Enumeration Survey to be carried out by an external agency.
Given, the numerous steps of data compilation, it is difficult to visualize the drop in the enrolments as a scam. If it’s indeed the case, then too many parties would have to be involved. Unfortunately, since the data for 2009-10 has not yet been publicly released, it is unclear if this trend of falling enrolment is concentrated in few districts in UP or more or less similar across the state. But, we were curious to see if similar patterns exist in other states as well.
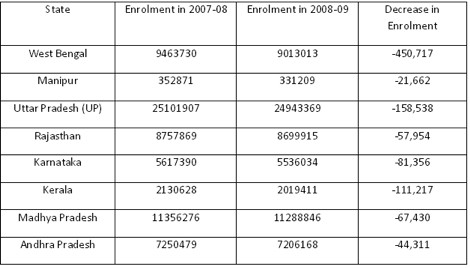
The results were interesting – to say the least. Past data shows that the trend in falling enrolment is not limited to UP alone but extends to as many as 12 states and 2 union territories. Some of these states include, West Bengal, Madhya Pradesh, Rajasthan and even Kerala!

Further, states such as Karnataka, Kerala, Andhra Pradesh and Himachal Pradesh reported a decline in enrolment figures for upper primary as well. Thus, the drop in enrolment in UP from 2008-09 to 2009-10 is not limited to this year, nor for UP alone.
How then, can this be possible?
One possibility is that drop-out rates are increasing at faster than enrolment rates. But the data suggests that for most states, the drop-out rates have been steadily declining. Thus the drop-out rates can’t be the explanation.
Second, if it’s a corruption story, then it is applicable not just to UP, but also to many other states, and even for the previous years. But, how would fudging the enrolment numbers in the DISE help? Higher enrolment numbers might help in getting more funds under the Mid Day Meal (MDM) scheme for a school- but DISE data is not used for the MDM allocations. Its main use is preparing annual and perspective plans under the SSA. And, even with actual enrolment numbers, one can indulge in corrupt practices.
The only other explanation we could think of was that for some reason, states have reduced over-reporting their numbers or that there are more stringent checks on the data submitted by the states to the centre!!!
In short, the story might not be as straightforward as indicated by the article – but it would be interesting to know the reason. With DISE being the most comprehensive data on education, one can only hope that it gives us a realistic picture of the status of education in India.
Avani Kapur is Senior Research and Program Analyst at the Accountability Initiative.
Ambrish Dongre is Senior Researcher at the Accountability Initiative.


