

How much does India spend on Elementary Education?
4 December 2014
The landscape of elementary education (EE) has changed dramatically in the last few years. It has been characterized by a concerted push to build physical and human infrastructure in government schools, variety of schemes launched to reduce the number of out of school children, paralleled by an increasing preference of parents to send their children to private schools. Despite these structural changes, updated estimates on public and private expenditure on elementary education are not available. Our paper, ‘How much does India spend per student on elementary education?’ attempts to fill this gap by describing the methodology, and providing estimates of per student public expenditure on those enrolled in government schools, and per student private expenditure on those who are enrolled in private schools, for 20 major states in India for the financial year 2011-12.
Public Expenditure on EE
The state governments are the primary spenders on EE. The details of these spending are in individual state budget documents. However, collating information from budget documents is difficult as many of them are not available online, budget heads are not always standardized and expenditure is spread across many departments (such as culture, tribal development, social justice etc.) Further, in recent years, the central government has increased its spending on EE through Centrally Sponsored Schemes (CSS) such as Sarva Shiksha Abhiyan (SSA) and Mid-Day Meal (MDM). The mechanism of fund flow is scheme specific- SSA is routed through an autonomous implementation society whilst MDM flows into the state treasury) and funds are shared between the Central and State governments.
Given these complications, total public expenditure on EE was derived by manually collating expenditures on EE from respective state budgets across departments (excluding the state share for SSA) and separately adding expenditures under SSA, which was obtained from the planning and budgeting documents on the SSA portal. Total expenditure was then divided by total enrolment in elementary grades for government schools obtained from DISE (grades 1 to 8) to obtain per student public expenditure on those who are enrolled in government schools[i].
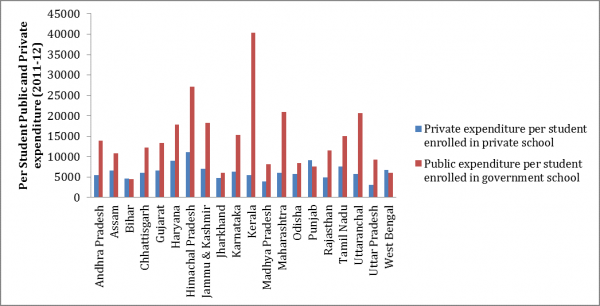
Median expenditure per student turns out to be Rs. 12,768. Chhattisgarh is just below the median while Gujarat is just above the median. Expenditure per student is highest in Kerala, followed by Himachal Pradesh, Maharashtra and Uttaranchal. On the other hand, Bihar, West Bengal and Jharkhand are the lowest spenders.
Private Expenditure on EE
Private expenditure consists of expenditure incurred by the households on school fees, exam fees, fees toward private tutoring, spending on books and stationary, conveyance etc. We use the latest available data, 64th round of NSS, Education in India: 2007-08 – Participation and Expenditure, to calculate per student private expenditure for those who attend private schools (aided and un-aided). We adjust these numbers for inflation between 2007-08 and 2011-12.
Median expenditure per student turns out to be Rs. 5,959. Chhattisgarh is just below the median while Maharashtra is just above the median. Expenditure per student is highest in Himachal Pradesh, followed by Punjab, Haryana and Tamil Nadu. On the other hand, Uttar Pradesh, Madhya Pradesh, Bihar and Jharkhand are the lowest spenders.
Figure 1 shows state-wise per student private and public expenditure.
Expenditure per student and state GDP
Figure 2 indicates that on an average, higher the per capita income (as measured by per Capita Net State Domestic Product (NSDP)), higher is the public expenditure per student enrolled in government schools[ii].
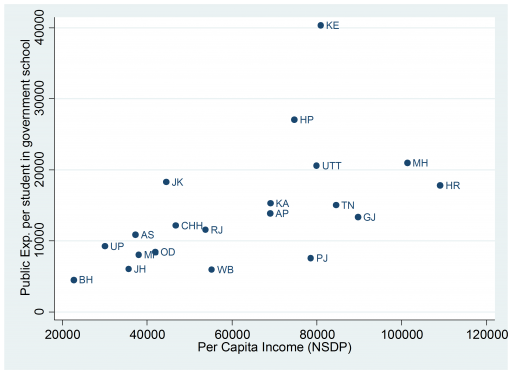
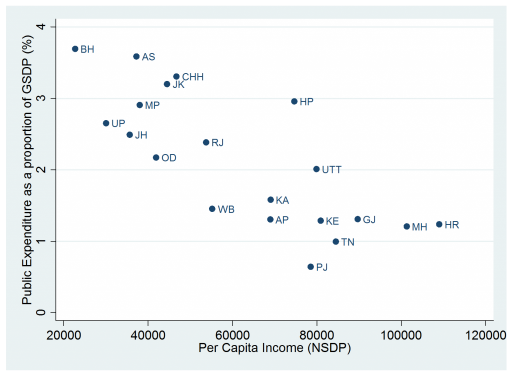
An interesting exception is Punjab whose per capita income is high and yet its spending per student is lower compared to several other low income states. Further, Punjab’s public expenditure as a proportion of state GDP is quite low given its per capita income (Figure 3).
Public expenditure per student and learning outcomes
An important question is if there is a relation between public expenditure per student and learning outcomes. Figure 4 shows that on an average, higher the per student expenditure, higher is the learning outcome, measured here as proportion of students in government school in grades 1-2 who can read letters, words or more[iii].
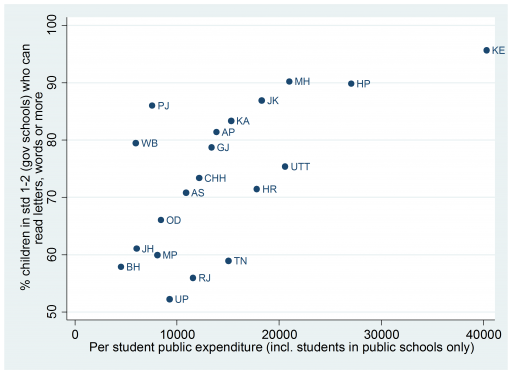
The relationship holds even after taking into account per capita income[iv]. Does it imply that more should be spent per student in a government school if we want to improve the learning outcomes?
The answer is no. We must look at what the opportunity costs or alternative uses of this expenditure. Even though a full-fledged analysis is beyond the purview of this blog, a simple example would be comparing per student costs and learning outcomes in government and private schools, which indicates that, in every state, learning outcomes in private schools are better than the government schools, while per student spending is much lower as compared to government schools[v]. This ‘double’ inefficiency ends up imposing a huge burden on India, amounting to 2.78% of GDP[vi]. This reveals that there is a dire need to ask hard questions, and take tough decisions to make expenditure more ‘efficient’, to get more bang for the buck, so to speak.
Since 2012, there have been some important policy shifts. The 12th Five Year Plan explicitly articulated learning improvement to be a key policy goal. This was followed by MHRD’s renewed articulation of the importance of meeting the learning challenge through the launch of the ‘Padhe Bharat, Badhe Bharat’ scheme with a focus on learning. But is this going to be enough to solve the ‘learning challenge’? This scheme is a good starting point but the need of the hour is to rework the education system such that it moves away from its preoccupation with input delivery to one that prioritises learning outcomes. This focus on inputs has left us in a situation where means to an end have become an end itself. How to get the system to prioritise learning outcomes not just in policy documents but also in actual practice, i.e. in terms of plans, finances and actions of education bureaucracy all the way down to schools is going to India’s greatest challenge in elementary education in the next few years.
[i] More details on the methodology are available in the paper. Note that public expenditure per student enrolled in elementary sections of government schools is over-estimated. The reason is that the numerator includes expenditure on private aided schools, while denominator doesn’t include students in private aided schools. This over-estimation is a matter of concern mainly for states like Kerala, Maharashtra and Tamil Nadu where a significant proportion of students are enrolled in such schools. For the states where % of private aided schools is low (such as Rajasthan, Madhya Pradesh), this is not a matter of concern.
[ii] Similar relationship holds in case of private expenditure per student and per capita income as well.
[iii] Data has been obtained from ASER. Data from ASER 2011 and ASER 2012 give similar results. Further, learning outcomes measured by reading ability or ability to do math yield similar results.
[iv] This analysis is preliminary. A robust analysis would require panel data and associated techniques.
[v] The difference in learning outcomes persists even when students’ background characteristics are taken into account, although the magnitude declines. Refer to our paper for references to the related literature.
[vi] For details about this startling finding, see Pritchett and Aiyar (2014), forthcoming
Recommended for you
We tried to come up with a clear…
The bureaucracy is considered to be the steel…
Policy Buzz
Keep up-to-date with all that is happening in…
Policy Study on Using Data for Better Policy…
Welfare governance in sectors such as education, health…

Understanding India’s Health Budgets
The budget is a vital tool to support…