Notes from the field: School Management Committees – Somebody Else’s Problem Field

“The Somebody Else’s Problem field is much simpler, more effective (in making something properly invisible) … This is because it relies on people’s natural predisposition not to see anything they don’t want to, weren’t expecting, or can’t explain.”

Douglas Adams, The Hitchhiker’s Guide to the Galaxy

Three years ago, the Right to Free and Compulsory Education (RTE) Act[1] placed significant responsibilities on elected parents of students, representatives from the school staff (including the headmaster) and the community when they created School Management Committees[2] (SMCs) in every government school.

These committees were and continue to be created with the intention of devolving school-level planning, management, and expenditure of grants to the community level. As part of their responsibilities, each year SMCs create a School Development Plan (SDP) to guide school level expenditure. This plan also becomes the basis on which district and state administrations plan for elementary education that year.

However, anecdotes from the field suggest that SMCs are not functioning according to the ideals met in the RTE Act. Conversations with headmasters and the SSA administration have revealed that one of the biggest problems is that parents are not willing to participate in school level planning. SMC members do not attend trainings held by the SSA administration, are often absent from meetings in the school and are unwilling to participate in creating SDPs. This post is an attempt to understand some of the problems that make SMCs unwilling to participate in the school level planning process, based on recent field-visits to Himachal Pradesh and Rajasthan.

Few incentives to plan

During our last visit to Rajasthan, with a journalist who wanted to learn more about the PAISA study, a headmaster told us that the SDP had not helped them get the facilities they needed for the school. The headmaster had been repeatedly recording requests in the SDP to raise the level of the school’s playground to match that of the road that ran outside. For the last two years, the requests were ignored; and, like clockwork, the rains came and flooded the school’s premises every year, making it hard for students and teachers to get to their classrooms. When asked what he could do about it, the headmaster said that he would put the request in their Plan again the next year, but try first to ask the Panchayat for help.

Few incentives to provide feedback

Minutes later, the SMC President who was seated in the same room, and had been intently listening to our conversation, was asked what he thought of the SMCs ability to make a difference. At that moment, he looked nervously at the headmaster and assured us that things were going rather well; that the SMC members met regularly and worked towards  a sound SDP, based on which the school’s requests were met. Considering the school’s playground was a mud track several inches lower than the concrete road that ran outside, it became apparent that the headmaster was telling us the truth about SDP. The SMC president on the other hand, gave us a version of reality that was easier to digest – that the ideals enshrined in the Act have been met. However, in a situation like this one, unless there is an incentive to evaluate and verify conflicting stories on the ground, it is hard to assess what the truth really is.

Few incentives to evaluate

In Himachal Pradesh, a State-level education official told to us that SDPs were neither evaluated nor collated at the State-level. Moreover, a district-level official admitted that SMCs’ plans rarely find their way past the block office to the district office. The reason was that the State and district administration did not have the capacity or the need to take into consideration the nuances in the SDP. To meet the needs of a centralised planning system, which allocated resources based on aggregated reports, the State needed to use DISE[3] data, which neither prioritises the urgent needs of the schools, nor offers the granularity that SDPs promise. The official was aware that if the Plans continued to be overlooked, it would eventually dissuade community members from planning for the school altogether, but did not know what he could do about it at present.

Perhaps the first step to incentivise SMCs to participate in school-level planning is to admit that not all SMCs have been able to make plans, and that not all of these plans have been able to reflect the needs of the schools. Moreover, even when plans have reflected the needs of the school, it has been difficult for local-level administrations to incorporate the school’s plans into a rigid planning system. However, recording feedback from all the levels in the administration and the community is harder to do than tracking the lacunae in infrastructure or teaching staff at the school level.

When presented with the challenge of reporting progress on meeting policy directives, SMCs should be able to report to Block Officials on the extent to which they are prepared or willing to work with a school. Blocks should be able to report to Districts which of their schools need more support or training.  Districts should be able to tell the State which blocks require greater financial and physical assistance, and finally, the State can decide with the Centre if they truly are closer to the ideals enshrined in the RTE Act.

Unless there is an incentive to report on the nuances of community participation (or lack thereof) SMCs will soon slip under, what Douglas Adams effectively called, ‘The Somebody Else’s Problem field.’


[1] This link leads to the RTE Act http://mhrd.gov.in/sites/upload_files/mhrd/files/rte.pdf

[2] This leads to a blog post that provides more information about SMCs, their functions and powers: http://www.accountabilityindia.in/accountabilityblog/2510-empowering-schools-and-school-management and this leads to State specific rules on SMCs: http://mhrd.gov.in/smc

[3] District Information System for Education (DISE) is a computerised management information system, with the school as the unit of data collection. Every year, headmasters fill in a standardised format that feeds into the DISE database available here: http://dise.in/index.htm

Do Private Tuitions Improve Learning Outcomes?

Despite increased attention to school based learning over the past decade by policy makers, the ASER reports have shown that the learning levels of children in the Indian education system have remained consistently low and have, in fact, declined over the past 8 years. The latest ASER report shows that only 41% of children in the age group of 6-14 can read a standard 2 text (ASER 2013). Consequently, critical and rigorous analysis of policies surrounding provision of school-based education has received much-deserved attention[1]. In the process, the role of additional educational inputs provided by households, such as private tutoring, has remained neglected.

Private tutoring is defined as fee-based tutoring that provides supplementary instruction to children in academic subjects that they study in the mainstream education system. This phenomenon is widespread across many developing countries, including India[2]. As per the latest ASER (ASER 2013), approximately one-fourth of children enrolled at elementary level (Std. 1 to 8) in rural India attend private tuitions. They pay on average, Rs. 170 per month, amounting to slightly above Rs. 2000 per annum to attend these tuitions[3].

An important question that arises in this context is: do learning outcomes of children improve if they attend tuition? Finding a difference in learning outcomes of those who attend tuition and those who don’t, and attributing it to private tuitions is misleading. Part or all of the difference in learning outcomes might be due to different characteristics of children who attend tuition. There are observable and unobservable differences between the two groups of children, which make it difficult to figure out the effect of tuition, if any[4].  To give an example, ASER data indicates that children belonging to richer households are more likely to attend tuitions. Richer households are also likely to provide more support to a child in the form of other material inputs. Data also shows that children of more educated parents are more likely to attend private tuition, but more educated parents are also in a position to help the child with studies. This makes it difficult to disentangle the effect of tuition from the effect of other material inputs, or the effect of having educated parents.

There are many techniques available to overcome this problem. Interested readers can refer to the relevant literature[5]. Choice of technique ultimately depends on availability (or not) of appropriate dataset, time and money at hand, and feasibility of data collection. We use household fixed effects (FE) technique to estimate effect of tuition on learning outcomes[6]. Household FE utilizes variation in status of children on private tuition within a household. To give an example, suppose there are two children in a household. One attends private tuition, and other doesn’t. Then, the difference in the learning outcomes of these two children would be attributed to private tuition. Note that all other observable and unobservable factors at the household or village level affecting learning outcomes are controlled for in this technique. Hence, household FE approach reduces self-selection problem substantially. But one must remember that it doesn’t eliminate the problem completely since it can’t control unobservable child-specific differences such as motivation, intelligence, dedication etc.

We use this technique due to the availability of ASER dataset for 2011, whose underlying sampling strategy is such that pre-determined number of villages from each district and pre-determined number of households from each selected village are surveyed[7]. A unique characteristic of ASER dataset is availability of learning outcomes for reading and math[8].

In order to estimate learning levels, we developed a standardized aggregate score. For this, we sum up reading and math scores for each child, and then standardize it by subtracting a child’s aggregate score from the mean aggregate score of all students, and then dividing by the standard deviation of aggregate score for that year. This standardized aggregate score has been used as the dependent variable in our empirical analysis. The key independent variable is whether the child attends tuition. Other independent variables are whether the child attends government or private school, age and gender of the child, class in which the child is studying, and finally both parents’ age and education. We have other controls at the household and village level, but they are not relevant in a household FE model.              

What do the results show? Household FE estimation results indicate that attending private tuition has 0.14σ effect on learning levels. How large is this effect? Comparing the coefficient on private tuition with that of standard/class in which child is studying or that of type of school reveal that the effect of attending tuition is as large as an additional year of education or attending a private school instead of a government school[9].  Interestingly, results also show that the effect of tuition is almost twice as high for children enrolled in government schools, compared to those who are enrolled in private schools. Further, children who attend tuition and whose parents are less educated, benefit more from these tuitions. Effect of tuition is also higher for children who stay in non-pucca households compared to those who stay in pucca households. Given that children attending government schools or having less educated parents or less well-off have lower learning levels, private tuitions clearly are benefitting disadvantaged students.   

There is significant variation in prevalence of private tuition across states. States like West Bengal, Tripura have 67-69% children at elementary level attending private tuition, while Bihar and Orissa have 40-50% children at elementary level attending private tuition. And we find that the effect of tuition is higher in these states. In Bihar and West Bengal, attending private tuition has 0.22σ effect on learning levels, while in Odisha, attending private tuition has 0.18σ effect on learning levels.     

Why do private tuitions have a positive effect on learning outcomes? One straightforward explanation is that those who attend tuition spend more time studying. Though ASER doesn’t capture time spent at tuitions, analysis of IHDS data indicates that those who attend tuition spend, on average, 9 hours in tuitions[10]. That would mean 1.5 extra school days per week. Another explanation could be remedial teaching in the sense that tutors might be making some efforts to identify the child’s weakness, and teach accordingly. And finally, as Dr. Wadhwa points out in the ASER report, the link between incentives and accountability – if someone is paying for a service, the onus is on the service provider to deliver, because the consumer can always ‘vote with her feet’.

References

Bray, Mark. 2007. The Shadow Education System: Private Tutoring and Its Implication for Planners. UNESCO: International Institute for Educational Planning, Paris

Duflo, Esther, Glennerster, Rachel, & Kremer, Michael. 2007. Using Randomization in Development Economics Research: A Toolkit. Handbook of Development Economics, edited by T. Paul Schultz and John A. Strauss, Vol. 4

French, Rob & Gandhi-Kingdon, Geeta. 2010. The Relative Effectiveness of Private and Government Schools in Rural India: Evidence from ASER Data. DOQSS Working Paper No. 10-03, Institute of Education, University of London

Muralidharan, Karthik. 2013. Priorities for Primary Education Policy in India’s 12th Five Year Plan. India Policy Forum 2012-13. Vol. 9, pp1-46

Wadhwa, Wilma. 2014. Private Inputs into Schooling: Bang for the Buck?, ASER 2014. Available at http://www.asercentre.org/Keywords/p/205.html.


[1] See Muralidharan (2013).

[2] See Bray (2007).

[3] There are Statewise variations. For details, see Wadhwa (2014).

[4] This is referred to as ‘self-selection’ problem in empirical economics.

[5] Duflo et al. (2007).      

[6] Approach is similar to French & Gandhi-Kingdon (2010)

[7] We perform same analysis using ASER 2012 data as well. Since results are fairly similar, we report findings obtained from using ASER 2011 only.

[8] Details can be found in any ASER report available on ASER website.

[9] Baseline is a child in government school not attending private tuition.

[10] IHDS stands for India Human Development Survey. Details can be found here: http://ihds.umd.edu/

Through the Looking Glass

In all the debates about rights, social sector schemes and pushing towards ensuring quality services to citizens, there is but mere passing mention about the importance of performance management and administrative reforms over and above the implementation failure of public services[1].  This blog looks at the growing emphasis on the features of the social sector schemes, and overlooking the other side of the (administrative) coin which looks at the management style and employer-employee relations in a public sector context. This has been discussed by Lant Pritchett[2]  in the context of ‘State Capability Trap’ in reference to governance & public sector reform.

This view is definitely not new, and some efforts have been made towards inching closer to more output-based large scale performance management tools. While there are presently vertical lines of appraisal systems in place across departments and ministries, and supervisory checks are present on paper for those implementing schemes at a local level (see blogs on the process in the education sector by my colleagues), as well as citizen-led monitoring through social audits for large schemes like the MGNREGA, there are serious gaps when it comes to understanding performance at a macro level. From the World Development Report 1997, “The State in a Changing World”[3] we see a growing interest in the significant role that formal and informal institutions played, and the need for an overarching Public Sector Reform agenda that focused on ‘managerial capacities, developing positive organisational cultures, and providing incentives for performance both at individual and organisational level’. India added this to their agenda with the UPA government setting up the 2nd Administrative Reforms Commission (ARC) in 2005, which brought out 15 key recommendation reports over a period of 5 years. This was followed by the Public Services Bill in 2007 which reviewed and set up a Management System for Public Service.

A colleague at AI a few years ago had written a blog about the introduction of the PMES or the ‘Performance Monitoring and Evaluation System’ in 2009 (see here). Since then, quite a few evaluation reports have been published . So what is the PMES? According to the Administrative Reforms Commissions 10th Report in 2011, “Performance management is the systematic process by which the organization involves its employees, as individuals and members of a group, in improving organizational effectiveness in the accomplishment of organizational mission and goals”[4]. A subset of performance measurement, which looks at the inputs, goals, impact and effectiveness defined by the departments themselves  of a particular service/scheme, performance management looks at the planning, reviewing and evaluating the performance of individuals and departments, looking towards developing capacity (skill building) and promoting innovation for a result-oriented work process. A visual of what this looks like is given below


(Source: Adapted from Second Administrative Reforms Commission’s Tenth Report, 2008)


This is preceded by the processes that Ministries and Departments engage in, when structuring projects. According to the Guidelines for the Results Based Document (RFD), each Department (with consultations with their officers) sends in the RFD to the Ministry by February end, specifying their goals and success indicators for the year. After being reviewed by an Ad- Hoc Task Force (ATF) (which consists of domain experts, former Secretaries to the Government of India and retired Corporate Heads) this document, and the Budget, is approved/edited by March every year by the Cabinet Secretariat. This is followed by a review of the document by the High Power Committee- HPC (which consists of the Cabinet Secretary, Finance Secretary and other senior officials)- and submission of the report to the Prime Minister. The Departments/Ministries have to send in the year-end evaluation by May of the following year- with reviews again by the ATF and the HPC.

The strength of forming such a system is the recognition that there is a need for assessing performance of individuals in a system, done so in relation to the targets prepared at the beginning and in sync with goals of the department and not limited to the individual’s capacity. This type of review existed previously only for IAS officers (by the Department of Personnel & Training), but was not done for state level officials until recently. Taking a few pointers from the Appraisal format that currently exists by the Ministry of Personnel, the PMES allows for a concrete and systematic assessment of officials and their work in a standardized way and makes each Department review (and hopefully revise) their own specific structure of appraisals. A performance system, then, aims to removes any vague criteria of ‘good or bad’ for promotion, and moves towards improving motivation and creating an incentive based rating system that places the individual in a larger context of the organisation. This is backed by creating avenues for developing interests and aligning potential of an officer to what they will be doing in the future.

While these all are a welcome change, there are, as with every new system, challenges they need to overcome. At a broader level, most reforms that take an administrative avatar, have quite frankly, failed to take off, or be implemented. Even the recommendations that were offered by the ARC have only been taken up by a handful of States (though almost all of them were accepted by the Cabinet committee)- and it is unclear whether this was done with intentions for actual implementation or as a box-checking task. Problems such as pre-decided budgetary allocation, inflexible program structure or even the lack of a conducive work environment can hamper a government official’s performance.  

This, in addition to blurred reporting structures (as is seen in most projects that have an inter-department characteristic or being handled by multiple agencies) can create hurdles for those who are finally held accountable for inaction. The website, where a few reports are available, does not showcase any documents on action taken if an official has fared poorly in the performance rating, or what incentive-schemes were developed, or the type of innovations that may have led to promotions. Putting this out in the public domain could be the start of increasing transparency in this area.

Recent debates emphasise the challenges that are seen with outputs (or lack thereof) of particular schemes, plagued with officials that do not implement well, usurp public resources and are inefficient. What has not gained much traction in these debates is the point of internal public sector reforms that has tried to go hand in hand with more schemes and more public services offered. If we look at the sheer number of schemes that exist in this country, and the number of officials on the ground and the incentives that currently exist, we can assess the gargantuan task that lies ahead. While steps have been taken to bring attention to this, the lack of enthusiasm in terms of the uptake of previous recommendations is telling of the future course of action.


[1] Performance of social sector schemes, 2014. http://finmin.nic.in/WorkingPaper/Performance_MSSSchemes.pdf

[2] ‘Capability Trap: The Mechanisms of Persistant Implementation Failure’ http://www.cgdev.org/publication/capability-traps-mechanisms-persistent-implementation-failure-working-paper-234

[3] World Bank. World Development Report 1997. http://wdronline.worldbank.org/worldbank/a/c.html/world_development_report_1997/abstract/WB.0-1952-1114-6.abstract

[4] Government of India. Department of Administrative Reforms & Public Grievances. ‘Performance Management in Government’ http://indiagovernance.gov.in/files/performance-management.pdf

Strengthening SMC to make SDP– Should be an Empowering Process

I had recently attended two training programmes on Strengthening the School Management Committee[1] (SMC) to make an effective School Development Plan. One of it was at the state level, wherein all the District Education Officers of the state attended and the other was at block level, where in block level extension officers for education including some head masters and cluster coordinators were present.  The major objective of this program was to train the officers to support SMC members with respect to access, equity, quality and community participation, while SMCs develop the School Development Plan (SDP). All of them are directed towards empowering individuals in the management of school related activities.

The aim of this blog is to unravel whether state mechanisms are serious in moving towards empowering SMC members, or whether it is merely a box-checking endeavor to gather numbers, using experiences and reflections from this training programme.

At the outset, I was really impressed with the detailed module[2]  on how to prepare School Development Plan (SDP)[3] the state has prepared. The module for the training programme had a detailed schedule, with the exact time the trainer required for each topic. In both the training programme that I attended, I found that the trainers have followed the module fully. However, while they were instructing the officers on what they need to do, they failed to share or explain, how to do it – the process/methodology of doing it. In other words, the trainer did not focus on the information which could potentially be the vehicle to empower and conscientize the SMC members and the community at large. This is the concern that I want to raise among the policy makers for critical debate on the process of strengthening SMC at the community level.

The process of training, that I witnessed, was like the “banking” approach to education — a metaphor used by Paulo Freire[4] that suggests trainees are considered empty bank accounts that should remain open to deposits made by the trainers. This “banking” approach will result in the dehumanization of both the trainees and the trainers. In addition, it will stimulate oppressive attitudes and practices in society. Hence the SMC members will never take the role as envisaged in RTE Act.

As per the module, the SMC members need to map down the history of the school, make a social and resource mapping, as well as draw out different types of Venn diagram for mapping out the distance of different villages from where the children come to that particular school, etc. I feel that this process, is actually a Participatory Learning and Action (PLA)[5] methodology. These tools allow parents to know more about the school and can be an empowering process for the community members. They can really own the school and feel for it. It can be the vehicle that helps the SMC members by allowing them to be aware of the strengths as well as the areas of improvements in their school while also mapping out different ways to make it more resourceful.

For example, if during SMC meetings, while documenting the history of the school, the people will come to know that actually this school was made due to someone’s contribution. This could motivate someone else in the village or the whole village to ponder over these things and also follow the same benevolent act in another way for the school. Thus, this method of collecting information through stories can lead to a domino effect of motivating other community members to not just start a thought-process on how to improve the schooling system in their community, but also try to emulate others who have made an impact.

The whole process of training the SMC members should be a means of consciously shaping them and the society for making a SMART[6] SDP. This particular philosophy, I feel, is missing from the whole process of training of the officers and thus, is not seen in the training of the SMC members.. I am really skeptical of the ability of such a training process to empower the community and SMC members.

The above reflection also helps us to look into two key areas for critical discussion:  

a)      The process of making the SDP using participatory techniques will ‘break the silence’ of the poor and disadvantaged sections, recognize the value of popular collective knowledge and wisdom as well as legitimize the production of knowledge by the people themselves.

b)      The process of strengthening SMC training might  fail to highlight the key techniques in adult training for learning such as linking learning to problems, linking learning to people’s goals and visions, and giving SMC members  control over decisions on training.

The government officials need to understand that the School Management Committee (SMC) is another community based institutions (CBO) which, if strengthened and empowered well, with conscious effort, can really make many of their interventions effective at the grassroots level. The whole initiative of decentralization of power at the school level can be really strengthened. Above all the SMCs have a legal validity through the RTE Act 2009. It can be another marvelous initiative to move a step forward in terms of delegation of power and resources from the upper level to the lowest level.

The government officials are currently looking at the process of formation and strengthening of SMC as a task, like any other task, and leaving a trail of data, without really looking at the human aspect of it. 

The envisaged dream of the RTE Act with regard to SMC’s functioning can only be achieved, if and only if the “Community” is conscientised. The active participation of its members in planning of SDP formation and quality monitoring is a great challenge which can be treated as an opportunity also. The RTE Act in a specific way wants to make the parents an important stakeholder in the decision-making process with an objective to make teachers and the principal more accountable for education delivery. This is envisaged for better learning outcomes of students. Thus the effort of integrating teacher and community through SMC can lead to better education system with decentralized planning and management.

The PAISA report has shown us that planning and allocation of funds as well as the timing of releasing funds and their actual receipts in schools are so problematic that whether the SDP will get the required funds at the right time is a big question. This is a persistent problem which needs a lot of bureaucratic support along with legislative advocacy for mending this problem. This process is continuous and taking place slowly but steadily. If the SDP does not get implemented due to delay of funds, then people could get de-motivated and slowly withdraw from the whole process. It is very important that SMC members are empowered to understand the constraints and take steps accordingly. Thus the whole training process should be liberating process to view things critically for better Redressal. Otherwise, I fear that with the existing training process, the SDP formation and implementation will be rhetoric bureaucratic exercise of just filling data and fulfilling the required norms without bringing any change in the community managed decision making process in education.

Through this blog, I would like my readers think about the following questions and initiate a discussion, “Whether the present Government policy and administrative structure/s provide a favorable environment for SMC to be conscientious and function effectively to achieve the goal as penned down in RTE Act?”

At the end, I feel that the soft component (Capacity Building) of the implementation of RTE cannot be ignored or taken for granted if we really want to see RTE Act moving out from the framework of implementation of schemes to enforcement of rights.


[1] To make the education system more effective and to encourage participation of parents in the decision process, a School Management Committee (SMC) will be formed in every school under the Right to Education (RTE) Act. As per the RTE Act, School Management Committee (SMC) should perform the following functions like, Monitor the working of the school; prepare and recommend school development plan, monitor the utilization of the grants received from the appropriate government or local authority or any other source, perform such functions as may be prescribed.

[2] http://www.mpsp.maharashtra.gov.in/site/Pdf/Forms/SDPform.pdf).

[3] http://righttoeducation.in/what-school-development-plan-smcs-will-prepare

[4] http://www.pedagogyoftheoppressed.com/author/

[5] https://faculty.washington.edu/markh/TC498/Readings/PRA_Manual.pdf

[6] SMART: Specific, Measurable, Achievable, Realistic and Time-bound

Vote on it

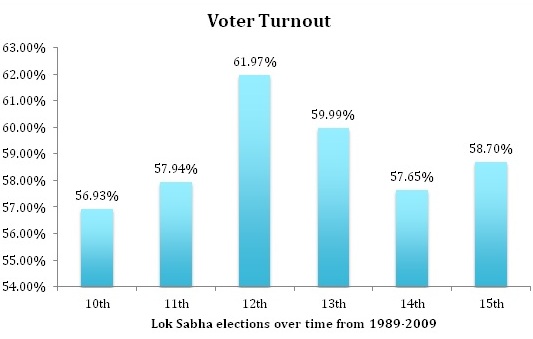
The 16th Lok Sabha elections are round the corner.  In an attempt to keep up with the times, this blog seeks to provide some insight into voter turnout trends and a theoretical model on what determines an individual’s decision to participate by voting in the election process.

Data source: Election Commission website

Based on data from the Election Commission of India, voter turnout has increased marginally from 55 % in 1971 (5th Round of Lok Sabha) to 58.7% in 2009 (15th Round of Lok Sabha Elections). In fact the highest voter turnout was in the 2nd Round at 62.2% in 1957 as per the website.

If one looks at the voter turnout in the last 5 General Elections in India, voter turnout has been around 58%.

If one was to compare our average voter turnout to developed democratic nations one finds that India has done better than the United States which has recorded an average voter turnout of 48.3 in all general elections from 1945 to 2000. In Canada the voter turnout is close to 68% for the same period.

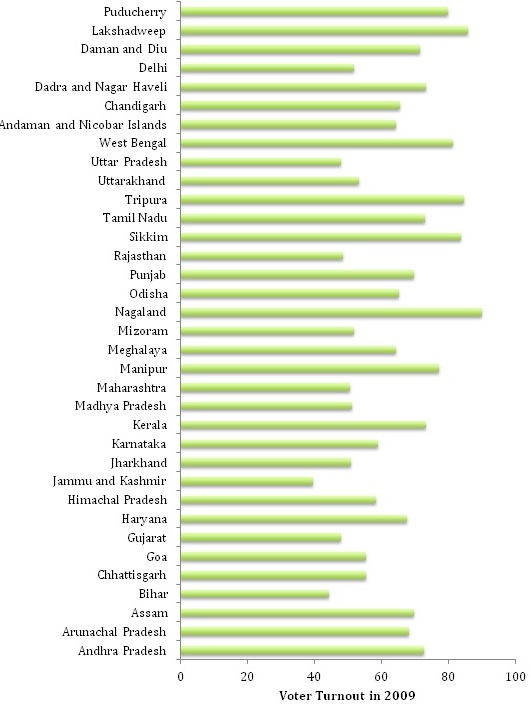
The graph below highlights the variations in voter turnout in the last General Elections (2009):

Data source : http://pib.nic.in/newsite/PrintRelease.aspx?relid=104547

In the 2009 General Elections, the Northeast region did particularly well with Nagaland recording a turnout of over 90% followed by Sikkim and Tripura which recorded an 80% plus turnout. Delhi and Maharashtra for the same period had  a voter turnout of 51.85% and 50.7% respectively.

In the same period areas in South Delhi and South Mumbai recorded low voter turnouts (around 40%) in 2009. Media discussions during that period attributed this low turnout in the Metros to political apathy and the alienation of the elite and middle class from the political process.

An article by Swaminathan S Aiyar published right after the General Election in 2009 said that no one really knows what the driving force behind voter turnout is and media analysts need not be taken so seriously. He went on to state that the drastic changes in voter turnout in the same state between two general elections (For example Bihar dropped from 58% to 44% in terms of voter turnout between 2004 & 2009 elections)  suggested that this phenomenon was not a class, caste or income behavioural issue.

There are two different traditions that seek to address the question of why individuals choose to vote. One models itself on the lines of underlying demographic, socio-economic and attitudinal characteristics, as mentioned above.

The second tradition finds its roots in public choice literature. It models voter turnout as a rational choice model.  Voters make a decision to vote or not vote based on their own self-interest.( For more on information on this model read Hindriks and Myles book Intermediate Public Economics, 2006) In terms of the economic definition of utility there are things that must be taken into consideration.

Participation in the voting process always has a cost. There is the direct cost of travelling till the polling booth and the indirect cost of the time it takes for the activity.For the purpose of simplicity, let the direct and indirect cost of voting be denoted by C

Let the expected benefit the voter derives from voting be B

Only when B-C > 0 will a voter consider voting.  This derivation comes with the precondition that the individuals involved in voting are rational utility maximizers i.e. The expected benefit from voting must exceed the cost of voting. This is a necessary condition

Understanding what this expected benefit comprises of yields some semblance of understanding voter turnout. To elaborate on what expected benefits means, let us introduce two political parties into the narrative. Let one party be called Bappi and the other Daler. Bappi promises an expected benefit in cash, kind, ideology or possible provision of public goods which amounts to E(Bappi)  and similarly Daler delivers a benefit of E(Daler).

Depending on which party provides the individual voter with a greater benefit, the individual prefers one party to the other. For simplicity lets assume the Bappi Party provides voters with a greater benefit. i.e.

E(Bappi) > E(Daler)

The expected benefit B can then be defined as the probability of Bappi winning into benefits if Bappi comes to power added with the probability that Daler comes to power and the benefits of him coming to power. Mathematically :

B = E(Bappi)* Probability of Bappi winning + E(Daler)* Probability of Daler winning

The voting paradox is this. If an individually rational voter feels that Bappi will undoubtedly come to power, then there is no reason for him to incur the cost C as he can still enjoy the benefits of Bappi coming to power. 

If the situation is reversed to where an individual knows / feels that Daler will come to power assuredly, there is still no reason for her to go out and vote. The expected Benefit under Daler is lower and going to a polling station to vote for the losing party serves no purpose.

The theory suggests, the rational voter will only choose to vote if they expect that they can affect the outcome of an election. This situation only arises when there is no clear winner in terms of the contesting parties. This occurs when the population is evenly divided amongst the contesting parties and thus an additional individual voting in favour or against a party does actually play a role.

To extend this theory let us look at what happened in Bihar between 2004 and 2009. In 2004 RJD and its allies won 26 seats while BJP and its allies won 11 seats. The voter turnout at that point was 58%.

In 2009 the results reversed. The NDA won 32 seats while the RJD won 4 seats. As the rational choice theory predicts: Nitish Kumar was the clear winner in that year and this could potentially be a reason why voter turnouts dropped to 44 % in 2009.  

The  Delhi Elections of 2013 witnessed a  voter turnout of  66 % . This was a 8 % jump from 58.7% in 2008. Unquestionably 2013 was a much closer election and had everyone interested in politics biting their fingernails.

These two examples seem to suggest that possibly the rational choice model could be in play here. It is only when voters feel that their vote could make a difference, do they come out and vote.

In the coming Lok Sabha Elections, The Election Commission of India has forecasted an expected voter turnout of 70 % , which is 12 % higher than the last General Elections.

Undoubtedly one cannot underplay the role of the media, growing political awareness, dissent amongst the youth and the rest of the country in this potential democratic upsurge.

Perhaps one could also explain this by the rational choice model, in which voters see that there is no clear winner emerging even less than a month before the first phase of voting begins and thus believe that their vote may actually count and for once actively participate in the democratic process.

Levine and Palfrey (2007) test for the competition effect on voter turnout in an experimental setting. They borrow from concepts of Game theory and Nash equilibrium and apply it to their experiment. Their analysis shows strong evidence of a competition effect i.e. The more competitive the election, the higher the voter turnout. In their study they also find that voters are highly responsive to voting costs.

One could test for rational choice theory in India and see whether there is evidence of its existence by doing a constituency / state wise study of the candidates in the upcoming elections and comparing it with previous Lok Sabha elections. As a starting point one could simply check the correlation between the margins by which a party won and the voter turnout. However testing for rational choice would require a more in –depth study than just citing a few examples as presented in this blog to see whether this theoretical model is actually applicable in the Indian context.

References :

  1.  The Public Justice Report : Voter Turnout and Competitive Politics , 2000 David T Koyitz : http://www.cpjustice.org/stories/storyReader$509
  2. Election Commission India website : http://eci.nic.in/eci/eci.html
  3. Statewide Analysis of 14th Lok Sabha Elections : CSDS Team http://www.sciencespo.fr/ceri/sites/sciencespo.fr.ceri/files/elections.pdf
  4. Swaminomics Blog :http://swaminomics.org/fallacies-about-voter-turnout/
  5. Hindriks, Jean, and Gareth D Myles. Intermediate Public Economics.The MIT Press, 2006
  6. Levine, David K and Thomas R. Palfrey. The Paradox of Voter Participation? A Laboratory Study, The American Political Science Review, Vol. 101, No. 1 (Feb., 2007), pp. 143-15

For RTE grievances dial 1

An essential pre-requisite to any rights-based approach is the necessity of ensuring its enforceability. What does a citizen do in case their rights are violated or not adhered to? Who does one complain to if the right is not being implemented? Despite two and a half years since the passing of the Right to Education (RTE) Act, the state is still struggling to come up with effective grievance redressal mechanisms (GRMs) for the Act.

As a concept, GRM’s have been a part of several policy conversations. In April 2011, the then Hon’ble Minister of Human Resource Development, remarked about the need for a roadmap for time bound redressal of grievances. The move came around 3 weeks after the National Commission for Protection of Child Rights (NCPCR) – who is the top referee for RTE disputes and complaints raised concerns over the lack of clarity of roles of different implementing agencies. One year later, in a conference of State Secretaries held in New Delhi, GRMs were “an important part of the agenda”. States were requested to set up effective GRMs to address the complaints of the stakeholders in a time bound manner.

At another review of the implementation of the RTE Act earlier this year, the then HRD minister suggested that the GRM should publicly list out legal entitlements guaranteed under the RTE Act. This information could be made available on school and panchayat walls along with a list of designated officers for each of these entitlements. It was suggested that the maximum time within which a complaint should be addressed be limited to 3 months, with specific complaints being assigned different time-bound actions.

However, while the centre has left the exact nature and formation of the GRMs to the states prerogative, there continues to be a lot of confusion regarding the same. The result – a large number of complaints remain unsolved and probably even more, remain unreported. In fact, according to a newspaper article, a RTI filed revealed that over the last two years, NCPCR received 2,850 complaints regarding the RTE Act. However, it has been able to resolve just 692 cases, or just 24 per cent. If one is to look at the year wise numbers, from April 1, 2010, to March 31, 2011, the commission received 1,089 complaints, of which it resolved 592 cases. While in the second year, till March 16, 2012, the commission could solve only 100 of the total 1,761 complaints received.

What does the RTE Act say?

According to Chapter VI of the RTE Act, complaints can be registered at the Gram Panchayat or Block Education Office. Any person having a grievance can thus register a written complaint to the local authority. After receiving the complaint, the local authority shall decide the matter within 3 months.

As mentioned earlier, the NCPCR is the highest body for Grievance Redressal. In addition, all states are supposed to set up a State Commission for Protection of Child Rights (SCPCR) and within six months constitute Right to Education Protection Authority (REPA) which should later be formed as a part of the SCPCR. However, the 2nd Year of RTE report states that only 20 states had constituted the SCPCR by March 2012. Large states such as Andhra Pradesh, Kerala, Tamil Nadu and Uttar Pradesh were still “in the process” of constituting the SCRCR.

Finally complaints can also be taken to the courts, as education is now a justiciable fundamental right of all children in the age group 6-14 years.

Other methods of GRM’s facilitated by the NCPCR have included, social audits (12 have been conducted till date), public hearings(8) and publicity campaigns. In addition, the RTE monitoring cell of the NCPCR has set up an online primer on various issues under the RTE act, but it seems to be a work in progress.

Main Issues/Concerns

There are many problems with the current (and slightly vague) system of GRMs.

First, there can be no specific officer in-charge for different types of violations. For example, a teacher not showing up to school and the money for civil works not reaching the school would fall under the purview of different officers. This can lead to confusion as to whom to approach regarding one’s specific complaint. Moreover, the opportunity cost of being redirected to different people for one complaint is often too high.

Second, there are a large number of ministries and departments that would need to work in coordination. For example, provision of toilets is the responsibility of the Total Sanitation Campaign, water falls under the Accelerated Rural Water Supply Programme; the provision of Mid-Day Meal (MDM) schemes under the MDM directorate. Even within the SSA department there would be different programme officers responsible for specific activities. In fact, in 2010-11, cases before the NCPCR ranged from juvenile justice, child labour, corporal punishment, non-functional toilets, denial of admission, sexual abuse, child health and nutrition. (Ministry of Women and Child Development, Annual Report, 2010-11)

Third, a common problem is that government officials change frequently. So, having the name and number of a specific officer painted on a school wall may become irrelevant in a few months if the officer is transferred.

Finally, even if you actually do manage to file a complaint, another important issue is that of anonymity. A parent wanting to complain against a teacher is often worried about the consequences his complaint may have on the children studying in the school; or a teacher complaining against a Headmaster could face the wrath of the HM after the complaint.

A possible solution

Given these concerns, one possible solution can be utilizing mobile and computer aided technology. We all remember the headline that read– India has more mobile phones than loo’s”. Why not harness that technology to enable an effective GRM?

I therefore propose the creation of a toll-free number where citizens could phone in and be directed (at the click of a number) to the relevant department for their specific problem. This is not something new. The Delhi government for instance has computerized the registration of complaints for telephone connections, electricity and even gas cylinders. Now-a-days if I need to order a replacement cylinder – I just need to call from my registered mobile, press 1 for refill or 2 for leakage and I am good to go. Once the “backend” of the system is set up, the onus on coordinating with different departments no longer falls on the complainant. One can thus be assured that the complaint reaches the specified department/official without facing the wrath of the person being complained about!

An interesting step in this regard has recently been taken in Assam. With a view to check absenteeism among teachers in public schools, the education department unveiled a School Teachers’ Attendance Monitoring System which empowers parents and guardians to report absenteeism among teachers via a helpline. This is a great first step. If this idea could be extended to cover other violations and other states such that a computerized system could automatically redirect the query to the relevant department, maybe we’d finally be closer to achieving the “missing R” in RIGHT to Education.

How is Janani Suraksha Yojana performing in backward districts of India? – Part 2

As mentioned previously, this blog post discusses the findings from the PAHELI survey with respect to the JSY.

1. Institutional and home deliveries

Out of 3178 deliveries, 48% deliveries took place in government facilities, 9.5% in private facilities, and 42.5% deliveries took place at home (table 1A)[1]. The proportion of deliveries in government facilities is highest in Sundargarh and Rajgarh, followed by Udaipur. Korba, Gumla and Hardoi perform the worst.

There has been a substantial decline in the proportion of home deliveries as compared to District Level Household Survey (DLHS) III, which is the latest available household-level data on maternal health[2]. Yet, the proportion remains quite high.

2. Receipt of cash benefits

As per the scheme guidelines, all women delivering in government medical facilities are entitled to the monetary incentives. However, only women from BPL families can avail of the benefits in case of deliveries in accredited private facilities or at home in the presence of skilled personnel.

The data indicates that 94.5% of women delivering in government facilities receive monetary compensation. In fact, this proportion is above 90% in all eight districts, with Udaipur (98%) and Sundargarh (97.5%) performing the best (table 1A). But only 11% of women on average delivering at home report receiving money. Rajgarh (31%) and Sundargarh (25%) have the highest proportion of women getting benefits after a home delivery.

3. Location of receipt of benefit in case of deliveries in government facilities

Payment to JSY beneficiaries should be paid at the institution itself. As per our data, 95% of the beneficiaries report that payment was indeed made at the institution (table 1B). With the exception of Sundargarh, the proportion is more than 91% in rest of the districts.

4. Mode of Payment

As per the JSY guidelines, payment is to be given through account payee cheques. 86% of the beneficiaries delivering in government facilities report receiving payment through cheques (table 1B). The proportion was highest in Hardoi (97%) and lowest in Bhilwara (76%). The proportion of beneficiaries receiving payment through cheques was lower in the case of private facilities (72%) and even lower (35%) in the case of home deliveries.

5. Payment in Installments

JSY guidelines explicitly say that the payment to the beneficiary should be made in one installment. The data indicates that in the case of deliveries in government facilities, 89% of the JSY beneficiaries received payment in one installment (table 1B). This proportion varies from 96% of beneficiaries in Sundargarh to 79% in Gumla.

6. Amount Received

Women delivering in government medical facilities receive payments as per the norm, an average of Rs. 1451, while the median amount is Rs. 1400 (table 1B). Average payment amounts are above Rs. 1500 in Gumla, Korba and Udaipur, and below Rs. 1400 in Sundargarh, Hardoi and Rajgarh.

Women delivering at home receive Rs. 859.47 on an average, while women delivering in private facilities receive Rs. 1504.39[3].

7. Delays in receiving compensation

60% of beneficiaries who deliver in government facilities report receipt of benefits within seven days, while 71% report receiving benefits within two weeks (table 1A). Udaipur performs the best, with 93% of the beneficiaries reporting receipt of benefits within two weeks. Gumla performs the worst on this indicator, with only 24% beneficiaries receiving benefits within two weeks.

Overall, the median days to receive benefits in case of delivery in government facilities is four, while the mean number of days is ten[4]. On an average, beneficiaries in Udaipur, Sundargarh and Rajgarh can expect to receive their benefits within a week, while those in Gumla might have to wait up to a month.

In case of delivery in private facilities, beneficiaries reported receiving money, on an average, ten days after delivery. The delays seem to be even higher for payment in case of home deliveries: on average, 23 days after the delivery (table 1B)[5].

8. Payment of bribes to receive JSY benefits

Only 6% of the beneficiaries who delivered in government facilities reported that they had had to pay bribes to receive the money (table 1B). Bhilwara (1%), Gumla (2%) and Sundargarh (4%) are the best performers, while Rajgarh is the worst performer with 13% of the beneficiaries reporting that they had to pay a bribe.

9. Other problems

But having to pay a bribe is not the only problem beneficiaries might have to face. When one takes into account other problems (such as, distance to the health facility, paper work, inconvenient timings, behaviour of health workers), the proportion rises. Data indicates that 18% of the beneficiaries in case of deliveries in government facilities reported facing one or more of these problems (table 1B). The proportion was lowest in Sundargarh (8%) and Bhilwara (9%), and highest in Hardoi (31%) and Gumla (28%).

The corresponding fractions are 27% in case of delivery in private health facilities and 29% in case of home deliveries.

The above discussion suggests that JSY is working reasonably well as far as some of the important process-related indicators are concerned. But there is scope for improvement, especially when it comes to delays in transferring benefits, payment of bribes and other problems faced in receiving the benefits.

In Part III, we’ll look at indicators related to the performance of ASHAs.

TABLE 1A: JSY-related indicators

Location of delivering the baby RJ JH UP CH BH MP OR Overall
Udai-  pur Bhil-wara Gumla Hardoi Korba Nal-anda Raj-garh Sundar-garh
Sample size (households)  1120 1334 1190 1180 1176 1065 1178 1162 9405
% of women delivering the baby Home 33.33 46.05 58.37 55.38 65.81 28.37 21.91 24.31 42.54
Government Facility 61.35 43.05 35.90 37.00 22.88 51.06 69.77 70.49 47.99
Private Facility 5.31 10.90 5.73 7.62 11.31 20.57 8.31 5.21 9.47
No. of Respondents 414 367 454 446 389 423 397 288 3178
Home
(DLHS III)
67.30 66.10 90.80 90.00 90.80 65.40 54.10 66.00
% of home deliveries in the presence of skilled personnel (dai/ doctor)  82.26 60.78 82.19 64.56 65.22 74.75 38.89 58.33 68.78
% of Women receiving money Home 5.69 5.07 13.30 2.83 13.81 14.00 30.77 25.00 11.34
Government Facility 98.02 92.41 90.12 93.33 92.05 93.02 95.62 97.50 94.52
Private Facility 14.29 27.78 50.00 13.79 47.73 9.46 38.46 21.43 25.94
No. of Respondents 397 332 402 406 371 389 365 274 2936
% of JSY beneficiaries receiving incentives after delivery in government facility 7 days post-delivery 89.36 78.17 19.12 35.33 37.97 43.01 67.78 78.57 60.42
 

14 days post-
delivery


92.77 84.51 24.26 51.33 50.63 55.38 84.94 89.01 70.87


Variable Government Institutions Govt. Private Home
RJ  JH  UP  CH  BH  MP  OR  Overall (sample average)
Udai-pur Bhil-wara Gumla Hardoi Korba Nalanda Raj-garh Sundar-garh
% of beneficiaries receiving money at the institution 99.19 93.06 91.85 96.1 93.59 96.48 98.05 85.8 94.89 90.16 55.34
% of beneficiaries receiving money through cheque 88.07 76.22 81.43 96.71 85 80.51 90.7 85.08 85.99 71.67 35.35
% of beneficiaries receiving money in one installment 93.06 93.01 78.87 93.51 82.5 92.93 82.31 95.56 89.37 90.16 55.34
Mean amount of benefits received (Rs.) 1532.22 1458.86 1571.43 1388.82 1553.12 1403.52 1399.61 1381.28 1451.25 1504.39 859.47
Mean & (Median) no. of days post-delivery to receive money 4.25
(3)
7.13
(3)
29.07
(25)
14.61
(10)
14.09
(11)
14.67 (10) 6.10
(3)
4.79
(2)
10.43
(4)
10.1
(5)
23.42

(15)

% of beneficiaries reporting payment of bribe to receive money 4.56 1.49 2.19 7.95 5.19 8.63 12.6 3.57 6.4 0.0 5.56


[1] Proportion of home deliveries that we find is substantially higher than 19% as reported by the MIS of NRHM.

[2] Respondents in DLHS III are woman who had given birth to a child after January 1, 2004 onward (IIPS, 2010).

[3] We don’t discuss here the possible reasons for average amount received being higher than the norm.

[4] Median numbers of days are indicated in brackets.

[5] The number of respondents in case of delivery in private facilities and home deliveries are relatively less and hence, these numbers should not be treated as representative.

Highlights from the CAG Performance Audit of MGNREGA

Launched in 2005-06, the Mahatma Gandhi National Rural Employment Guarantee Act is Government of India’s most expensive flagship scheme costing Rs. 192322.33 crores since its launch[1].However, despite 7 years of operation, the latest performance audit by the Comptroller and Auditor General (CAG)[2] – points to the same implementation inefficiencies consistent with most social sector programmes[3].

Some of the findings of the CAG are highlighted below:

Inefficient Planning

According to the MGNREGA guidelines, the responsibility for the implementation of the scheme and the primary unit of planning is the Gram Panchayat (GP). Annual plans made by the GP, are consolidated first at the block and then at the district level to prepare the district plan/labour budgets. These labour budgets are an important basis for estimating employment to be generated and also form the basis of fund allocation to states/UTs. The CAG audit however found a number of inefficiencies with this planning process. These included:

  • In 1201 GPs (31% of the sampled GPs) across 11 states, annual plans at the GP level were either not prepared or prepared in an incomplete manner. Interestingly, in 3 states, including Andhra Pradesh – none of the sampled GPs had made annual plans.
  • District Labour budgets were not prepared in 49 districts (26% of sampled districts).
  • Even when plans were made – they did not always have the requisite information. In 58 districts (31%) – the projected employment generation wasn’t included. Many plans also did not include the shelf of works or list of assets to be built.
  • The CAG also noted significant delays at every level in the submission of the annual plans. Delays were highest at the GP level –difference between the target date of submission to the block and actual submission ranged from 1 month to as high as 21 months!

Shortfall and Delays in Execution of Works

The effectiveness of the planning has to be measured against the actual execution.

  • The audit report observed large variations in some states between planned employment generations (as per the labour budget) and actual employment generated. ( See Table 1 for more details)

Table 1: Shortfall between actual employment generated and projections in the labour budget

S. No.

State/UT

Range of shortfall

1. 

Bihar

27% – 98%

2. 

Gujarat

2% – 62%

3. 

Jharkhand

40%-59%

4. 

Madhya Pradesh

27%-94%

5. 

Maharashtra

30%-100%

6. 

Rajasthan

13%-50%

7. 

Tamil Nadu

17%-59%

Source: Table 5 of the report

  • Moreover, in 14 states and 1 UT , 129.22 lakh works amounting to Rs. 126,961.11 crore were approved in the annual plans but only 38.65 lakh works ( 30% of planned works) amounting to Rs. 27,792.13 crore were completed during the audit period indicating significant inefficiencies in implementation of annual plans. In fact, in 25 sampled districts, across 9 states – 4,907 works amounting to Rs. 158.83 crores was executed outside the annual plans

Human Resource Shortfall and Capacity

The MGNREGA guidelines envisage Gram Rozgar Sahayaks (GRS) appointed at the village level to assist the GP in the implementation of the scheme. These GRS are responsible for maintaining all documents, overseeing the process of registration, distribution of job cards, allocation of works, payment of wages and ensuring monitoring of the scheme through social audits.

  • The audit report found widespread shortages in GRS posts across 9 states ranging from 20% in Uttar Pradesh to as high as 93% in Punjab. In 4 states including Tamil Nadu and Kerala no dedicated GRS had been appointed.
  • Further, funds for training personnel were highly underutilised in many states. In Uttar Pradesh for instance, 74% of funds for training in 2010-11 had not been utilised.

Delays, shortfall in release of funds

As with other schemes[4], the last few years has seen an increasing gap between allocations made for MGNREGA and the actual release of funds. (See table 2 for more details)

Table 2: Difference between Allocations (BE) and Actual Release of Funds


Allocation (Budget Estimates (BE))

Actual Release

2007-08

12000

12661.22

2008-09

16000

30000.19

2009-10

39100

39539.38

2010-11

40100

35841.49

2011-12

40000

29215.05

Source: Chart 8 of the report

Funds for MGNREGA are to be released in two instalments by GOI. The first tranche is based on the percentage of persondays projected for the first six months of the year in the labour budget (not exceeding 50% of the total approved budget). The second instalment is released only after utilising 60% of the previous funds released and, submission of Utilization Certificates (UCs) of the previous years. The audit however observed instances of:-

  • Release of an additional 10% of approved allocations by GOI in some states. Further, excess funds of Rs. 2374.86 crores were released to six states either due to wrong calculations or without taking into account balances available in these states. Further, in 2010-11, GOI released Rs. 6,733.25 crores to states without taking into account the unspent balances of Rs. 10,104.71 crores as on 31st March 2010. Similarly, in 2011-12, GOI released Rs. 2,440 crores to four states without taking into account unspent balances amounting to Rs. 3758.91 crores.
  • Funds (amounting to Rs. 4072.99 crores) were also released by GOI for the next financial year in March of the previous year.
  • With respect to state shares, the audit found instances of shortfall in release of state share amounting to Rs. 456.55 crores between 2007 and 2012. In a number of instances, delays in the release of state share ranged from only 3 days to as high as 354 days.  (See annex 5E of the report for more details).


Specific problems related to wages and MGNREGA works

Below are some of the problems specific to the implementation of MGNREGA.

  • Job cards were not issued to 12,455 households in six states. Photographs on 4.33 lakh job cards (an important identifier against fraud and misrepresentation) were missing in 7 states. Non-payment or under payment of wages of Rs. 36.97 crores was noticed in 14 states. In 55 GPs, payment was made in cash violating the guidelines which prescribes payment through banks or post offices. Other issues included, suspected misappropriation of wages through engagement of ghost works, incomplete or improperly filled “muster rolls” non-payment of unemployment allowance, delays in receipt of wages, amongst others
  • While the guidelines prescribe that the material cost should not exceed 40% of the total work cost, in 12 states and 1 UT, the material cost was seen to be exceeding the prescribed level by Rs. 1,594.37 crores.
  • Moreover, 1,02,100 inadmissible works amounting to Rs. 2,252,43 crores were undertaken. A significant number of works (amounting to Rs. 4070.76 crores) have also remained incomplete for a long time.

Record Keeping and Monitoring

  • The audit found poor record maintenance at not just the GP level but also at the block and district levels. Deficiencies relating to both non-maintenance and/or incorrect maintenance of prescribed basic records were noticed in 18%-54% of all tested GPs.
  • While rules require state governments to identify or establish independent social audit units to facilitate the process of conducting regular social audits – in 10 states and 4 UTs, these units had not been constituted. Moreover, in 11 states, significantly fewer social audits had been conducted than as prescribed by the norms.
  • Further, monitoring at all levels (including central level) was found to be unsatisfactory.

Beneficiary Analysis

Finally, the audit report also analysed the correlation between rural poverty and the average number of households provided employment during 2009-10 till 2011-12. While at an aggregate level, the report found that there appears to be a correlation between poverty and employment given under MGNREGS, there were some notable exceptions. Bihar, Maharashtra and Uttar Pradesh which together accounted for 46% of the rural poor[5] utilised only 20% of GOI funds.  In contrast, Andhra Pradesh, Chhattisgarh, Rajasthan, Tamil Nadu and West Bengal utilised more funds as compared to their poverty levels.

The report further sampled 38,376 beneficiaries across 27 states to assess their perception, awareness and experiences with the scheme. The main highlights from this survey are given below:-

  • While at an all India level the total women beneficiaries is 33% (as per the norm), this ratio was less than 1/5th in Gujarat, Madhya Pradesh, Odisha, Uttar Pradesh, West Bengal, Jammu and Kashmir and Mizoram.
  • On average about 72% of beneficiaries were aware of the number of days of employment to which they were entitled. Awareness levels were highest in some of the smaller states/UTs – Kerala, Meghalaya, Mizoram, Tripura and Pondicherry. In contrast, it was 28% in Gujarat, 43% in Odisha, 52% in Bihar and 57% in Maharashtra.
  • Around 70% of respondents were aware of the timeliness within which wages are to be paid.
  • Only half of the interviewed beneficiaries were aware of the prescribed quantum of work which entitled them to full wage payment. Similarly only around 56% were aware of the manner of wage calculations.
  • A positive finding was that on average work was provided after 9 days of the job request (the guidelines say within 15 days of job application). However 99% of beneficiaries who were not provided work within 15 days were not paid the unemployment allowance.
  • 78% of beneficiaries reported that muster rolls were maintained at the work site and attendance was marked on it.
  • 65% reported that they received wages within 15 days, 16% within 1 month, 11 % between 1-2 months, 4% within 2-3 months and 2% reported delays of more than 2 months.
  • A significant number of cash payments were reported in Tamil Nadu (98%), Arunachal Pradesh (73%) and Meghalaya (70%).


For more details please see:

http://saiindia.gov.in/english/home/Our_Products/Audit_Report/Government_Wise/union_audit/recent_reports/union_performance/2013/Civil/Report_6/Report_6.html


[1] The figure is the actual expenditure from 2006-07 till 31/12/2012. Calculated from: Ministry of Rural Development, MGNREGA, Report to the People, February 2013. Available online at: http://nrega.nic.in/netnrega/WriteReaddata/circulars/Report_to_the_people_English2013.pdf

[2] The audit covers the period from April 2007 to April 2013 and across 182 districts, 458 blocks and 3848 Gram Panchayats across 28 states and 4 Union Territories. The audit is available online at:http://saiindia.gov.in/english/home/Our_Products/Audit_Report/Government_Wise/union_audit/recent_reports/union_performance/2013/Civil/Report_6/Report_6.html

[3] For more details on performance of social sector schemes, please see Budget Briefs. Available at: http://www.accountabilityindia.in/expenditure_track

[4] For instance, in Sarva Shiksha Abhiyan, out of the total approved plans (GOI and state) of Rs. 61.722 crores, only 69% was released.

[5] Based on poverty estimates by the Planning Commission

The Case of the Missing Records

If you have ever visited a government office, you would have been astounded (like I was) to see numerous files stacked in dingy offices, gathering dust. Yet, there often appeared to be a method to the madness and if you requested for a file, it was easily pulled out.

Despite this, in recent years there seems to be growing number of cases where records go “missing”.

I first became aware of this “strange” phenomenon when we started working on the PAISA Project. As you all must be aware by now, through the PAISA Project we analyse government documents at different levels (Government of India (GOI), state and district) and complement that with school-level surveys in order to ascertain the following: How do funds flow through the system? Is money utilised? When is it utilised and how are funds spent?

We have received a decent “success rate” in gaining access to documents at the GOI, state and district levels. With the exception of a few stray cases where the relevant authority at the district level was transferred along with access to all the important documents at the district level (we were told that only he had the password and without the password, the new official was unable to access any of the documents), if the data exists, it has been given. (Data not existing at all is another problem altogether and more details on that are available here.)

However, the greatest number of issues seems to come about at the school level. During our surveys, we request to see passbooks, registers, utilisation certificates and cashbooks. Interestingly, we seem to have encountered numerous cases of “passbooks being stolen”, “passbooks lost in floods”, cashbooks “burnt” in kitchen fires!

This got me wondering…Was the inability to get records the fault of our surveyors (i.e., did we not ask the question correctly, did our surveyors not probe enough, etc.), or was it something deeper? Preliminary research suggests that in recent years, the frequency of these cases being reported (probably due to the greater use of the Right to Information (RTI) Act and rising citizen engagement with government records) has increased. So here are some of the stories:

  • In February 2012, Lokayukta Justice Manmohan Sarin asked for all records from the Delhi Government’s Urban Development Department relating to a case on an unauthorised colony in Wazirpur village. The village had been allegedly granted illegal provisional regularisation certificates by the then urban development Minister, ahead of the 2008 assembly elections. In the complaint, it had been alleged that the land was issued based on forged and incomplete applications and the provisional certificate had been signed by the Minister. The result: the Lokayukta was informed that the file regarding the colony could not be traced “despite all efforts”!
  • In March 2012, an RTI application requested records from the Prime Minister’s Office (PMO) pertaining to the imposition of the Emergency in India in 1975. The PMO’s office however stated, “a thorough search was made to retrieve, trace records of correspondence between the then Prime Minister and the President of India relating to proclamation of emergency. However, no such records were found in the PMO (Prime Minister’s Office).”
  • It is hard to put a date to the missing records in the Adarsh Society housing scam. The Adarsh Society, originally meant to be a six-storey structure to house Kargil war heroes and war widows, was converted into a 31-storey building, violating a number of laws. The flats were allotted to bureaucrats, politicians’ relatives and defence officers at artificially lower prices. Between 2010 and 2012, there have been more than four instances of crucial documents going missing. The first entailed important file notings dating August 30, 2009 and November, 1, 2010, going missing from Maharashtra’s Urban Development Department office. This was subsequently followed by important papers “disappearing” from the Ministry of Environment and Forests. Another set of papers went missing from the Army Headquarters in Mumbai. In June 2011, maps and some survey sheets from 1872-1960 related to Adarsh land were untraceable from the land records office of the Mumbai. According to a recent Indian Express article, the Central Bureau of Investigation (CBI) has hit a roadblock in its investigations to look for the missing records and is currently weighing the options of closing the investigations.
  • A similar problem was faced during the auditing of the National Rural Health Mission (NRHM) scheme in Uttar Pradesh by the Comptroller and Auditor General’s office. The report states that “in many cases during the course of the audit, it was informed that records were either not available in full or not available at all and in quite a few instances, original records had not been maintained, particularly relating to Accounts.” For instance, records from the Director General, National Programmes, Monitoring and Evaluation from 2005-06 to 2006-07 amounting to Rs. 1277 crores were not available. Even at the district level, records from 2005-06 to 2008-09 related to medicine and equipment purchase, utilisation certificate and stock position in two Community Health Centres in Lucknow were not traceable. Similarly, cashbooks, ledgers, passbooks, tender, quotation and purchase files, bill registers, stock and voucher book from April 2005 to December 2006 for the Reproductive and Child Health-II and from April 2005 to August 2008 for the Routine Immunization Programme in Kanpur Nagar, Uttar Pradesh were also missing. (more details available here)

These are just some of the bigger examples that have come to light in the recent past in relation to “missing” records containing valuable information (and interestingly, often in relation to scams!).

In fact, according to the Public Cause Research Foundation (PCRF) which had analysed orders passed by various information commissioners at the national and state level – in many cases government officials had refused to provide information sought under an RTI application, due to “missing documents.” According to a member of the PCRF, “during 2010, Information Commissioner Shailesh Gandhi, who handles Departments pertaining to Delhi, had received as many as 30 such cases and ordered filing FIRs in 28 cases.” (Hindustan Times, February 2011).

Moreover, in a significant Judgement, the Division Bench of the Hon’ble High Court of Jharkhand, has held that, in cases where a department is required to keep a record but it is not available or missing, then it should be reconstructed. It is also “within the jurisdiction of the authorities under the Right To Information Act to direct the office to reconstitute the record…” (link to the judgement available here).

Insistence on filing FIR’s immediately upon theft/destruction and reconstruction of lost records are just some steps to ensure greater accountability. However, the question still arises as to who is held accountable if valuable records go missing and how do we ensure that the “reconstruction” itself is accurate. In this day and age of digitisation and cloud storage, it feels strange that often the lack of records is the main hindrance in ensuring due process and accountability. In fact, I am reminded of my days of college where the crashing of a hard drive just before submission of papers was not reason enough to ask for an extension. Instead, you had to deal with the consequences. As more and more such cases come to light, it feels like time has come to remove the “dust” from the files and figure out a better system of maintaining records such that the person who claims its loss/destruction is held accountable for it.

The Curious Case of Unspent Funds

Every year the week before and after the budget, debates across all media channels and civil society tend to focus on “allocations” – how much money has been allocated for Sarva Shiksha Abhiyan? What is the jump in allocations for rural development? How much is health getting? But amidst the outcry on allocations, the most important question that seems to get lost is, how was last year’s money actually spent?

A week before the budget was announced, newspapers carried a startling finding by the Comptroller and Auditor General – that “Rs. 1 lakh crore budget funds go unspent every year”. But in the midst of the attention given to allocations, the story and along with it the attention towards unspent funds, somehow disappeared.

According to the CAG report, in 2007-08, under 97 grants of civil ministries, there was an unspent provision of Rs. 1,08,000 crore. The report was based on the findings by the Comptroller and Auditor General (CAG) based on the accounts of 2005-2007. The following table from the Times of India (TOI) summarizes some of the CAG findings. For those interested in going deeper into the report, click here

Unspent funds are indeed a curious thing and broadly there are a few things that continue to perplex me and may be some of the keys to this mystery.

First, The Flow of Funds:
In recent years, there has been a paradigm shift in the Union Government’s strategy for implementation of flagship programmes and other centrally sponsored schemes (CSS) for poverty alleviation, health care, education, employment, sanitation etc. Most of these schemes were initially implemented on a cost sharing basis with transfer of central share to state government. Now, the Union Government has started transferring their share directly to state/district level autonomous bodies, societies and ngos for implementation of CSS without devolving funds through the state government accounts.

As the CAG report states, “For the year 2007-08, Union Government made a provision for transfer of central plan assistance of Rs. 51259.85 crore (as per revised estimates) directly to these state/district level societies…. Expenditure in the accounts of these implementing agencies is kept outside Government accounts not readily ascertainable.” So basically, we have no real idea about the amount of actual expenditures being undertaken and even the expenditure reflected in the accounts is to that extent, overstated. How will we develop proper mechanisms to monitor these flows of funds? If “society” funds are outside the ambit of the government accounts – where is the transparency?

Second, Timings of disbursements:
Why is it that funds continue to be released in the last few quarters of the financial years? In education, 63% of SSA funds were spent in the second half of FY 2008-09. Even the CAG report noted delays in funds in FY 2007-08. The table below summarizes some of their findings:

What is worse is that we don’t seem to have learnt from past mistakes. According to the TOI report, even the Union Government’s monthly accounts for the current year, reveal that some of the ministries’ expenditure till December 2009 was not more than 50% of the annual budget, though only 3 months remained for the end of the financial year. All this is despite the fact that on the Public Accounts Committee’s recommendations, the Ministry of Finance issued instructions to all Ministries/Departments to restrict their expenditure during the last quarter of the financial year to 33% of the budget amount.

Finally, Trends:
Why is it that some states spend more than others? For example in FY 2007-08, while Rajasthan and Chhattisgarh spent over 90% of the allocated funds for SSA, Madhya Pradesh and Bihar spent 57% and 42% respectively. Similarly in health, in FY 2008-09, Madhya Pradesh and Uttar Pradesh spent more than 90% in FY 2008-09, while Bihar spent 66% and Orissa spent 75% of total funds available.

And finally, is it easier to incur expenditure on some items more than others? or why do some expenditure items get spent more than others? Why do untied grants in National Rural Health Mission hardly get spent (Bihar spent 11% and Himachal Pradesh spent 37% of untied funds available). In education, why is it that items like infrastructure and teacher salaries get spent more than teacher trainings or innovation grants?

I don’t have the answers, but it’s time we at least start asking the questions!