

Vote on it
18 March 2014
The 16th Lok Sabha elections are round the corner. In an attempt to keep up with the times, this blog seeks to provide some insight into voter turnout trends and a theoretical model on what determines an individual’s decision to participate by voting in the election process.
Data source: Election Commission website
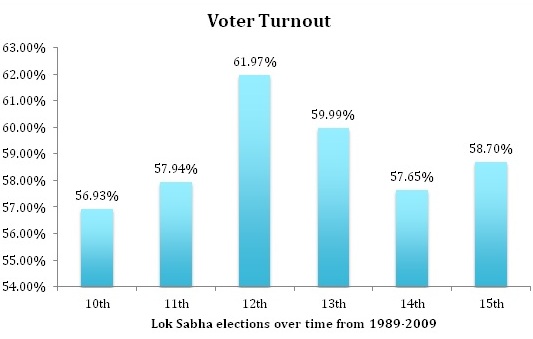
Based on data from the Election Commission of India, voter turnout has increased marginally from 55 % in 1971 (5th Round of Lok Sabha) to 58.7% in 2009 (15th Round of Lok Sabha Elections). In fact the highest voter turnout was in the 2nd Round at 62.2% in 1957 as per the website.
If one looks at the voter turnout in the last 5 General Elections in India, voter turnout has been around 58%.
If one was to compare our average voter turnout to developed democratic nations one finds that India has done better than the United States which has recorded an average voter turnout of 48.3 in all general elections from 1945 to 2000. In Canada the voter turnout is close to 68% for the same period.
The graph below highlights the variations in voter turnout in the last General Elections (2009):
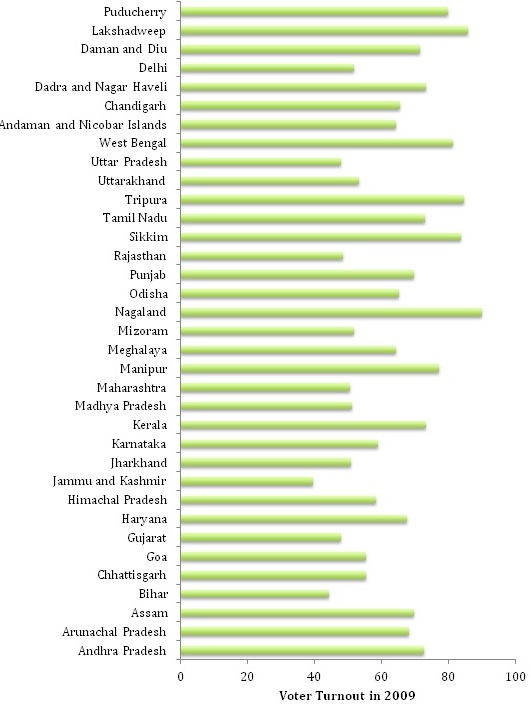
Data source : http://pib.nic.in/newsite/PrintRelease.aspx?relid=104547
In the 2009 General Elections, the Northeast region did particularly well with Nagaland recording a turnout of over 90% followed by Sikkim and Tripura which recorded an 80% plus turnout. Delhi and Maharashtra for the same period had a voter turnout of 51.85% and 50.7% respectively.
In the same period areas in South Delhi and South Mumbai recorded low voter turnouts (around 40%) in 2009. Media discussions during that period attributed this low turnout in the Metros to political apathy and the alienation of the elite and middle class from the political process.
An article by Swaminathan S Aiyar published right after the General Election in 2009 said that no one really knows what the driving force behind voter turnout is and media analysts need not be taken so seriously. He went on to state that the drastic changes in voter turnout in the same state between two general elections (For example Bihar dropped from 58% to 44% in terms of voter turnout between 2004 & 2009 elections) suggested that this phenomenon was not a class, caste or income behavioural issue.
There are two different traditions that seek to address the question of why individuals choose to vote. One models itself on the lines of underlying demographic, socio-economic and attitudinal characteristics, as mentioned above.
The second tradition finds its roots in public choice literature. It models voter turnout as a rational choice model. Voters make a decision to vote or not vote based on their own self-interest.( For more on information on this model read Hindriks and Myles book Intermediate Public Economics, 2006) In terms of the economic definition of utility there are things that must be taken into consideration.
Participation in the voting process always has a cost. There is the direct cost of travelling till the polling booth and the indirect cost of the time it takes for the activity.For the purpose of simplicity, let the direct and indirect cost of voting be denoted by C
Let the expected benefit the voter derives from voting be B
Only when B-C > 0 will a voter consider voting. This derivation comes with the precondition that the individuals involved in voting are rational utility maximizers i.e. The expected benefit from voting must exceed the cost of voting. This is a necessary condition
Understanding what this expected benefit comprises of yields some semblance of understanding voter turnout. To elaborate on what expected benefits means, let us introduce two political parties into the narrative. Let one party be called Bappi and the other Daler. Bappi promises an expected benefit in cash, kind, ideology or possible provision of public goods which amounts to E(Bappi) and similarly Daler delivers a benefit of E(Daler).
Depending on which party provides the individual voter with a greater benefit, the individual prefers one party to the other. For simplicity lets assume the Bappi Party provides voters with a greater benefit. i.e.
E(Bappi) > E(Daler)
The expected benefit B can then be defined as the probability of Bappi winning into benefits if Bappi comes to power added with the probability that Daler comes to power and the benefits of him coming to power. Mathematically :
B = E(Bappi)* Probability of Bappi winning + E(Daler)* Probability of Daler winning
The voting paradox is this. If an individually rational voter feels that Bappi will undoubtedly come to power, then there is no reason for him to incur the cost C as he can still enjoy the benefits of Bappi coming to power.
If the situation is reversed to where an individual knows / feels that Daler will come to power assuredly, there is still no reason for her to go out and vote. The expected Benefit under Daler is lower and going to a polling station to vote for the losing party serves no purpose.
The theory suggests, the rational voter will only choose to vote if they expect that they can affect the outcome of an election. This situation only arises when there is no clear winner in terms of the contesting parties. This occurs when the population is evenly divided amongst the contesting parties and thus an additional individual voting in favour or against a party does actually play a role.
To extend this theory let us look at what happened in Bihar between 2004 and 2009. In 2004 RJD and its allies won 26 seats while BJP and its allies won 11 seats. The voter turnout at that point was 58%.
In 2009 the results reversed. The NDA won 32 seats while the RJD won 4 seats. As the rational choice theory predicts: Nitish Kumar was the clear winner in that year and this could potentially be a reason why voter turnouts dropped to 44 % in 2009.
The Delhi Elections of 2013 witnessed a voter turnout of 66 % . This was a 8 % jump from 58.7% in 2008. Unquestionably 2013 was a much closer election and had everyone interested in politics biting their fingernails.
These two examples seem to suggest that possibly the rational choice model could be in play here. It is only when voters feel that their vote could make a difference, do they come out and vote.
In the coming Lok Sabha Elections, The Election Commission of India has forecasted an expected voter turnout of 70 % , which is 12 % higher than the last General Elections.
Undoubtedly one cannot underplay the role of the media, growing political awareness, dissent amongst the youth and the rest of the country in this potential democratic upsurge.
Perhaps one could also explain this by the rational choice model, in which voters see that there is no clear winner emerging even less than a month before the first phase of voting begins and thus believe that their vote may actually count and for once actively participate in the democratic process.
Levine and Palfrey (2007) test for the competition effect on voter turnout in an experimental setting. They borrow from concepts of Game theory and Nash equilibrium and apply it to their experiment. Their analysis shows strong evidence of a competition effect i.e. The more competitive the election, the higher the voter turnout. In their study they also find that voters are highly responsive to voting costs.
One could test for rational choice theory in India and see whether there is evidence of its existence by doing a constituency / state wise study of the candidates in the upcoming elections and comparing it with previous Lok Sabha elections. As a starting point one could simply check the correlation between the margins by which a party won and the voter turnout. However testing for rational choice would require a more in –depth study than just citing a few examples as presented in this blog to see whether this theoretical model is actually applicable in the Indian context.
References :
- The Public Justice Report : Voter Turnout and Competitive Politics , 2000 David T Koyitz : http://www.cpjustice.org/stories/storyReader$509
- Election Commission India website : http://eci.nic.in/eci/eci.html
- Statewide Analysis of 14th Lok Sabha Elections : CSDS Team http://www.sciencespo.fr/ceri/sites/sciencespo.fr.ceri/files/elections.pdf
- Swaminomics Blog :http://swaminomics.org/fallacies-about-voter-turnout/
- Hindriks, Jean, and Gareth D Myles. Intermediate Public Economics.The MIT Press, 2006
- Levine, David K and Thomas R. Palfrey. The Paradox of Voter Participation? A Laboratory Study, The American Political Science Review, Vol. 101, No. 1 (Feb., 2007), pp. 143-15
Recommended for you

We tried to come up with a clear…
The bureaucracy is considered to be the steel…
Policy Buzz
Keep up-to-date with all that is happening in…
PAISA for Panchayats Study for the State of…
The PAISA for Panchayats research project extends Accountability…

Mapping State Interventions Towards Women and Child Protection…
The report examines interventions addressing violence against women…