
Perceptions and Incidence of Corruption – a Critical Analysis
15 May 2017
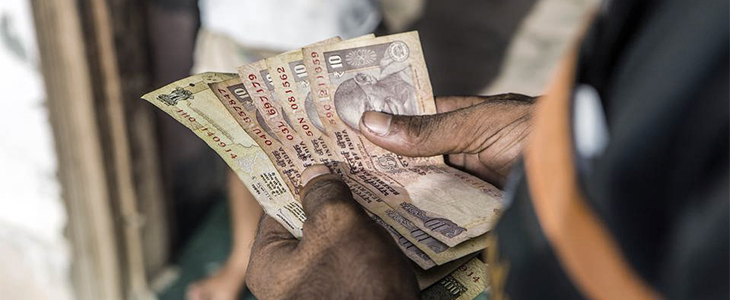
The Corruption Study 2017 has covered both the perceptions of corruption that citizens have and the incidence of corruption that they face. Simply put, a study on perception – whether of corruption or anything else – is essentially an opinion poll. The base survey question is, ‘Do you think if corruption exists or whether it has increased?’ On the other hand, a study of the incidence of corruption would be based upon responses to a more pointed question, whether the interviewee has experienced corruption personally in the period of time the survey covers, say, for example, whether she has paying a bribe in the previous year. Incidence of corruption studies have a much greater value for both consumers and providers of public services. If the study were one only of perception, then the message going out to the public service provider concerned would be that measures to improve people’s perception would suffice, to cure the problem. However, if incidence of corruption data is available, then the focus is directly on cleaning up corruption prone services. There is no room for merely restricting oneself to good public relations, which is what one would do, to improve citizens’ perceptions.
Much of the initial part of the study – the first nine pages of the 20 page report (excluding abstracts and extracts) – is focused on the results of the perception surveys and are of little value to those interested in curing public services of corruption.
It is in the data availability on incidence of corruption that the report falls short of expectations. The report, while it gives service wise details at the national level of the incidence of corruption, is unable to give similar details at the State level. To illustrate, while the study has enough data to say that overall for the country as a whole, citizens reported the greatest incidence of corruption with the police services (34 per cent), land and housing services (24 per cent) and judicial services (18 per cent), it does not reveal the same level of detail State wise. Thus, while those interviewed reported high incidence of corruption in Karnataka (77 per cent), Andhra Pradesh (74 per cent) and Tamilnadu (68 per cent), a departmental break up of these figures were not provided. The report admits that state wise variation for each public service was not measured by the study as a lesser proportion of surveyed households at the state level had reported interacting with a particular public service during the last one year, while asserting that the sample was significant to draw a conclusion about a public service at national level. This admission then begs the conclusion that the sample sizes for the study were too small to address the key questions attempted to be probed.
According to the report, in each State, a sample of around 150 households was covered from at least 2 districts (one of these districts covered was the state capital) spread across 10-12 locations (rural and urban). In all, more than 200 clusters were covered during the study. Thus, only around 3000 households were covered in the study. Furthermore, the number covered in each cluster were just 15 households, on an average. If a more reliable measure of the incidence of corruption is to be obtained, a much larger sample size ought to have been covered, in the nature of 3000 individuals in each State at the very least. If on an average, only 150 households were surveyed in each State, it provides a pitifully small base on which serious conclusions about the incidence of corruption cannot be built.
The quandary is that if a State is concerned about the results of the survey and wants to do something concrete about curing corruption, it cannot draw any conclusions from the survey to focus on areas of priority, such as a few corruption prone services. All India data on department wise incidence of corruption is of no use for a State intent on cleansing its system.
The focus of the survey on the easier task of gauging the perception on corruption, draws it into making premature conclusions about certain policy measures aimed, amongst other things, on reducing corruption. For example, the report finds it pertinent to mention that the period from November 2016, following demonetisation, did not have much effect on the main findings. Yet, later on in the report, it dwells a great deal on reporting the perception of people that demonetisation is predominantly beneficial in reducing corruption. As reiterated, this is nothing more than an impression, and has little value in real governance. If the study felt that it was premature to investigate whether demonetisation has had any effect on the incidence of corruption, reporting citizens perceptions that demonetisation would hit corruption is nothing more than kite flying.
This report focuses only on a few services to citizens by governments; however there are several transactions of the government, such as the sale of the rights to exploit natural resources, or the procurement of goods and services by the government, that are much more corruption prone. How does one measure the extent of corruption in such cases and the success of process changes that limit discretion and increases transparency? More of that in my next blog.
Recommended for you

We tried to come up with a clear…
The bureaucracy is considered to be the steel…
Policy Buzz
Keep up-to-date with all that is happening in…

Where Do the Victims of Gender Based Violence…
Despite several efforts, a survey in 2018 ranked…
Making It Work: Institutionalising Social Audits in Meghalaya…
In April 2017, Meghalaya enacted the Meghalaya Community…