
India’s Public Investment in Education: Deciphering the Inconsistencies in Official Statistics
9 June 2022
The previous blog in this series explored the rationale behind India’s target of spending 6 per cent of its GDP as public investment in education, and how the fulfilment of the target remains a distant reality. More importantly, in terms of India’s current status of education investment, there is some discrepancy in official statistics across different sources. Why do government data sources provide different estimates for India’s public investment in education as a share of GDP, which has been included in the National Education Policy 2020? The answer lies in the definition of education, and therefore the methodology used to calculate the indicator.
It is especially important for researchers and practitioners to understand why different data sources report different values for the same indicator, as it leads to a significant difference in the absolute amount of current investment, which will have a bearing on the assessment of future investment needed for education. Equally important, it will help in looking at comparable numbers while trying to understand how India has progressed in achieving the target.
Understanding the issue
The draft report of the National Education Policy (NEP) released in 2019 quoted the figure for the indicator “public expenditure on education as a share of GDP” at 2.7 per cent for FY 2017-18 Budget Estimates (BEs) [1], which exactly matched with the figure reported in the Economic Survey, 2017-18, released by the Government of India (GoI). The NEP would go on to serve as India’s milestone document on school education, including recommendations on further investments to be made, and thus it is important to consider the benchmark for education spending that it chooses.
The final report of the NEP released in 2020, however, used a different figure for the same indicator. This was 4.43 per cent for FY 2017-18 BEs. The report clearly mentions that this inflated figure was from a source different than the Economic Survey, i.e. “Analysis of Budgeted Expenditure 2017-18” [2]. Thus, two different figures were used between the draft and final report of the NEP, and both were from credible government sources.
Also, within the NEP 2020 document, the same numerator (public expenditure on education) that is used to calculate the indicator (education investment as a share of GDP), when expressed as a proportion of total government expenditure, was exactly matching with Economic Survey, 2017-18, which was 10 per cent for FY 2017-18 BEs. Therefore, it is evident that two different values were used for the same numerator (public investment in education) in NEP 2020: One, when expressed as a share of GDP; and second, when expressed as a share of total government expenditure.
It is important to look at what constitutes spending on education under the two sources that the draft NEP and final report have used.
Differences in how education is defined
There are differences in the kind of expenditures covered under ‘Education’ across the two sources in NEP 2019 and NEP 2020. In both cases, public expenditure in education is inclusive of expenditure incurred by both Union as well as state governments. Also, apart from the Ministry of Education (MoE) or the state-level education departments, some proportion of expenditure on education is incurred by other ministries and departments as well. These have also been included to get the complete picture of public expenditure on education across both sources.
Source 1: Economic Survey [3]
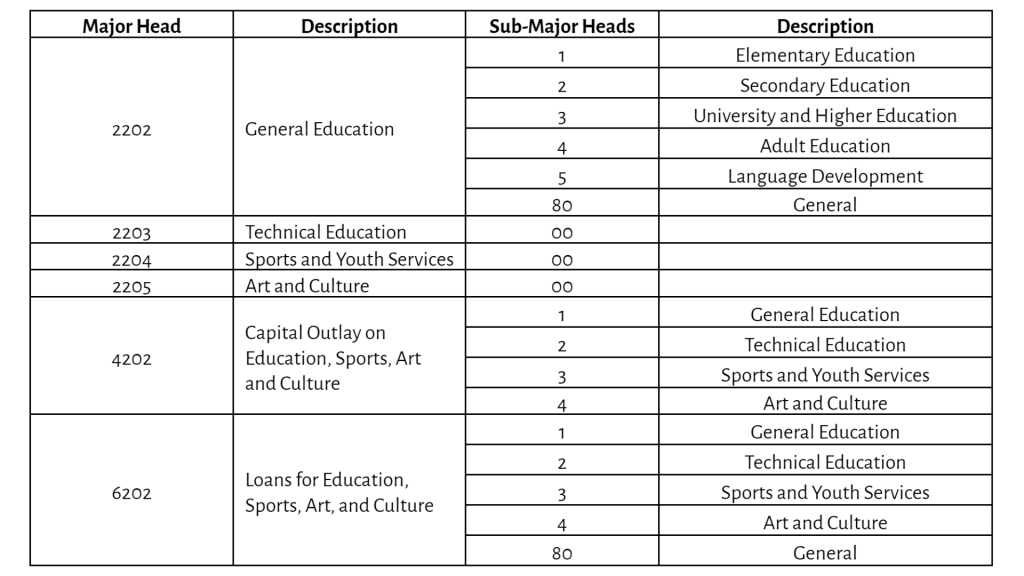
In government budget documents, expenditures are broadly grouped into major heads of account, depending on the sector and type of functions or services. Each major head is further divided into sub-major heads. In order to calculate total education spending, the Economic Survey takes into account revenue expenditures under the following major heads of budget: General Education (major head: 2202), Technical Education (2203), Sport and Youth Services (2204), and Art and Culture (2205).
Additionally, it includes capital expenditure under the head called Education, Sports, Art, and Culture (4202). It also considers expenditure under the category called ‘Loans and Advances’ (major head: 6202). Table 1 summarises the broad budget categories that are considered to collate public investment on education, as followed by the Economic Survey.
Table 1: Specific major heads considered for revenue and capital expenditure on education
Source 2: Analysis of Budgeted Expenditure on Education
The education finances collated by this document include the above-mentioned education-related major heads along with a few additional components. These components cover a relatively smaller share of spending for disadvantaged communities such as Scheduled Castes (SCs), Scheduled Tribes (STs) and minorities, which is spent towards enabling access to education. These are reported under budget heads Welfare of Scheduled Castes, Scheduled Tribes, and Other Backward Classes for Revenue Account (Major head: 2225) and Capital Account (Major head: 4225) and within these, under the minor head Education (Minor head: 277).
It further includes expenditures incurred on training and research and development activities, across multiple government departments, spending on which is not confined to any of the specific budget heads mentioned above, and is therefore difficult to identify from the budget documents.
Overall, this document covers the Elementary, Secondary, University & Higher, Technical, and Adult Education & Language Development sectors. In this way, in calculating education expenditure, the document covers as many as 46 Union ministries for the year 2017-18 [4], along with relevant state departments.
The latest version of this report (published in 2022) also covers roughly 47 Union ministries for the year 2019-20 and estimated public expenditure on education as a share of GDP at 4.39 per cent [5] for 2019-20 BEs. It is equally important to note that while Economic Surveys are published with a one-year lag, the other report (Source 2) comes out after a two year lag period. It was last published in 2022, which has the most recent data of FY 2019-20 BEs.
The 6 per cent conundrum
The target of spending 6 per cent of GDP on public education is based on the Kothari Commission’s recommendation as was discussed in the previous blog, and the definition of education considered by them was more or less aligned with that used by India’s Economic Survey. For calculating total expenditure on education, the Kothari Commission report considered all direct and indirect expenditures [6] on education (Elementary, Secondary, and Higher education) from departments.
Thus, in order to track the progress of the target for public spending on education in the future, the methodology adopted by the Economic Survey seems to have better comparability with the Kothari Commission methodology than the Analysis of Budgeted Expenditure on Education.
One therefore needs to be aware of these definitional differences across sources before arriving at any conclusion regarding the extent of India’s size of public investment in education, which might have a bearing on further policy decisions. Similarly, one needs to be careful in considering these while comparing this crucial indicator over time (and across sources!).
Mridusmita Bordoloi is an Associate Fellow and Sharad Pandey is a Senior Research Associate at Accountability Initiative.
Editorial inputs by Avantika Shrivastava.
Notes:
[1] New Education Policy Draft, 2019, MHRD, GoI.
[2] New Education Policy, 2020, MHRD, GoI.
[3] It is an annual report of the economy which analyses the performance of each sector and suggests future moves. It is presented a day before the budget.
[4] Analysis of Budget Expenditure on Education 2015-17 to 2017-18.
[5] Analysis of Budgeted Expenditure on Education 2017-18 to 2019-20.
[6] Indirect expenditures included Direction and Inspection, Buildings, Scholarships, Stipends, Hostels, and other miscellaneous expenditures.
Also Read: Enrollment Falls In Private Schools Due To Covid-19-Induced Income Shock
Recommended for you

We tried to come up with a clear…
The bureaucracy is considered to be the steel…
Policy Buzz
Keep up-to-date with all that is happening in…
Policy Study on Using Data for Better Policy…
Welfare governance in sectors such as education, health…
Where Do the Victims of Gender Based Violence…
Despite several efforts, a survey in 2018 ranked…