

Tumakuru Case Study: Who Else Spends Money in a City Corporation Area?
6 August 2021
This blog is part of a series unpacking the ‘PAISA for Municipalities‘ research which analysed urban local body finances in Tumakuru Smart City of Karnataka. The first part offers why the study was conducted, the backdrop to the study, and the researchers involved. It can be found here. The previous blog is available at this link.
Plenty of other government entities spend money within a city, even in those functional areas that have been devolved under the Constitution and the law to the City Corporation. This paradox bears repetition ad nauseam, because it is high time we cured it.
This is a legacy that goes back to the days when the predominant focus of government expenditure was in rural areas, and urban local governments were expected to only undertake civic works and not welfare activities. Even as urban areas grew, works that naturally belonged to the domain of local governments, such as urban planning, were done by departments.
Funnily enough, this was not resisted by the local governments. They preferred the encroachment of their space by higher-level departments, because it saved them from taking politically tough decisions such as raising taxes to fund their activities.
However, today, the results of this legacy of creeping centralisation has been that urban local governments are significantly marginalised in city administration. A predominant chunk of expenditure in cities is incurred by bodies that are outside the accountability radar of the urban citizen. These include not only State and Union government departments, but parallel structures created to bypass urban local governments, and even the agencies of rural local governments, to which urban citizens do not vote their representatives.
The toughest part of our assignment was to ascertain the expenditures undertaken by all other government entities, barring the Tumakuru Municipal Corporation, within the city’s jurisdiction. We zeroed in on selected departments and parastatals that run programmes and incur expenditure within the jurisdiction of the City Municipal Corporation.
Some of them maintained expenditure in ways that enabled ward-wise expenditure to be teased out. In others, we had to develop customised attribution methodologies, based upon the nature of the programme run by the entity concerned, to compute the expenditure at the level of a ward.
One of the challenges that the team faced was that, in most cases, the consolidated expenditure provided was for the district and not the city. Many departments that spent funds within the Municipal jurisdiction were under the supervision of the Zilla or Taluk Panchayat and drew funds from their allocations under the District Sector budget. This practice goes back to the time when such departments were devolved to the Zilla Panchayats and their expenditures in urban areas were considered to be of little consequence within their overall expenditure in the rural areas of the district.
However, with urbanisation proceeding rapidly, such an approach is outdated and does not offer the citizen the facility of understanding at a glance, how much expenditure is incurred by such departments specifically in urban areas. There is a need to devise a system that enables departments to carve out and make public the budget they keep aside and the expenditure that they incur within an urban area.
Finally, after undertaking a thorough review of each department’s expenditure and ascertaining either directly or through an appropriate attribution methodology, we listed out all the expenditures happening in Tumakuru city, ward wise. Our results were interesting, and are summarised below.
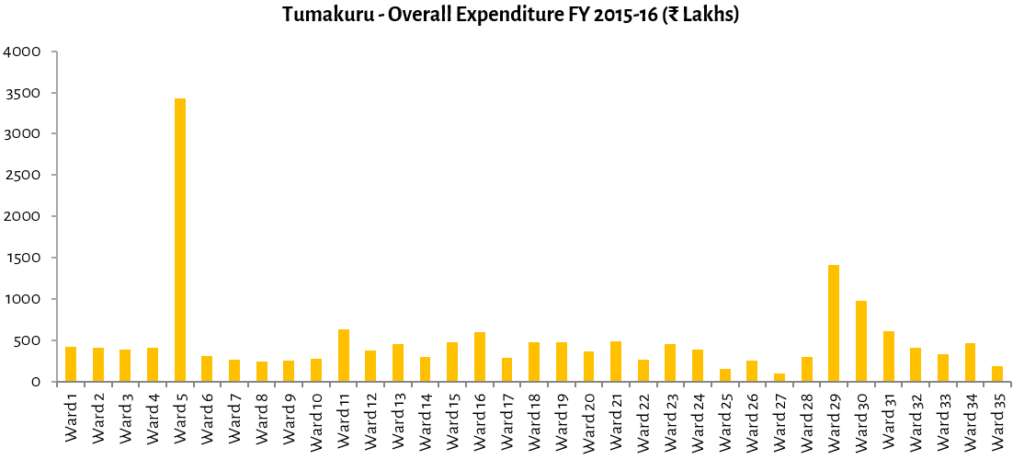
- The aggregate expenditure over the two-year period of study (2014-15 and 2015-16) increased. The average expenditure per ward increased from ₹2.68 crores in FY 2014-15 to ₹5.06 crores in FY 2015-16. However, there was a high skewedness in ward-wise expenditure, as also in per capita expenditure from ward to ward. Some of this skewedness was traced to targeted expenditure to benefit certain deprived sections of the people.
- Thus, two wards (Wards 5 and 29) had high per capita expenditure due to investments by the Slum Development Board, which spent money in selected slums. However, even if such expenditure was excluded from the calculations, some level of skewed expenditure was seen between wards. Figures 1 and 2 show these expenditures, excluding the skewed expenditure of the Slum Development Board.
Figure 1
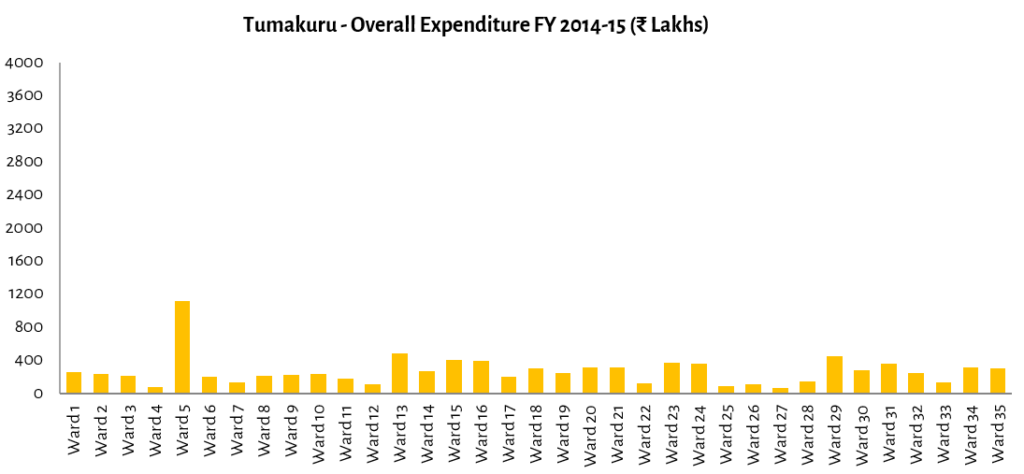
Figure 2
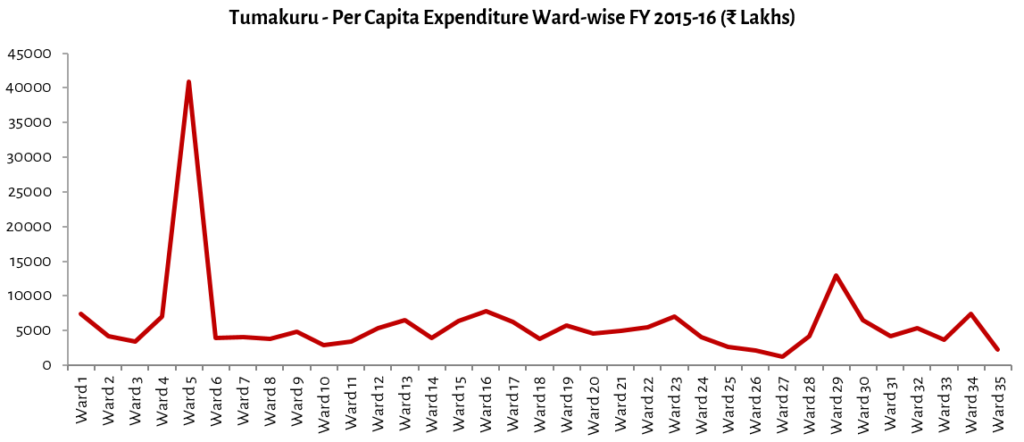
When per capita expenditure was considered, the horizontal inequity between wards were glaring (figures 3 and 4).
Figure 3
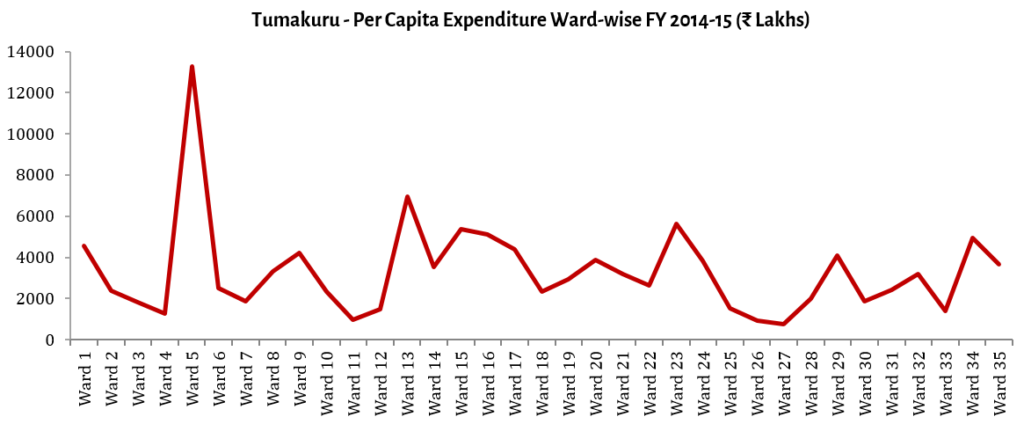
Figure 4
What is in store for a citizen, when such data is revealed? That is an intriguing question, which I will discuss in my next blog.
T.R. Raghunandan is an Advisor at Accountability Initiative.
Also Download: Report on PAISA for Municipalities
Recommended for you

We tried to come up with a clear…
The bureaucracy is considered to be the steel…

Policy Buzz
Keep up-to-date with all that is happening in…

Understanding India’s Health Budgets
The budget is a vital tool to support…
The Mission Creep Problem In Panchayat Finances
First published on Seminar (web-edition), available here. Despite…