Unpacking India’s Education Budget: PAISA 2010
15 January 2011

India’s education budget more than doubled in the last five years increasing from Rs. 152,847 crores in FY 2004-05 to Rs. 372,813 crores in FY 2009-10. An estimated 45 percent (figures for FY 2008-09) of education expenditures are now dedicated to elementary education. However, close scrutiny of India’s education system reveals a sobering truth – that this large investment has been spent poorly. And as the ASER report reminds us year after year, increased investments have failed to improve education outcomes. Despite significant financial investments, India’s education system is in fact, as characterized rather aptly by economist Lant Pritchett, in a ‘big Stuck’. What explains this ‘Stuck’? and how do we reverse this trend? To answer this question we need to understand the processes through which increased investments translate in to action. Critical to this are the links between plans, allocations and expenditures: how are resources allocated to states? What are the links between allocations and plans? How do funds flow through the system to arrive at their final destination? What are the links between school needs and increased expenditures?
To answer these questions, for the last two years, ASER has been implementing PAISA (an effort to track school level funds in partnership with Accountability Initiative and NIPFP). This year, PAISA undertook a macro level analysis of school finances and linked it, through the ASER-PAISA survey, to fund flows and decision making at the elementary school level. Preliminary analysis suggests that the links between allocations, plans and expenditures are seriously damaged. This is evidenced in three ways 1) States that have seen the highest increases in investments in recent years are also the poorest spenders. 2) Funds flows are extremely slow breaking the link between planning and expenditures and 3) There is no clear correlation between school needs and increased expenditure indicating that the links between school needs, plans, allocation and expenditures are weak. Below are some of the highlights of this analysis:
Allocation Trends: The Government of India’s (GOI) primary vehicle for the delivering elementary education is the Sarva Shiksha Abhiyaan (a centrally sponsored scheme that has been in operation since 2001). Reflecting the overall trend of increased investment, the Sarva Shiksha Abhiyaan (SSA) budget too has increased significantly in the last few years from Rs.7,156 crores in 2005-06 to Rs.15,000 crores in 2010-11. This overall increase has been distributed unevenly across the country with a greater share of resources going to the lagging states indicating a clear link between resource allocations and perceived school needs. GOI’s SSA share for Bihar has nearly doubled in the last four years from Rs. 2,414 crore in FY 2006-07 to Rs. 4,295 crores in 2009-10. Rajasthan’s budget increased from Rs. 1,253 crores to Rs. 2241 crores and West Bengal’s from Rs. 1,465 crores to Rs. 2,194 crores.
An important aside: Despite significant increases in GOI investments in education, state governments contribute the major share of India’s education budget. In FY 2009-10, state government budgets amounted to 74 percent of the total education budget for India. State government investment too has seen a dramatic increase in recent year. Uttar Pradesh, Bihar, Rajasthan and Andhra Pradesh, State governments nearly doubled their share of the elementary education budget between 2006-07 and 2009-10, while Jharkhand has seen a three-fold increase in the same period. Interestingly, Uttar Pradesh, saw the largest overall increase in its elementary education state budget from Rs. 6,439 crores in 2006-07 to Rs. 11,185 crores in 2009-10. This increase was far greater than GOI’s increased share for SSA.
Allocation trends and expenditure efficiency: Countrywide, SSA expenditures have been fairly low – data from 2006-07 to 2008-09 shows that on average 30 percent funds remain unspent every year. This persistent gap in an overall environment of increased investments indicates that that links between planning, expenditure capacity and allocations are weak.
The problem is exacerbated at the state level. State level analysis highlights that there is no clear correlation between increased investments and actual expenditures on the ground suggesting that the links between planning, allocations and absorption capacity are somewhat weak.
Bihar, which has received the highest increase in GOI SSA allocations, is also the poorest spender. In FY 2009-10, Bihar spent 51 percent of its allocated funds. Interestingly, these figures show a slight deterioration when compared with FY 2008-09 when Bihar spent 62 percent of its total allocations. West Bengal although significantly better than Bihar, spent 74 percent of its SSA allocations for FY 2009-10. West Bengal has shown some minor improvements over the last two years with a jump from 66 percent expenditures in FY 2008-09 to 74 percent for FY 2009-10. Rajasthan is the exception having spent 89 percent of its SSA allocations for the same period. Interestingly Rajasthan witnessed a small dip in its expenditure performance despite rising investments from last year when it reported an expenditure of 91 percent.
Links between plans and expenditure: For expenditures to be efficient and effective, they must be incurred in a manner that meets needs and priorities. This would imply that funds must arrive at their destinations on time to ensure that specific, time bound needs are met. Macro analysis of education expenditures suggests that this is not the case and in fact expenditures tend to be highest towards the end of the financial year.
Why does this occur? The PAISA survey in ASER suggests that the delayed expenditures are a consequence of delays in fund flows. And in fact the problem is acute at the school level.
The 2010 ASER report, analyzes grant receipts for primary schools across two financial years – 2008-09 and 2009-10. Since the survey is conducted in October-November and the financial year runs from April 1 to March 31st, schools were asked to provide information for one full financial year (the year preceding the survey) and one half of the financial year (the year during which the survey was being undertaken). Comparison of this half year and full year data enables analysis of timeliness of funds. Overall, the results indicate fund flows are extremely slow and money usually reaches schools at the end of the financial. These delays result in a mismatch between needs and expenditures. So, if a school needs funds to repair its blackboard at the start of the school year but maintenance money only arrives in December, the specific requirements of the school remain unfulfilled. Late arrival of funds also results in schools rushing to incur expenditures to meet reporting deadlines without giving adequate consideration to specific needs and plans. Consequently, funds get spent poorly and the link to plans is broken.
PAISA data suggests that inefficiencies do not affect allocation decisions. A detailed analysis of states with increased SSA investments tells an interesting story. The good news first: states which have seen significant increases in education investment have also seen some improvements in fund flows. Notably, Bihar and Jharkhand have seen some improvement both in the timing of fund flows and in overall receipt of grants between 2008-09 and 2010-11. On the other hand, West Bengal and Rajasthan have shown improvements in overall receipt of grants between 2008-09 and 2009-10 but remain poor performers when it comes to ensuring timeliness of fund flows. Other States such as Uttar Pradesh, whose overall education budget has increased significantly performs poorly when it comes to timeliness of fund flows. And finally states like Chattisgarh and Uttarakhand seem to have performed far worse than the previous year when it comes to timeliness of fund flows.
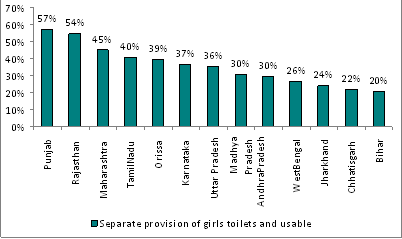
Links between increased investments and school needs: To the extent that more money is being pumped in to poorer states with a historically poor record in education, the links between increased investments and school needs seem strong. But closer scrutiny reveals that at the school level this is not necessarily the case. ASER 2010 collected data school infrastructure including toilet facilities and drinking water. When correlated with expenditures it seems that states with increased investment continue to have serious infrastructure deficits. In Bihar a mere 37 percent schools had usable toilet facilities, West Bengal did somewhat better with 56 percent schools that had usable toilets and Rajasthan topped the list at 70 percent. Bihar does better on drinking water facilities with 79 percent schools reporting availability of usable drinking water facilities. Rajasthan and West Bengal reported 68 and 67 percent schools that had available usable drinking water facilities. This could mean either that the money available is simply not enough or that increased investments are not being directed at physical infrastructure.
Figure 1. Percentage of Schools Having Separate and Usable Girl’s Toilets
If physical infrastructure is not a priority are human resources the priority? Given that almost 80 percent of India’s education budget is tied to teacher wages, one could safely assume that a significant portion of the increased investment is going towards hiring teachers. ASER 2010 has collected data on pupil teacher ratios. When correlated with expenditure data we find interesting trends about state expenditure priorities. Uttar Pradesh, which has seen a large increase in financial investments (and some improvements in infrastructure) also has a very high Pupil teacher ratio with 79 percent schools reporting more than current norms of 1 teacher to 30 students. Interestingly, Uttar Pradesh has also had a drop in enrolment numbers from 22,508,818 in 2007 to 21,487,653. But Uttar Pradesh performs better than Bihar on infrastructure facilities – 49 percent schools have usable toilets compared with Bihar’s 37. 82 schools have drinking water facilities compared with Rajasthan’s 68 and West Bengal’s 67 percent. Perhaps then, one can infer that Uttar Pradesh has prioritized infrastructure over human resources even though human resources are a critical gap.
Figure 2 Percentage of Schools with PTR above the RTE Norm
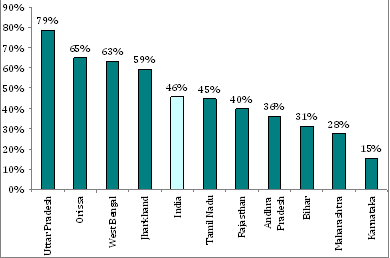
Bihar on the other hand does relatively better on this count with 30 percent schools reported having more students than teachers as prescribed under the norms. This suggests that Bihar has been using its increased investments to hire teachers a fact verified by recent data which shows that Bihar hired 2.5 lakh teachers since 2007.
So what have we learnt? Clearly the links between. the links between planning, allocations, schools needs and expenditures are damaged weak resulting in the Big Stuck. With India’s schooling system now entering a new phase of implementation under the Right to Education Act (RTE) the current financial architecture needs a serious rethink. Strengthening the annual planning process could be the first step. In January every year every district is supposed to make an annual plan based on school development plans made with parental participation. Concentrating on strengthening this process could not only strengthen links between school needs, plans and allocations but also ensure greater citizen involvement. It is only when citizens get involved and demand accountability for increased investments that outlays will translate to outcomes.
Yamini Aiyar and Avani Kapur are with the Accountability Initiative, Centre for Policy Research. Anit Mukherjee is with the National Institute of Public Finance and Policy.
