

The Curious Case of Unspent Funds

Every year the week before and after the budget, debates across all media channels and civil society tend to focus on “allocations” – how much money has been allocated for Sarva Shiksha Abhiyan? What is the jump in allocations for rural development? How much is health getting? But amidst the outcry on allocations, the most important question that seems to get lost is, how was last year’s money actually spent?

A week before the budget was announced, newspapers carried a startling finding by the Comptroller and Auditor General – that “Rs. 1 lakh crore budget funds go unspent every year”. But in the midst of the attention given to allocations, the story and along with it the attention towards unspent funds, somehow disappeared.

According to the CAG report, in 2007-08, under 97 grants of civil ministries, there was an unspent provision of Rs. 1,08,000 crore. The report was based on the findings by the Comptroller and Auditor General (CAG) based on the accounts of 2005-2007. The following table from the Times of India (TOI) summarizes some of the CAG findings. For those interested in going deeper into the report, click here

Unspent funds are indeed a curious thing and broadly there are a few things that continue to perplex me and may be some of the keys to this mystery.

First, The Flow of Funds:
In recent years, there has been a paradigm shift in the Union Government’s strategy for implementation of flagship programmes and other centrally sponsored schemes (CSS) for poverty alleviation, health care, education, employment, sanitation etc. Most of these schemes were initially implemented on a cost sharing basis with transfer of central share to state government. Now, the Union Government has started transferring their share directly to state/district level autonomous bodies, societies and ngos for implementation of CSS without devolving funds through the state government accounts.

As the CAG report states, “For the year 2007-08, Union Government made a provision for transfer of central plan assistance of Rs. 51259.85 crore (as per revised estimates) directly to these state/district level societies…. Expenditure in the accounts of these implementing agencies is kept outside Government accounts not readily ascertainable.” So basically, we have no real idea about the amount of actual expenditures being undertaken and even the expenditure reflected in the accounts is to that extent, overstated. How will we develop proper mechanisms to monitor these flows of funds? If “society” funds are outside the ambit of the government accounts – where is the transparency?

Second, Timings of disbursements:
Why is it that funds continue to be released in the last few quarters of the financial years? In education, 63% of SSA funds were spent in the second half of FY 2008-09. Even the CAG report noted delays in funds in FY 2007-08. The table below summarizes some of their findings:

What is worse is that we don’t seem to have learnt from past mistakes. According to the TOI report, even the Union Government’s monthly accounts for the current year, reveal that some of the ministries’ expenditure till December 2009 was not more than 50% of the annual budget, though only 3 months remained for the end of the financial year. All this is despite the fact that on the Public Accounts Committee’s recommendations, the Ministry of Finance issued instructions to all Ministries/Departments to restrict their expenditure during the last quarter of the financial year to 33% of the budget amount.

Finally, Trends:
Why is it that some states spend more than others? For example in FY 2007-08, while Rajasthan and Chhattisgarh spent over 90% of the allocated funds for SSA, Madhya Pradesh and Bihar spent 57% and 42% respectively. Similarly in health, in FY 2008-09, Madhya Pradesh and Uttar Pradesh spent more than 90% in FY 2008-09, while Bihar spent 66% and Orissa spent 75% of total funds available.

And finally, is it easier to incur expenditure on some items more than others? or why do some expenditure items get spent more than others? Why do untied grants in National Rural Health Mission hardly get spent (Bihar spent 11% and Himachal Pradesh spent 37% of untied funds available). In education, why is it that items like infrastructure and teacher salaries get spent more than teacher trainings or innovation grants?

I don’t have the answers, but it’s time we at least start asking the questions!

 

For RTE grievances dial 1

An essential pre-requisite to any rights-based approach is the necessity of ensuring its enforceability. What does a citizen do in case their rights are violated or not adhered to? Who does one complain to if the right is not being implemented? Despite two and a half years since the passing of the Right to Education (RTE) Act, the state is still struggling to come up with effective grievance redressal mechanisms (GRMs) for the Act.

As a concept, GRM’s have been a part of several policy conversations. In April 2011, the then Hon’ble Minister of Human Resource Development, remarked about the need for a roadmap for time bound redressal of grievances. The move came around 3 weeks after the National Commission for Protection of Child Rights (NCPCR) – who is the top referee for RTE disputes and complaints raised concerns over the lack of clarity of roles of different implementing agencies. One year later, in a conference of State Secretaries held in New Delhi, GRMs were “an important part of the agenda”. States were requested to set up effective GRMs to address the complaints of the stakeholders in a time bound manner.

At another review of the implementation of the RTE Act earlier this year, the then HRD minister suggested that the GRM should publicly list out legal entitlements guaranteed under the RTE Act. This information could be made available on school and panchayat walls along with a list of designated officers for each of these entitlements. It was suggested that the maximum time within which a complaint should be addressed be limited to 3 months, with specific complaints being assigned different time-bound actions.

However, while the centre has left the exact nature and formation of the GRMs to the states prerogative, there continues to be a lot of confusion regarding the same. The result – a large number of complaints remain unsolved and probably even more, remain unreported. In fact, according to a newspaper article, a RTI filed revealed that over the last two years, NCPCR received 2,850 complaints regarding the RTE Act. However, it has been able to resolve just 692 cases, or just 24 per cent. If one is to look at the year wise numbers, from April 1, 2010, to March 31, 2011, the commission received 1,089 complaints, of which it resolved 592 cases. While in the second year, till March 16, 2012, the commission could solve only 100 of the total 1,761 complaints received.

What does the RTE Act say?

According to Chapter VI of the RTE Act, complaints can be registered at the Gram Panchayat or Block Education Office. Any person having a grievance can thus register a written complaint to the local authority. After receiving the complaint, the local authority shall decide the matter within 3 months.

As mentioned earlier, the NCPCR is the highest body for Grievance Redressal. In addition, all states are supposed to set up a State Commission for Protection of Child Rights (SCPCR) and within six months constitute Right to Education Protection Authority (REPA) which should later be formed as a part of the SCPCR. However, the 2nd Year of RTE report states that only 20 states had constituted the SCPCR by March 2012. Large states such as Andhra Pradesh, Kerala, Tamil Nadu and Uttar Pradesh were still “in the process” of constituting the SCRCR.

Finally complaints can also be taken to the courts, as education is now a justiciable fundamental right of all children in the age group 6-14 years.

Other methods of GRM’s facilitated by the NCPCR have included, social audits (12 have been conducted till date), public hearings(8) and publicity campaigns. In addition, the RTE monitoring cell of the NCPCR has set up an online primer on various issues under the RTE act, but it seems to be a work in progress.

Main Issues/Concerns

There are many problems with the current (and slightly vague) system of GRMs.

First, there can be no specific officer in-charge for different types of violations. For example, a teacher not showing up to school and the money for civil works not reaching the school would fall under the purview of different officers. This can lead to confusion as to whom to approach regarding one’s specific complaint. Moreover, the opportunity cost of being redirected to different people for one complaint is often too high.

Second, there are a large number of ministries and departments that would need to work in coordination. For example, provision of toilets is the responsibility of the Total Sanitation Campaign, water falls under the Accelerated Rural Water Supply Programme; the provision of Mid-Day Meal (MDM) schemes under the MDM directorate. Even within the SSA department there would be different programme officers responsible for specific activities. In fact, in 2010-11, cases before the NCPCR ranged from juvenile justice, child labour, corporal punishment, non-functional toilets, denial of admission, sexual abuse, child health and nutrition. (Ministry of Women and Child Development, Annual Report, 2010-11)

Third, a common problem is that government officials change frequently. So, having the name and number of a specific officer painted on a school wall may become irrelevant in a few months if the officer is transferred.

Finally, even if you actually do manage to file a complaint, another important issue is that of anonymity. A parent wanting to complain against a teacher is often worried about the consequences his complaint may have on the children studying in the school; or a teacher complaining against a Headmaster could face the wrath of the HM after the complaint.

A possible solution

Given these concerns, one possible solution can be utilizing mobile and computer aided technology. We all remember the headline that read– India has more mobile phones than loo’s”. Why not harness that technology to enable an effective GRM?

I therefore propose the creation of a toll-free number where citizens could phone in and be directed (at the click of a number) to the relevant department for their specific problem. This is not something new. The Delhi government for instance has computerized the registration of complaints for telephone connections, electricity and even gas cylinders. Now-a-days if I need to order a replacement cylinder – I just need to call from my registered mobile, press 1 for refill or 2 for leakage and I am good to go. Once the “backend” of the system is set up, the onus on coordinating with different departments no longer falls on the complainant. One can thus be assured that the complaint reaches the specified department/official without facing the wrath of the person being complained about!

An interesting step in this regard has recently been taken in Assam. With a view to check absenteeism among teachers in public schools, the education department unveiled a School Teachers’ Attendance Monitoring System which empowers parents and guardians to report absenteeism among teachers via a helpline. This is a great first step. If this idea could be extended to cover other violations and other states such that a computerized system could automatically redirect the query to the relevant department, maybe we’d finally be closer to achieving the “missing R” in RIGHT to Education.

Vote on it

The 16th Lok Sabha elections are round the corner.  In an attempt to keep up with the times, this blog seeks to provide some insight into voter turnout trends and a theoretical model on what determines an individual’s decision to participate by voting in the election process.

Data source: Election Commission website

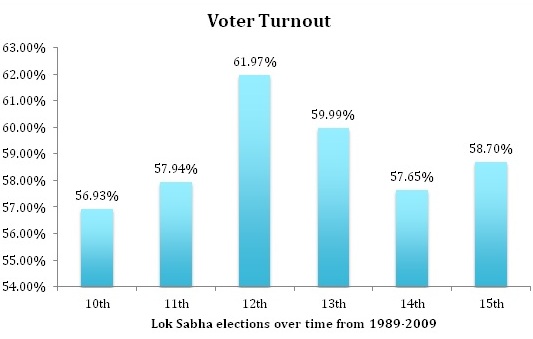
Based on data from the Election Commission of India, voter turnout has increased marginally from 55 % in 1971 (5th Round of Lok Sabha) to 58.7% in 2009 (15th Round of Lok Sabha Elections). In fact the highest voter turnout was in the 2nd Round at 62.2% in 1957 as per the website.

If one looks at the voter turnout in the last 5 General Elections in India, voter turnout has been around 58%.

If one was to compare our average voter turnout to developed democratic nations one finds that India has done better than the United States which has recorded an average voter turnout of 48.3 in all general elections from 1945 to 2000. In Canada the voter turnout is close to 68% for the same period.

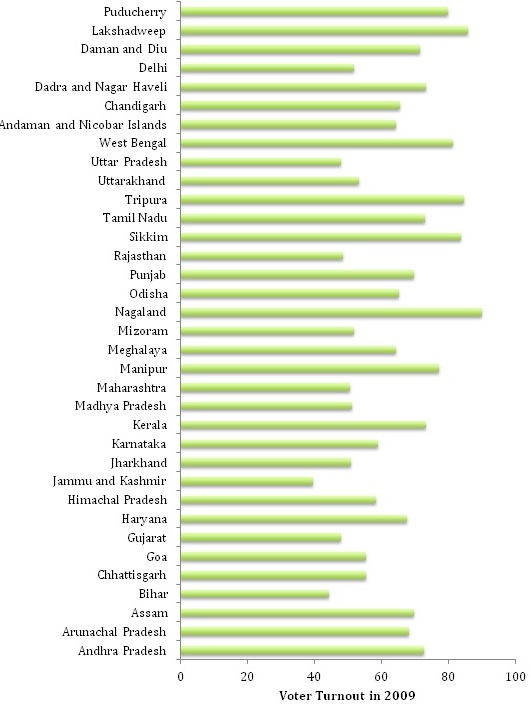
The graph below highlights the variations in voter turnout in the last General Elections (2009):

Data source : http://pib.nic.in/newsite/PrintRelease.aspx?relid=104547

In the 2009 General Elections, the Northeast region did particularly well with Nagaland recording a turnout of over 90% followed by Sikkim and Tripura which recorded an 80% plus turnout. Delhi and Maharashtra for the same period had  a voter turnout of 51.85% and 50.7% respectively.

In the same period areas in South Delhi and South Mumbai recorded low voter turnouts (around 40%) in 2009. Media discussions during that period attributed this low turnout in the Metros to political apathy and the alienation of the elite and middle class from the political process.

An article by Swaminathan S Aiyar published right after the General Election in 2009 said that no one really knows what the driving force behind voter turnout is and media analysts need not be taken so seriously. He went on to state that the drastic changes in voter turnout in the same state between two general elections (For example Bihar dropped from 58% to 44% in terms of voter turnout between 2004 & 2009 elections)  suggested that this phenomenon was not a class, caste or income behavioural issue.

There are two different traditions that seek to address the question of why individuals choose to vote. One models itself on the lines of underlying demographic, socio-economic and attitudinal characteristics, as mentioned above.

The second tradition finds its roots in public choice literature. It models voter turnout as a rational choice model.  Voters make a decision to vote or not vote based on their own self-interest.( For more on information on this model read Hindriks and Myles book Intermediate Public Economics, 2006) In terms of the economic definition of utility there are things that must be taken into consideration.

Participation in the voting process always has a cost. There is the direct cost of travelling till the polling booth and the indirect cost of the time it takes for the activity.For the purpose of simplicity, let the direct and indirect cost of voting be denoted by C

Let the expected benefit the voter derives from voting be B

Only when B-C > 0 will a voter consider voting.  This derivation comes with the precondition that the individuals involved in voting are rational utility maximizers i.e. The expected benefit from voting must exceed the cost of voting. This is a necessary condition

Understanding what this expected benefit comprises of yields some semblance of understanding voter turnout. To elaborate on what expected benefits means, let us introduce two political parties into the narrative. Let one party be called Bappi and the other Daler. Bappi promises an expected benefit in cash, kind, ideology or possible provision of public goods which amounts to E(Bappi)  and similarly Daler delivers a benefit of E(Daler).

Depending on which party provides the individual voter with a greater benefit, the individual prefers one party to the other. For simplicity lets assume the Bappi Party provides voters with a greater benefit. i.e.

E(Bappi) > E(Daler)

The expected benefit B can then be defined as the probability of Bappi winning into benefits if Bappi comes to power added with the probability that Daler comes to power and the benefits of him coming to power. Mathematically :

B = E(Bappi)* Probability of Bappi winning + E(Daler)* Probability of Daler winning

The voting paradox is this. If an individually rational voter feels that Bappi will undoubtedly come to power, then there is no reason for him to incur the cost C as he can still enjoy the benefits of Bappi coming to power. 

If the situation is reversed to where an individual knows / feels that Daler will come to power assuredly, there is still no reason for her to go out and vote. The expected Benefit under Daler is lower and going to a polling station to vote for the losing party serves no purpose.

The theory suggests, the rational voter will only choose to vote if they expect that they can affect the outcome of an election. This situation only arises when there is no clear winner in terms of the contesting parties. This occurs when the population is evenly divided amongst the contesting parties and thus an additional individual voting in favour or against a party does actually play a role.

To extend this theory let us look at what happened in Bihar between 2004 and 2009. In 2004 RJD and its allies won 26 seats while BJP and its allies won 11 seats. The voter turnout at that point was 58%.

In 2009 the results reversed. The NDA won 32 seats while the RJD won 4 seats. As the rational choice theory predicts: Nitish Kumar was the clear winner in that year and this could potentially be a reason why voter turnouts dropped to 44 % in 2009.  

The  Delhi Elections of 2013 witnessed a  voter turnout of  66 % . This was a 8 % jump from 58.7% in 2008. Unquestionably 2013 was a much closer election and had everyone interested in politics biting their fingernails.

These two examples seem to suggest that possibly the rational choice model could be in play here. It is only when voters feel that their vote could make a difference, do they come out and vote.

In the coming Lok Sabha Elections, The Election Commission of India has forecasted an expected voter turnout of 70 % , which is 12 % higher than the last General Elections.

Undoubtedly one cannot underplay the role of the media, growing political awareness, dissent amongst the youth and the rest of the country in this potential democratic upsurge.

Perhaps one could also explain this by the rational choice model, in which voters see that there is no clear winner emerging even less than a month before the first phase of voting begins and thus believe that their vote may actually count and for once actively participate in the democratic process.

Levine and Palfrey (2007) test for the competition effect on voter turnout in an experimental setting. They borrow from concepts of Game theory and Nash equilibrium and apply it to their experiment. Their analysis shows strong evidence of a competition effect i.e. The more competitive the election, the higher the voter turnout. In their study they also find that voters are highly responsive to voting costs.

One could test for rational choice theory in India and see whether there is evidence of its existence by doing a constituency / state wise study of the candidates in the upcoming elections and comparing it with previous Lok Sabha elections. As a starting point one could simply check the correlation between the margins by which a party won and the voter turnout. However testing for rational choice would require a more in –depth study than just citing a few examples as presented in this blog to see whether this theoretical model is actually applicable in the Indian context.

References :

  1.  The Public Justice Report : Voter Turnout and Competitive Politics , 2000 David T Koyitz : http://www.cpjustice.org/stories/storyReader$509
  2. Election Commission India website : http://eci.nic.in/eci/eci.html
  3. Statewide Analysis of 14th Lok Sabha Elections : CSDS Team http://www.sciencespo.fr/ceri/sites/sciencespo.fr.ceri/files/elections.pdf
  4. Swaminomics Blog :http://swaminomics.org/fallacies-about-voter-turnout/
  5. Hindriks, Jean, and Gareth D Myles. Intermediate Public Economics.The MIT Press, 2006
  6. Levine, David K and Thomas R. Palfrey. The Paradox of Voter Participation? A Laboratory Study, The American Political Science Review, Vol. 101, No. 1 (Feb., 2007), pp. 143-15

The Case of the Missing Records

If you have ever visited a government office, you would have been astounded (like I was) to see numerous files stacked in dingy offices, gathering dust. Yet, there often appeared to be a method to the madness and if you requested for a file, it was easily pulled out.

Despite this, in recent years there seems to be growing number of cases where records go “missing”.

I first became aware of this “strange” phenomenon when we started working on the PAISA Project. As you all must be aware by now, through the PAISA Project we analyse government documents at different levels (Government of India (GOI), state and district) and complement that with school-level surveys in order to ascertain the following: How do funds flow through the system? Is money utilised? When is it utilised and how are funds spent?

We have received a decent “success rate” in gaining access to documents at the GOI, state and district levels. With the exception of a few stray cases where the relevant authority at the district level was transferred along with access to all the important documents at the district level (we were told that only he had the password and without the password, the new official was unable to access any of the documents), if the data exists, it has been given. (Data not existing at all is another problem altogether and more details on that are available here.)

However, the greatest number of issues seems to come about at the school level. During our surveys, we request to see passbooks, registers, utilisation certificates and cashbooks. Interestingly, we seem to have encountered numerous cases of “passbooks being stolen”, “passbooks lost in floods”, cashbooks “burnt” in kitchen fires!

This got me wondering…Was the inability to get records the fault of our surveyors (i.e., did we not ask the question correctly, did our surveyors not probe enough, etc.), or was it something deeper? Preliminary research suggests that in recent years, the frequency of these cases being reported (probably due to the greater use of the Right to Information (RTI) Act and rising citizen engagement with government records) has increased. So here are some of the stories:

  • In February 2012, Lokayukta Justice Manmohan Sarin asked for all records from the Delhi Government’s Urban Development Department relating to a case on an unauthorised colony in Wazirpur village. The village had been allegedly granted illegal provisional regularisation certificates by the then urban development Minister, ahead of the 2008 assembly elections. In the complaint, it had been alleged that the land was issued based on forged and incomplete applications and the provisional certificate had been signed by the Minister. The result: the Lokayukta was informed that the file regarding the colony could not be traced “despite all efforts”!
  • In March 2012, an RTI application requested records from the Prime Minister’s Office (PMO) pertaining to the imposition of the Emergency in India in 1975. The PMO’s office however stated, “a thorough search was made to retrieve, trace records of correspondence between the then Prime Minister and the President of India relating to proclamation of emergency. However, no such records were found in the PMO (Prime Minister’s Office).”
  • It is hard to put a date to the missing records in the Adarsh Society housing scam. The Adarsh Society, originally meant to be a six-storey structure to house Kargil war heroes and war widows, was converted into a 31-storey building, violating a number of laws. The flats were allotted to bureaucrats, politicians’ relatives and defence officers at artificially lower prices. Between 2010 and 2012, there have been more than four instances of crucial documents going missing. The first entailed important file notings dating August 30, 2009 and November, 1, 2010, going missing from Maharashtra’s Urban Development Department office. This was subsequently followed by important papers “disappearing” from the Ministry of Environment and Forests. Another set of papers went missing from the Army Headquarters in Mumbai. In June 2011, maps and some survey sheets from 1872-1960 related to Adarsh land were untraceable from the land records office of the Mumbai. According to a recent Indian Express article, the Central Bureau of Investigation (CBI) has hit a roadblock in its investigations to look for the missing records and is currently weighing the options of closing the investigations.
  • A similar problem was faced during the auditing of the National Rural Health Mission (NRHM) scheme in Uttar Pradesh by the Comptroller and Auditor General’s office. The report states that “in many cases during the course of the audit, it was informed that records were either not available in full or not available at all and in quite a few instances, original records had not been maintained, particularly relating to Accounts.” For instance, records from the Director General, National Programmes, Monitoring and Evaluation from 2005-06 to 2006-07 amounting to Rs. 1277 crores were not available. Even at the district level, records from 2005-06 to 2008-09 related to medicine and equipment purchase, utilisation certificate and stock position in two Community Health Centres in Lucknow were not traceable. Similarly, cashbooks, ledgers, passbooks, tender, quotation and purchase files, bill registers, stock and voucher book from April 2005 to December 2006 for the Reproductive and Child Health-II and from April 2005 to August 2008 for the Routine Immunization Programme in Kanpur Nagar, Uttar Pradesh were also missing. (more details available here)

These are just some of the bigger examples that have come to light in the recent past in relation to “missing” records containing valuable information (and interestingly, often in relation to scams!).

In fact, according to the Public Cause Research Foundation (PCRF) which had analysed orders passed by various information commissioners at the national and state level – in many cases government officials had refused to provide information sought under an RTI application, due to “missing documents.” According to a member of the PCRF, “during 2010, Information Commissioner Shailesh Gandhi, who handles Departments pertaining to Delhi, had received as many as 30 such cases and ordered filing FIRs in 28 cases.” (Hindustan Times, February 2011).

Moreover, in a significant Judgement, the Division Bench of the Hon’ble High Court of Jharkhand, has held that, in cases where a department is required to keep a record but it is not available or missing, then it should be reconstructed. It is also “within the jurisdiction of the authorities under the Right To Information Act to direct the office to reconstitute the record…” (link to the judgement available here).

Insistence on filing FIR’s immediately upon theft/destruction and reconstruction of lost records are just some steps to ensure greater accountability. However, the question still arises as to who is held accountable if valuable records go missing and how do we ensure that the “reconstruction” itself is accurate. In this day and age of digitisation and cloud storage, it feels strange that often the lack of records is the main hindrance in ensuring due process and accountability. In fact, I am reminded of my days of college where the crashing of a hard drive just before submission of papers was not reason enough to ask for an extension. Instead, you had to deal with the consequences. As more and more such cases come to light, it feels like time has come to remove the “dust” from the files and figure out a better system of maintaining records such that the person who claims its loss/destruction is held accountable for it.

Data in the dark

If government offices could exist virtually, they would be remarkably similar to government websites, waiting/loading time included. Most information is available but not easily accessible, like a cabinet full of files stacked somewhere.

Moreover, accessibility to government data does not ensure accuracy; in fact too much information can also lead to a misrepresentation of facts. This blog post seeks to highlight the various obstacles faced while researching Government of India (GOI) schemes purely using government data available online. For an insightful account of missing records in government offices, have a look at this AI post (Link).

According to the Open Data Foundation (Link), a data user should ideally be able to:

  • Discover the existence of data.
  • Access data for research and analysis.
  • Find detailed information describing data and its production process.
  • Effectively communicate with the agencies involved.
  • Share knowledge with other users.

Ideally. In reality however, there are many impediments to cogent data analysis.

The Indian government has taken several steps towards providing accessible information online. Extensive official guidelines explain what GOI websites should look like[1](Link), some pointers even address problems we’ve encountered. There’s also an analytics page(Link) rating these websites on the basis of their user interface and accessibility (the Indian Navy website is ranked highest). However, whether GOI departments take heed to these suggestionsis debatable.

We can spot various issues in data while analysing schemes such as the Nirmal Bharat Abhiyan (NBA/TSC), Jannani Suraksha Yojana (JSY) and the Indira Awaas Yojana (IAY). Discrepancies are evident in their documents for Centre and State financial spending, physical achievements, State guidelines, Annual Action plans, Panchayat reports and question lists in the Houses of Parliament. This by no means covers the gamut of government data available online, it is simply a selection based on schemes we are currently interested in. Let us look at some of the problems faced while analysing government data.

Information Mismanagement: Data on government websites is not well organised.Basic documents such as ‘State guidelines for the implementation of the JSY’ are extremely hard to locate. It is unclear whether information exists at the Central or State level, on the Ministry of Health and Family Welfare’s website, or a specific National Rural Health Mission (NRHM) page, or even whether specific guidelines exist at all. Documents are not dated properly and oftentimes the fate of Recommendations is left to our imagination. Most documents are not published in machine-readable formats such as Excel or Word that are conducive to further use. They are usually in a non-editable PDF format, where some say,“data goes to die” (Link). After much metaphorical running around, one is still unsure about the information they have accumulated, largely due to data not being presented in a consistent and sequential manner.

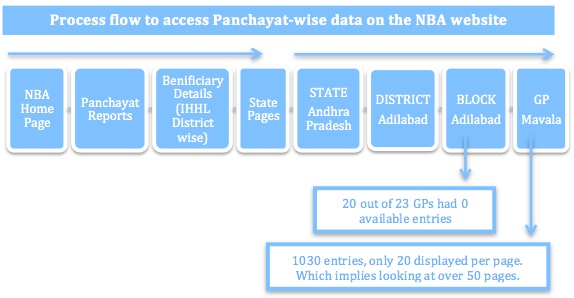
Sometimes these websites provide so many permutations and combinations for viewing data that extracting the required information becomes quite challenging. Certain data heavy pages promise information that is still about 8 clicks away, which only leads to another new set of pages to examine. For example, while checking entries for toilets constructed since 2001, we looked at Panchayat-wise data on the NBA website (Link):


This ten-minute process is for one GP, in one Block, in one District, in one State. Even if we analyse GP entries for just one State, it takes over a week to collate.

One can argue that this is precisely why datasheets have been compiled on these websites: to gather and present data in one place, but when inconsistencies such as double counting appear, we have no choice but to check the numbers ourselves. We undertook this more in-depth analysis precisely because in another GP; Anukunta (Link) 2 cases of identical BPL card numbers existed. This is also an example of data discrepancy, because the identical numbers exist only in the downloaded Excel version of the GP data and were different numbers on the NBA website. 

Lack of standardisation of units and terms: Units of measurement especially for financial reports are not standardised across documents. It requires limited skill but a considerable amount of time to convert the lakhs to crores and vice-versa. However, a more tedious process is figuring out what the exact time period of a year is for different government ministries.

For example,figures for funds “released during the year” (2011-2012) according to NBA (Central government) data (Link)in 9 states is exactly double the figure given in the individual State Annual Action plans (2012-2013).Further fact checkingrevealed that theseAction plans did not include the grant received in March because the plans are prepared for April-January. While this explains difference innumbers, it also illustrates that a very substantial grant amount remains unaccounted for in the State plans. Excluding such vital information can mean incomplete research analysis and conclusions.  

Data Discrepancies: Another shortcoming in data stems from data inconsistencies within and across different government sites.For example NBA numbers for physical achievement on one page might not match another NBA datasheet, technically providing the same information. Perhaps different calculation methods were employed, but usually no explanation is provided.This leads to uncertainty regarding which data is correct, since achievement is measured inconsistently. Another discrepancy is related to BPL/Antyodayacard numbers. Sometimes they’re an amalgam of 15 alphabetic and numeric characters (Link), sometimes the name of the beneficiary is identical to their card number (Link)and sometimes the numbers area sequence starting from 01 (Link).

Lastly, while an impressive amount of information is available on the websites of the Houses of Parliament, their Questions Search still needs refining. For example, searching for the ‘Indira Awaas Yojana’ does not bring up any hits for irregularities in the scheme, unless the term ‘irregularities’ is specifically mentioned. Additionally, IAY and ‘Indira Awaas Yojana’ bring up separate results, and when the terms are combined, the search bears no results whatsoever. Ideally, it should pull up any question with the term IAY in it; otherwise this can result in the omission of critical questions. Nonetheless, the inclusion of a ‘Wit and Humour’ page (Link) gets a nod of approval.   

Data needs to be organised, synchronised and standardised in such a way that it is simpler, cleaner and faster, and serves its primary purpose of providing accessible and correct information. Promoting accountability requires access to information. Even though the Indian government has taken some measures towards providing better access to data, an overall upgrade and clean up of GOI websites is urgently required.


[1]For an example of an effective, user-friendly interface take a look at the UK governments website (Link).

‘Air-ing’ some statistics

With the monsoons finally here, most of us have been stuck in airports waiting in vain for flights that have been cancelled. The lucky few have had to endure only delayed flights. With that all-consuming thought, we thought we’d do some digging around and we landed on the Directorate General of Civil Aviation (DGCA) website.

I think most people have heard our rants about bad quality government data, and if you haven’t, please see here, however sometimes it’s good to also show the other side.  The DGCA website (http://dgca.nic.in/) unlike a lot of other government websites is a virtual goldmine of information, ranging from flight cancellations, on-time performance, passenger data and passenger complaints, just to name a few.

We’d like to highlight some of this data.

1)     Market Share

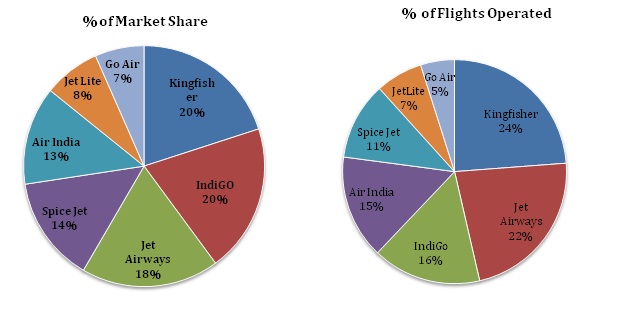
In the domestic flights section, Jet Airways and Jet Lite together account for 26.1% of the market share, followed by Kingfisher(20%) and Indigo(19.9%). Air India is much lower at 13.2% In terms of number of flights, Kingfisher and Jet Airways lead the way with 24 and 23 percent respectively with IndiGo and Air India have 16 and 15 percent respectively.


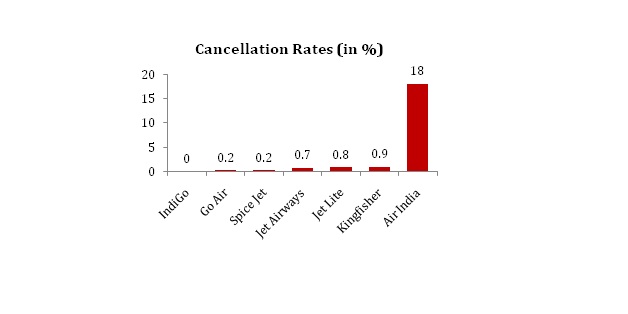
2)     Cancellation Rates

Which air-lines have the greatest number of “cancellations”? The data we have pertains to only May 2011, which is probably one of the major limitations of the website (sorry had to point this out as well) and as even a cursory glance suggests, Air India is the clear leader in terms of cancellation rates! A primary reason for this is the 10 day strike by some AI pilots, which left the airline paralysed and passengers high and dry.

3)     On-Time Performance

Over 92 percent of the flights of IndiGo and JetLite are on time whilst Spice Jet and Air India are the stragglers with 79 and 69 percent of flights on time respectively. The main reason for delays is “reactionary” (59%). This is primarily due to a vicious cycle of delayed departures and arrivals which, amongst other things, may be because of inadequate air traffic control capacity.

4)     Passenger Complaints

Figures on passenger complaints also tell an interesting story. In May 2011, despite the cancellations and delays, Air India had the least number of complaints at 1.4 complaints per 10,000 passengers. Kingfisher and JetLite also had few complaints, while surprisingly Jet Airways left a lot of travelers in a petulant mood with 3.3 complaints per 10,000 passengers.

While none of the data spouted above may help us in actually planning our travels, we thought it would be interesting to know the statistics! If this is not enough, then some good news for stranded passengers – a recent Supreme Court judgment has made it mandatory for airlines to serve passengers food and water if the airline has been delayed beyond 3 hours!!

The life and times of Mamta Didi

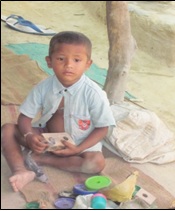
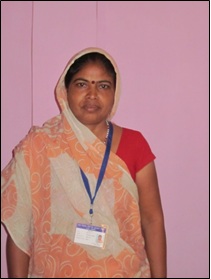
 Ask anyone where the Anganwadi Centre (AWC) is in Paschimi Gaon (name changed for privacy) in Lucknow and you are directed to an Anganwadi worker’s house. Its courtyard has a large mat where 15 children aged 3-6 years are sitting, playing with broken toys. The walls are covered with posters of alphabets so faded that they look more than a decade old, and the nearby hand-pump no longer works. This is Mamta Didi’s house, an Anganwadi Worker (AWW) for the past 19 years.
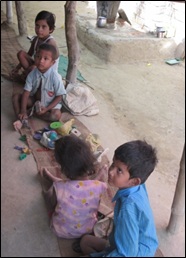

We were in Lucknow as part of a workshop on PAHELI – a Peoples Audit on Health, Education and Livelihoods and one of our tasks entailed interviewing AWW’s about their roles and responsibilities and tracking the amount of money that reaches an AWC.

For those who may be unfamiliar with the Integrated Child Development Services (ICDS) scheme,  AWC’s are the main unit of service delivery and have now been acknowledged as the first outpost of health, nutrition and early learning at the habitation level (details of the scheme can be found here and here). Anganwadi Workers (AWW) and Anganwadi Helpers (AWH) thereby are the front-line functionaries at AWC. Over time, AWW’s in the government’s own words “have emerged as the central figure for child care and development under the ICDS scheme”

.

And indeed, take a look at Mamta didi’s job responsibilities and you would amazed at the number of responsibilities she handles – literally covering an entire lifecycle. Even the guidelines (they can be found here) list 21 tasks that an AWW is meant to do. To give a brief idea – every year Mamta Didi’s work starts with a survey of the families in the village to keep track of the number of young children below the age of 6, adolescent girls and pregnant women. She needs to monitor the health of the adolescent girls (kishori’s), and provide them with take home ration/food in accordance with the recently launched Kishori Shakti Yojana (KSY). As soon as a Kishori gets married, Mamta didi is responsible for providing contraceptives to her and once the Kishori plans to have children, give her health advice. Once pregnant, Mamta helps the Primary Health Clinic (PHC) staff and Accredited Social Health Worker(ASHA) with conducting the ante and post natal checkups and then provides the pregnant and lactating mother (erstwhile Kishori) with rations. Once the baby is delivered, she assists the family in birth registration. In addition, she assists the local PHC staff in a myriad of activities including organization of immunization camps and health checkups, measurement of height and weight of children, provision of counselling to caregivers and organization of non-formal pre-school activities. Mamta Didi’s work thus goes much beyond the responsibility of providing nutritional support to children and mothers.

And then there are the registers – a task in themselves!

The Government of Orissa’s Women and Child Development website (link here) for instance pegs the number at 14 registers. These include a family survey register, daily stock register, an immunization register, daily diary, growth monitoring chart, a supervision-cum-visitor book – the list goes on. In addition, the AWWs are also expected to maintain Monthly Progress Reports capturing information ranging from population details, births and deaths of children, maternal deaths, number of children who attended AWC for supplementary nutrition and pre-school education, nutritional status of children by looking at their age appropriate weight, information home visits by AWW etc. These progress reports are meant to be sent to the officers in charge on the 5th day of every month. (For more details on the monitoring mechanisms, see here)

Given the extent of their responsibility, one would imagine that a lot of attention is being paid to the AWC, but that is definitely not the case. To give a few examples:-

1)     Infrastructural Facilities: Most AWC’s continue to run from the house of the AWW, with no compensation given to her. While the guidelines mention a rent allowance, during our field visit, no one had heard of such a thing. Most AWCs further lack adequate drinking water and toilet facilities – a fact admitted even by the Minister of Women and Child Development in a reply to a question in the Lok Sabha, when she said, “the Government has information available in respect of 11.13 lakh AWCs/ mini-AWCs in 33 States/UTs according to which 57.48% AWCs have drinking water facilities within the premises and 6.61% AWCs have toilet facilities.” (link available here). Similar findings have been found in evaluations conducted by NCAER and the Planning Commission amongst others and their findings can be found on the ICDS website itself.

2)     Kits and small items: While the guidelines mention that a medicine Kit, Pre-school Education Kit, Joint Mother & Child Protection Card, Growth Monitoring Chart and other Petty items such as tumbler, bucket, mug etc. are to be provided to each AWC every year, they usually do not come.

3)     Finances: Some of the grants mentioned in a government notification include contingency grants for each AWC, Monitoring and Evaluation grants,  monies for replacement of registers, weighing scales etc @ Rs. 200 per functional AWC, a flexi fund of Rs. 1000 per AWC for activities like transportation of ICDS beneficiaries requiring urgent medical care, local innovations, etc. However not ONE of the AWCs we visited had ever heard of the flexifund scheme nor received any such grant. Instead the only thing the AWC had received was a cupboard, a chowky, a medicine kit (of which many medicines had now expired) and a weighing scale many years ago.

4)     Food and Rations: The AWC is meant to provide both dry take home rations as well as hot cooked food – the ration of which is supposed to come on a regular basis. However, even this does not come regularly. In the AWC’s we visited, while the dry ration had come the rations for the hot-cooked meal had not come for the past 2 months!

In such a situation, it is hard to imagine how an AWW carries out her many responsibilities, that too at a minimal salary. But there is some hope. Effective from 1st April 2011, the Cabinet Committee on Economic Affairs finally approved the enhancement of Honoraria for Anganwadi Workers to Rs.3000/- from Rs.1500/- per month and for Anganwadi Helpers and Workers of Mini-AWCs to Rs.1500/- from Rs.750/- per month. However, when we had visited Mamta didi in end of May, she and her helper had not even received their previous honorarium of 3 months!

Yet, when you ask her about how she feels to be an AWW, she smiles proudly showing off her recently received “badge” and uniform (a sari worth Rs. 200) and says, “Don’t I look professional- please take a photo!”

When the mirror has 2 faces: the story of governments own datasets not matching!

A few months back I was searching for release and expenditure data for Sarva Shiksha Abhiyan (SSA). Since the financial management section of the SSA portal hasn’t been updated in 2 years (the latest available information is August 2008!), I was left struggling to find places to look. Luckily, I remembered that we now we have a tool – the Right to Information Act – an easy method to get information.  So I decided to file my first RTI !

At the outset, let me just say that I got an amazing response. The PIO officer in-charge was prompt in his response, transferred some of my queries to the relevant departments and even sent them reminder letters to send me the information on time. So for those sceptical about filing RTI’s – go ahead, give it a shot, you might be surprised! But this post isn’t about filing RTI’s. It’s about what the RTI revealed.

 The RTI showed the complete chaos and confusion that exists within government databases. Information on state-wise expenditures and releases for SSA  in 2008-09 from the Joint Review Mission( available on the SSA website here) put the All India total GOI release for SSA in 2008-09 at Rs. 1,270,533 lakh and the total expenditure for SSA, during the same period at Rs. 1933231 lakh.  However, the same data in the RTI gave the figures of Rs. 1,261,120 lakh and Rs. 1,905,652 lakh respectively.

 For more details, please see that table below giving the state-wise variations. 

State

GOI release according to Joint Review Mission

( in Rs. Lakh)

GOI Release according to the RTI

( in Rs. Lakh)

Difference

( in Rs. Lakh)

Tamil Nadu

45,414

53,241

7,827

Himachal Pradesh

8,553

10,513

1,960

Arunachal Pradesh

13,684

15,568

1,884

Mizoram

5,113

3,873

1,240

Delhi

1,529

1,029

500

Nagaland

2,868

2,368

500

Dadra & N. Haveli

105

85

20

Madhya Pradesh

85,569

85,570

1


State

Total expenditure according to Joint Review Mission

( in Rs. Lakh)

Total expenditure according to the RTI

( in Rs. Lakh)

  Difference


( in Rs. Lakh)

Bihar

209,431

226,382

16,951

Chhattisgarh

75,101

82,246

7,145

Mizoram

2,127

5,244

3,117

Such vast differences – (for Bihar amounting to Rs. 16,951 lakhs of rupees!) can’t be blamed on “reporting errors”. Instead, they raise some important questions.

How do we know which is the “correct” data? How are schemes and programmes expected to function efficiently and be successful when no one is sure how much money is being released or spent? And most importantly, how can we expect to have transparency and accountability when our government databases are in shambles?

While organisations like the Comptroller and Auditor General (CAG) do their part in highlighting some of the discrepancies or errors in government data, they can’t overhaul the entire system. But it’s obvious – it’s time we get back to the basics- get our data clean. And whether the UID can assist in this process – I guess we’ll have to wait and watch!

Avani Kapur is Senior Research and Program Analyst, Accountability Initiative.

Rants of a Public Finance Junkie

For the past few months, my colleague and I had been holed up at the National Institute of Public Finance and Policy (NIPFP), trying to “uncover” the wonderful world of state budgets. Our task appeared to be simple – we wanted to categorise the elementary education budget for various states into more accessible and functional categories, thereby enabling us to estimate the “cost” of various inputs in delivering elementary education. This would further allow us to compare differing state priorities on the basis of the “type” of allocations/ expenditures. So for instance, since we were working on education, the categories consisted of:-

  • School Infrastructure
  • Teacher salaries,
  • Teacher inputs (such as training, materials etc),
  • Entitlements for children such as uniforms, textbooks etc,
  • Mainstreaming of children (out of school etc),
  • “Quality” related inputs and,
  • Administration.  

Did I say simple? Umm… not so much. Let me explain.

The existing system of classification divides the Consolidated Fund of India (namely, the fund from which all expenditures of the Government are incurred into Revenue and Capital Sections (for more details on revenue and capital expenditure please see here) and requires that all expenditures be categorized into these two broad divisions at the highest level. At the operational level, all allocations and expenditures are classified using a 6 tier hierarchical classification. These are:-

Classification

Type of Classification

Major Head

Represents the major functions of the government

Sub-Major Head

Represents the sub-functions of the government

Minor Head

Refers to government programmes

Sub-Head

Schemes of the government

Detailed Head

Representing sub-schemes

Object Head

The economic “type” of expenditure

Thus for example in education, if we wanted to know the amount of money being allocated for the Centrally Sponsored Scheme (CSS) providing grants in aid to SCERT for teacher training institutions, we would have to drill down from:-

2202- General Education (Major Head)

                01 – Elementary Education (Sub-Major Head)

                                001- Teacher Training (Minor Head)

                                                85- Teacher Training Institution

                                                                99- Grants in aid to SCERT

                                                                                31- Grants in aid to SCERT  (CSS)

(for more details on Minor Heads and Major Heads, please see here)

OK, now having detailed the task at hand, let’s get to the problems (this is going to be a long list). So reader patience is advised.

1)     Logistical
One of the first (though probably the least important given the list!) is the sheer logistics of looking at state budgets. Many states do not have their budgets online, or if they do the links don’t always work, and past years’ budgets are unavailable. Moreover, often while the overall budget is available, the “detailed demand for grants” (necessary for disaggregation) is not. The task thus requires access to a library such as NIPFP and a LOT of manual data entry! Moreover, the sheer volume of budgets (some states have 9 volumes) results in a lot of heavy lifting! Further, some budgets are only in Hindi, which makes it difficult for those whose vernacular is not Hindi to access such documents    

2)     Lack of Uniform Accounting systems 

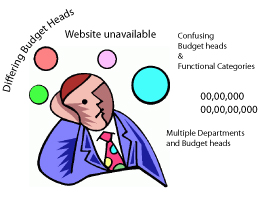
a. Differing Budget Heads:

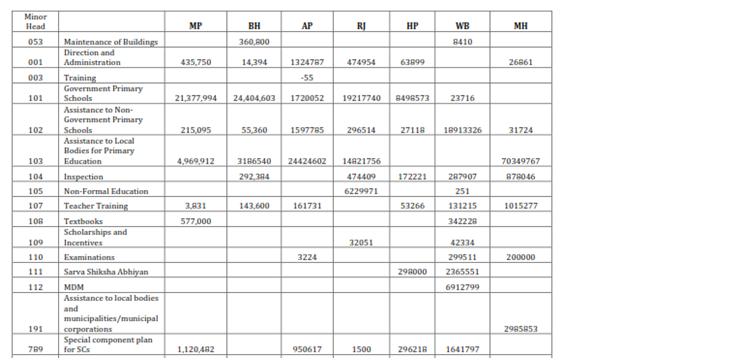
Under the current system of classification, functions not only repeat themselves under revenue and capital sections but more importantly, there is no uniformity of classification in terms of budget heads across states. A look at the table below containing collated information for 2008-09 indicates the basic problem. For each state, allocations are booked under different budget heads. To give an example, while Sarva Shiksha Abhiyan should technically be a sub-minor head (as it is a scheme), it is sometimes included as a minor head (a government programme). As a result, while Himachal Pradesh and West Bengal give SSA separately as a minor head (111), for other states it comes as a sub-minor head under government primary schools (101). Similarly, for some states such as Madhya Pradesh and West Bengal, textbooks have been mentioned separately, it does not mean that other states do not provide textbooks. The truth is that in other states it is booked under a detailed head.

Source: Compiled from the Comptroller and Auditor General, State Finance Reports. Numbers are provisional.

b. Functional Categories not always “functional”

As the recently released Rangarajan Committee Report (see here) – (a must read for those interested in public finance) aptly recognises, “functional heads should be really functional” – though that is often not the case. For instance, a major head like 2552 (North Eastern Areas), does not really signify any “function” of the government and even expenditure on education in North Eastern Areas is shown under this head. As such, as the report highlights “This is a geographical attribute camouflaged as functional attribute”, increasing the difficulty in classifying budgets.

c. Lack of Uniform Measurement units

Related to the lack of uniform budget heads is the lack of uniform units of measurement. While some states report in lakhs, others in crores, others in thousands, some states such as West Bengal report actual numbers. Collating these in itself becomes a cumbersome process and requires us to have our 0’s in order!

d. Decoding some of the Budget Heads

A further complication caused by the lack of uniform budget heads was the fact that often the detailed object heads were missing, resulting significant problems with decoding the budget heads. For instance, a budget head such as “Assistance to local bodies” consists broadly of monies provided to Gram Panchayats etc for the delivery of education. Within it, however there would be components of salaries, administrative expenditure, maintenance works, inspection, and even actual schools built by the Zilla Parishad. 

3)     Dealing with Multiple Departments or Budget heads other than 2202.01

While some states, such as Karnataka and Rajasthan classify their budgets only according to budget heads, for most states it is done department wise. An example below:

One would imagine that education would be under the Department of Education. Unfortunately, that is not necessarily true. State governments also draw funds from the Tribal Welfare Department, Social Welfare and Justice Department, the Planning Department and Public Works Department amongst others. While some states book grants from Tribal Department and Social Welfare Department within 2202.01 as Tribal Area Sub-Plan and Special Component Plan for Scheduled Castes, others would require going through each and every department within the state budget.  For instance, a state such as Chhattisgarh had the education budget head in 14 different departments , while in Maharashtra, the planning department gives elementary education for each district (35 of them) separately!

In other cases, within the department of education itself, other budget heads such as 2059 (public works), 2225 (welfare of SCs), 2235(welfare of STs etc) are included further complicating the collating system.

Given the current push for accountability and transparency, it is surprising that detailed state budgets continue to be inaccessible to most. It is no wonder that for many (including me!), understanding and more importantly analyzing them remains an extremely daunting task. While, initiatives such as the the RBI’s annual State Finances –A Study of Budgets by the RBI (link here) are commendable, they still do not give the disaggregation required for us public finance junkies !

I am happy to report that we managed to task at hand, at least for the 7 states we were studying (For a look at the results, please look here), and since we are gluttons for punishment, we hope soon to do similar classifications for more states and even more sectors. Wish us luck (and sanity)!            

Why do politicians transfer bureaucrats?

Elected politicians and bureaucrats are important pillars of governance. In India and in many other countries, politicians have very limited powers over the bureaucrats, at least in theory.  For example, a politician in India does not have any control over the recruitment of  IAS officers. He can’t change their wages, can’t dismiss them nor demote them. In some sense, this is desirable, to avoid the politicization of policy implementation. But then the question arises: how would a politician facing electoral pressures ensure that his pet projects are being implemented by the bureaucrats over whom he doesn’t have any control. Of course, a politician can offer the bureaucrat, non-monetary incentives or can pick somebody who shares his world view.

I just came across a very interesting research paper by Laxmi Iyer and Anandi Mani, (Traveling Agents: Political Change and Bureaucratic Turnover in India’, November 2009), which explores the phenomenon of the power of politicians to transfer the bureaucrats to retain control over them.

Transfer of bureaucrats by politicians is not something unheard of, at least in India. Some of our Chief Ministers are actually famous for their tendency to transfer bureaucrats. This has prompted demands to put explicit limits on the politicians’ ability to transfer bureaucrats before they complete, say, at least two years of service in that position.

The authors build a theoretical model, based on some realistic assumptions in the Indian context. A noteworthy feature of the paper is that the predictions of the model are empirically verified by using a very unique dataset on the career histories of 2800 IAS officers between 1980 and 2004, combined with data on political changes in major Indian states over the same period, proxy measures for bureaucrats’ ability, and a measure of the relative importance of different posts as viewed by the bureaucrats themselves. I won’t go into details about the data. But it’s worth reading to see the efforts taken by the authors to collect such unique data.

What are their findings?

First, they find that IAS officers are indeed transferred quite frequently. Over the period of 1980-2000, the probability that an officer gets transferred is 53%. The average tenure of the IAS officers is merely 16 months.

Secondly, consistent with the hypothesis that the politicians use transfers as a control mechanism, they find that the average rate of bureaucrat transfers increases significantly, by 10% over the baseline of 53%, when there is a new Chief Minister. Most of these transfers take place in the first four months after a new CM takes over.  Further, a CM who comes to power along with a new party in power, is twice as likely to transfer bureaucrats than a CM who comes to power without a change in the party in power.  The majority of such transfers are what authors call ‘lateral’ transfers, i.e. not accompanied by promotion. Thus, these transfers are not for a reward for past performance or routine promotions that merely coincide with a new CM coming into the office.

The bureaucrats with a higher ability invest more in developing expertise, they undergo longer durations of training over the course of their entire career. These officers are also significantly more likely to be recommended for senior positions in the central government (‘empaneled’).  But there is another way of obtaining important positions- by being ‘loyal’ to specific politicians. The authors find that the officers are more likely to be appointed to important positions when they belong to the same caste as the CM’s party base.

Disturbingly, the average importance of the posts held by an officer over the course of his or her career does not vary significantly with his ability– the officers with high ability are no more likely to be assigned to important posts than other (say, loyal) officers.

May be it’s time to pressurize the political establishment to pass the ‘Public Services Bill’, which stipulates that the bureaucrats can’t be transferred before completion of at least two years in that position. No wonder, only eleven states in India have agreed, while ten states have refused outright!