I ended my last blog by observing that questionnaires on corruption related surveys are often cut and paste jobs from earlier surveys, with little thought given to the particular context or environment in which a survey is proposed to be conducted. This is particularly harmful when attempting to measure corruption, because of wide ranging perceptions of which transactions constitute ‘corruption’, held by different cultures, legal systems and nations.
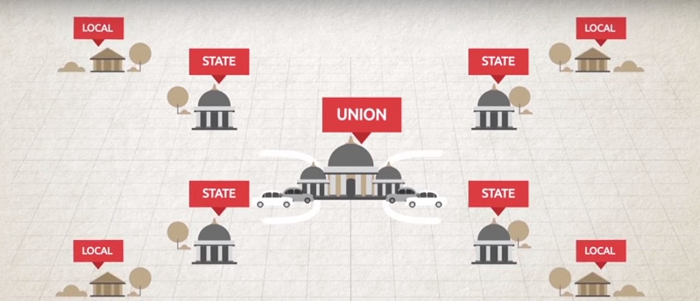
A researcher from Europe once observed in a panel discussion that I was part of, that there is a North/South divide in the definition of corruption. She averred that the distinction between ‘grand’ and ‘petty’ corruption is an artificial one created by the North and is, for the most part, applied to monitor behaviour in the South. There are double standards, she said. Therefore, anti-Corruption campaigns in the South single out relatively less harmful or merely dysfunctional behaviour in the South as ‘corruption’, when such acts are merely controversial in the North. Thus global corruption barometer surveys, comparison of civil society practices and such like, only reveal very broad trends across countries, she said, and could never provide solutions for reducing corruption, process by process.
That was quite a thought provoking statement for me, and took me back to understanding the value of what one had attempted to do, whilst running the ipaidabribe.com website.
For those who don’t know, I used to work in an NGO named Janaagraha that started a website named ipaidabribe.com, in 2010. For two years, I led the team that ran the site and played a key role in designing, rolling out and upscaling the efforts of the site. What the site did was to solicit experiences relating to corruption, from citizens, on a condition of anonymity.
Citizens’ reports were collected under three broad heads, namely, ‘I paid a bribe’, ‘I didn’t pay a bribe’ and ‘I did not have to pay a bribe’ (now named as ‘I met an honest officer’).
Apart from a drop-down menu that covered about 20 departments, 50 plus services and a column for indicating the volume of the bribe paid, the website did not prescribe any format for recording citizens’ experiences. People who logged into the site were able to write in as much detail as they wished. When public reports began to accumulate, we discovered that unstructured reporting had its advantages. People were writing in, describing their emotions when they paid the bribe. Those who successfully resisted corruption wrote in detail about the tactics that they used to beat corruption. Those who had the good fortune to meet an honest officer wrote in volubly about the honest attributes of these officers.
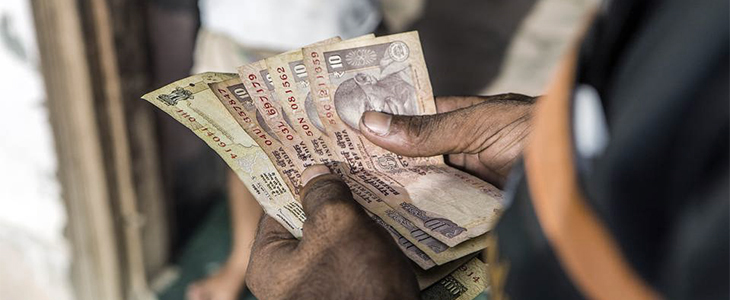
From the haze of the unstructured reports, trends and patterns began to emerge, once there were enough reports available for research. For example, from the multitude of reports – about 85 percent of all reports received – of people paying bribes, we began to recognise that those who paid bribes justified their action through reasoning that fell into a pattern. Most of those who paid bribes, felt a need for speed, which was tied to the idea of undertaking a process ‘conveniently’. Some paid because they were ignorant of processes and were unwilling to learn about them. They were taken in by misinformation by middlemen and agents. Many paid out of fear and nervousness, and even out of relief; they were generous when a major transaction in their lives were completed – such as the purchase of a flat – that they generously ‘tipped’ the government staff involved. Some paid in fear of justified, unjustified or excessive punishment. They were often persuaded by peers and mentors (Children who obtained driving licences said that their parents persuaded them to bribe, in order to avoid ‘trouble’).
The worst form of corruption was when people paid to avoid business loss, or paid for mutual benefit, to the detriment of the government’s interests – as in the case of undervaluation of properties to avoid payment of registration fees or property tax. Similarly, from the reports of those who successfully resisted corruption, we distilled 10 behaviour patterns or tactics that were effective in stopping the corrupt in their tracks. We termed these, the ‘Ten Commandments for Fighting Corruption’.
The emergence of patterns in why people paid bribes would not have happened if the crowdsourcing of reports was not through an unstructured manner. The very nature of ipaidabribe.com, as a forum where one could unburden oneself of one’s frustration and confusion at having been compelled to pay bribes, enabled the rich documentation of peoples’ emotional state while they paid bribes. From a survey standpoint, ipaidabribe.com probably unwittingly, stumbled upon the realisation that the indicators for corruption need not be structured, but they could themselves emerge through the process of crowdsourcing. Besides, because the site was a continuous collector of experiences, it enabled a real time monitoring of citizens expectations and experiences. It also had the potential to emerge as a tool by which those involved in process change could constantly obtain feedback on whether their reform efforts in cutting red tape or streamlining processes, were actually bearing fruit.
However, the question is whether the rich database in ipaidabribe.com was actually used to undertake a range of analyses that was possible. That is not for me to judge, but for users of the site. What is beyond doubt is that the potential of crowdsourcing as a survey methodology, remains as huge as it was, when the site was launched.
T R Raghunanadan, an advisor to the Accountability Initiative (AI) at Centre for Policy Research, is a pioneer on corruption work and was the programme head of the first website launched to address the issue called ipaidabribe.com. Understand corruption systemically; break down the different types of corruption and the various ways in which both the state and citizens can tackle it through this podcast.